Hydration Products Market Analysis, Size, and Forecast 2025-2029: North America (US and Canada), Europe (France, Germany, Italy, and UK), APAC (China, India, Japan, and South Korea), and Rest of World (ROW)

Hydration Products Market Analysis, Size, and Forecast 2025-2029:
North America (US and Canada), Europe (France, Germany, Italy, and UK), APAC (China, India, Japan, and South Korea), and Rest of World (ROW)

Published: May 2025 223 Pages SKU: IRTNTR43078

Market Overview at a Glance

$656.2 Mn
Market Opportunity
10.1%
CAGR
9.0
YoY growth 2024-2025(%)

Hydration Products Market Size 2025-2029

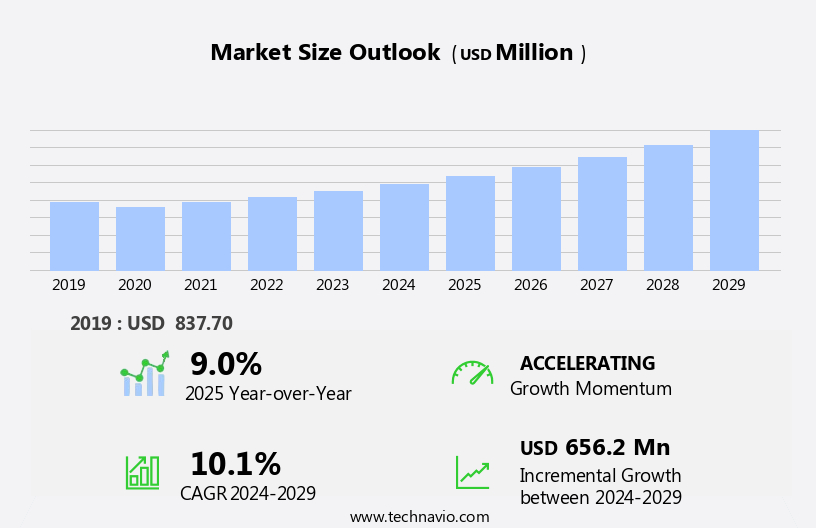
The hydration products market size is forecast to increase by USD 656.2 million at a CAGR of 10.1% between 2024 and 2029.

  • The market is witnessing significant growth, driven by the increasing military expenditure and the demand for smart, interactive hydration solutions. Military personnel require optimal hydration to perform at their best, leading to a demand for advanced hydration products. Furthermore, the integration of technology into hydration products, such as sensors and mobile applications, is creating new opportunities for market expansion. However, the high cost of hydration products poses a significant challenge for both manufacturers and consumers. Despite this obstacle, companies can capitalize on the market's growth potential by focusing on innovation, cost reduction strategies, and targeting specific consumer segments, such as athletes and outdoor enthusiasts.  With the global population becoming more health-conscious, there is a rising demand for hydration products that offer added nutritional benefits.
  • By addressing the cost challenge and continuing to develop technologically advanced hydration solutions, market players can differentiate themselves and capture a larger share of the market. The threat from other health and wellness products, such as functional beverages and nutritional supplements, is intensifying.

What will be the Size of the Hydration Products Market during the forecast period?

Hydration Products Market Size

 Request Free Sample

  • The market continues to evolve, with ongoing dynamics shaping its applications across various sectors. Electrolyte replenishment and hydration benefits remain at the forefront, driving innovation in sports and healthcare. Hydration in schools is gaining significance, with tablets and powders offering convenient solutions. Hydration physiology and strategies are under constant scrutiny, influencing the development of water bottles, hydration systems, and monitoring technologies. Water security and scarcity are pressing concerns, leading to advancements in water filtration and conservation. Hydration for work and manufacturing is essential, with solutions addressing unique challenges. Hydration in healthcare and hospitals is critical, with oral rehydration therapy and hydration packs playing crucial roles. Brands are investing in product innovation, including absorption rate technology, artificial intelligence, and personalized nutrition, to optimize performance and cater to evolving consumer needs.
  • The military and emergency services prioritize hydration for optimal performance and safety. Hydration education and awareness are vital, with guidelines and recommendations shaping hydration needs and strategies. Hydration technology continues to advance, addressing the diverse hydration requirements of seniors, children, and travelers. Water management and quality are paramount, with ongoing research exploring new hydration solutions and addressing dehydration prevention. Social responsibility and brand reputation are increasingly important considerations, with companies focusing on recyclable packaging, loyalty programs, and strategic partnerships with sports medicine professionals and fitness organizations. The market's continuous dynamism underscores the importance of staying informed and adaptive to meet the evolving hydration needs of individuals and industries.

How is this Hydration Products Industry segmented?

The hydration products industry research report provides comprehensive data (region-wise segment analysis), with forecasts and estimates in "USD million" for the period 2025-2029, as well as historical data from 2019-2023 for the following segments.

  • End-user
    • Sports
    • Military
    • Others
  • Product
    • Hydration backpacks
    • Water bottles
    • Purification and filtration
    • Accessories
    • Others
  • Distribution Channel
    • Offline
    • Online
  • Geography
    • North America
      • US
      • Canada
    • Europe
      • France
      • Germany
      • Italy
      • UK
    • APAC
      • China
      • India
      • Japan
      • South Korea
    • Rest of World (ROW)

By End-user Insights

The sports segment is estimated to witness significant growth during the forecast period. Hydration products play a crucial role in various sectors, including sports, healthcare, agriculture, manufacturing, and workplaces. The importance of maintaining optimal hydration levels is well-established in hydration science, with guidelines emphasizing regular intake of water and electrolytes for athletes, children, seniors, and individuals in emergencies. Hydration systems, such as reservoirs and bottles, are essential for athletes to stay hydrated during strenuous activities. The growing popularity of adventure sports and tourism fuels the demand for these products. Water conservation is another significant factor driving the market, with water filtration and purification technologies gaining prominence. The market primarily relies on offline distribution channels, including retail formats such as specialty stores, hypermarkets, supermarkets, convenience stores, and warehouse clubs.  Water scarcity and quality concerns have led to the development of advanced hydration solutions, including hydration tablets, powders, and oral rehydration therapy.

Hydration Products Market Size

Request Free Sample

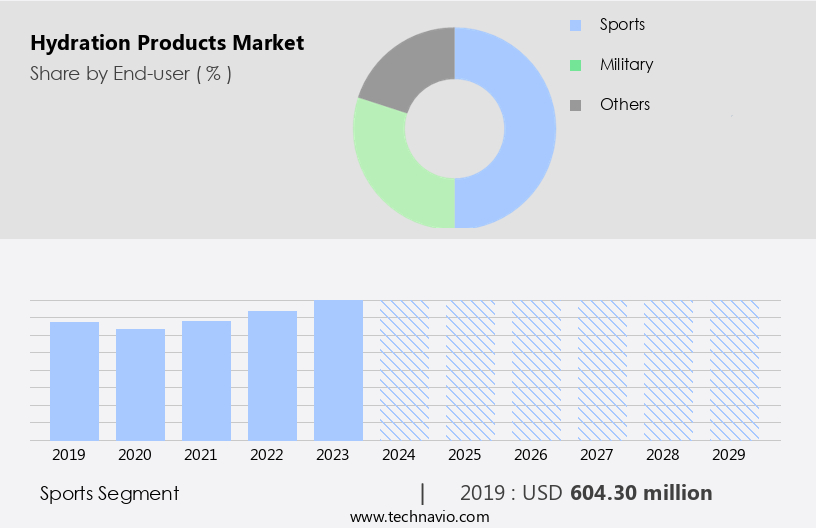
The Sports segment was valued at USD 604.30 million in 2019 and showed a gradual increase during the forecast period. Innovation pipelines focus on sugar-free options, organic certification, vegan alternatives, and functional food ingredients to cater to diverse consumer demographics and dietary restrictions.  Hydration technology is continually evolving, with innovations in hydration monitoring, water security, and hydration packs. Hydration in healthcare and agriculture is equally important, with dehydration prevention being a critical aspect of patient care and crop management. In hospitals, hydration is essential for patient recovery and maintaining overall health. In the military, hydration is crucial for maintaining operational readiness and endurance. The importance of hydration extends to workplaces, with hydration for work being a growing trend. Hydration education and awareness campaigns are increasingly being implemented to promote the benefits of proper hydration and to address hydration challenges. The market for hydration products is expected to continue growing as the importance of hydration becomes more widely recognized.
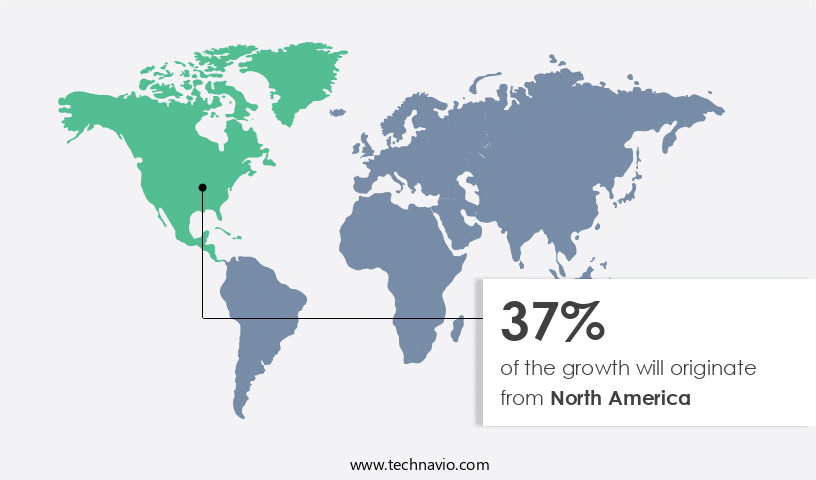
Regional Analysis

North America is estimated to contribute 37% to the growth of the global market during the forecast period. Technavio's analysts have elaborately explained the regional trends and drivers that shape the market during the forecast period.

Hydration Products Market Share by Geography

 Request Free Sample

The market in the US is witnessing significant growth due to various factors. The increasing popularity of adventure sports, particularly in states like Colorado, Utah, and Virginia, is driving demand for hydration solutions. These activities, which include white-water rafting on the Colorado River, require athletes to maintain optimal hydration levels for peak performance and safety. The growth of adventure tourism is also fueling the market, as travelers seek experiences in natural environments. Hydration science plays a crucial role in these activities, with athletes and outdoor enthusiasts relying on sports drinks, electrolyte replenishment, and hydration systems to maintain their hydration status.

In manufacturing, industries are implementing hydration strategies to ensure worker safety and productivity. Hydration is also a priority in healthcare, agriculture, and military applications, where maintaining hydration levels is essential for overall health and well-being. Water conservation and water quality are significant concerns, leading to the adoption of water filtration and purification technologies. Hydration education and awareness programs are also gaining traction, with organizations promoting hydration guidelines and recommendations for various populations, including children, seniors, and travelers. Hydration monitoring systems and hydration packs are becoming increasingly popular, enabling individuals to track their hydration needs and ensure they stay adequately hydrated throughout the day.

The hydration market encompasses various products, including hydration tablets, powders, and water bottles, catering to diverse applications and consumer preferences. Hydration technology continues to evolve, with innovations in oral rehydration therapy and hydration physiology contributing to advancements in hydration solutions. The market's growth is further fuelled by the increasing awareness of dehydration prevention and the challenges of water scarcity in some regions. Overall, the market is a dynamic and evolving landscape, driven by the diverse needs of consumers and the ongoing research in hydration science.

Market Dynamics

Our researchers analyzed the data with 2024 as the base year, along with the key drivers, trends, and challenges. A holistic analysis of drivers will help companies refine their marketing strategies to gain a competitive advantage.

What are the key market drivers leading to the rise in the adoption of Hydration Products Industry?

  • The significant rise in military expenditures serves as the primary catalyst for market growth.  The market experiences growth due to the increasing importance of hydration in various sectors. In sports, athletes prioritize hydration for optimal performance and endurance, adhering to hydration guidelines. Water filtration and purification technologies are essential for ensuring safe and clean water sources during training and competitions. In healthcare, hydration is crucial for maintaining overall health and wellness. Hydration systems are used to deliver water and electrolytes to patients, particularly those with chronic conditions or undergoing surgery. In manufacturing, maintaining a hydrated workforce is essential for productivity and worker safety. Hydration systems help ensure employees have easy access to clean water throughout their shifts.
  • In agriculture, hydration plays a role in maintaining the health of livestock and crops. Water conservation is also a concern, making efficient hydration systems a priority. In the realm of science, advancements in hydration research continue to uncover the importance of proper hydration in various aspects of life. Hydration systems are designed to meet the unique needs of different industries and applications. In the industrial and commercial sectors, hydration systems are used to provide clean water for various purposes, including cooling systems and manufacturing processes. These systems ensure operational efficiency and reduce the risk of costly downtime due to water-related issues. Overall, the market for hydration products is driven by the diverse needs of various industries and the importance of maintaining optimal hydration levels for health, performance, and productivity.

What are the market trends shaping the Hydration Products Industry?

  • The market is increasingly favoring smart and interactive hydration products as the next big trend. These innovative items offer advanced features to ensure optimal hydration levels. Hydration products have gained significant attention in various sectors due to their importance in maintaining optimal hydration levels. These products are essential for emergencies, children, hospitals, and military personnel. Hydration education is a crucial aspect of promoting the importance of hydration status. Innovations in hydration solutions continue to emerge, with smart hydration products leading the way. For instance, Sportline's HydraCoach water bottle offers real-time fluid consumption tracking, providing valuable insights into daily hydration intake. Gatorade's smart cap features LED lighting that sets hydration reminders, ensuring consumers stay hydrated throughout the day.
  • Hydration research is ongoing to develop more effective hydration solutions. Water safety and dehydration prevention remain key focus areas for manufacturers. The market dynamics continue to evolve, with companies introducing new and innovative hydration products to cater to diverse consumer needs.

What challenges does the Hydration Products Industry face during its growth?

  • The escalating costs of hydration products pose a significant challenge to the industry's growth trajectory. Hydration products play a crucial role in ensuring electrolyte replenishment and maximizing hydration benefits for consumers engaged in various activities. These products cater to diverse segments, including sportspeople, military personnel, and individual consumers. The market for hydration products offers a range of offerings, including water bottles, reservoirs, purification and filtration systems, and hydration tablets or powders. Innovation pipelines focus on sugar-free options, organic certification, vegan alternatives, and functional food ingredients to cater to diverse consumer demographics and dietary restrictions. The demand for hydration products is driven by the importance of maintaining optimal hydration levels for optimal physiological functioning. In schools, initiatives have been implemented to promote hydration strategies, recognizing the significance of hydration for academic performance and overall health.
  • The market is characterized by key players offering innovative solutions to cater to various customer segments. While price differentiation is a factor among these companies, the specialized nature and limited applications of hydration products contribute to their higher pricing compared to regular water bottles. In developing countries, ordinary water bottles are commonly used in place of specialized hydration products due to affordability constraints. However, the importance of hydration for work, hydration physiology, and water security, particularly in regions experiencing water scarcity, highlights the need for accessible and effective hydration solutions. Hydration monitoring technologies have emerged as an essential tool for maintaining optimal hydration levels, providing real-time insights into an individual's hydration status. These advancements underscore the ongoing evolution of the market.

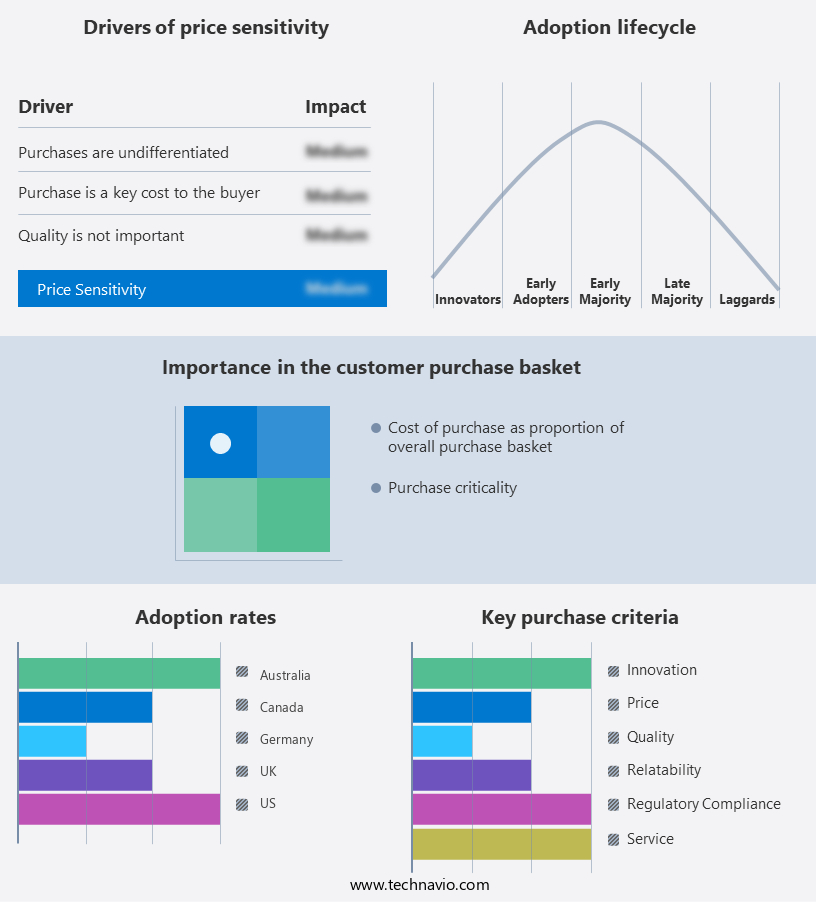
Exclusive Customer Landscape

The hydration products market forecasting report includes the adoption lifecycle of the market, covering from the innovator's stage to the laggard's stage. It focuses on adoption rates in different regions based on penetration. Furthermore, the hydration products market report also includes key purchase criteria and drivers of price sensitivity to help companies evaluate and develop their market growth analysis strategies.

Hydration Products Market Share by Geography

 Customer Landscape

Key Companies & Market Insights

Companies are implementing various strategies, such as strategic alliances, hydration products market forecast, partnerships, mergers and acquisitions, geographical expansion, and product/service launches, to enhance their presence in the industry.

A. O. Smith Corp. - The company specializes in providing hydration products, including advanced water purification solutions, including Reverse Osmosis (RO) and Ultraviolet (UV) water purifiers.

The industry research and growth report includes detailed analyses of the competitive landscape of the market and information about key companies, including:

  • A. O. Smith Corp.
  • ANTA Sports Products Ltd.
  • Aquamira
  • BRITA SE
  • Cascade Designs Inc.
  • Dometic Group AB
  • Ergodyne
  • Helen of Troy Ltd.
  • HydraPak LLC
  • Klean Kanteen
  • Leatt Corp.
  • Lifetime Brands Inc.
  • Nestle SA
  • Newell Brands Inc.
  • Safariland LLC
  • Samsonite International SA
  • TECHNICHE LLC
  • Thermos LLC
  • Vista Outdoor Inc.
  • Zhejiang Haers Vacuum Containers Co. Ltd.

Qualitative and quantitative analysis of companies has been conducted to help clients understand the wider business environment as well as the strengths and weaknesses of key industry players. Data is qualitatively analyzed to categorize companies as pure play, category-focused, industry-focused, and diversified; it is quantitatively analyzed to categorize companies as dominant, leading, strong, tentative, and weak.

Recent Development and News in Hydration Products Market

  • In February 2024, Danone, a leading food-focused business, announced the global launch of its new line of Essensis electrolyte water, designed to cater to the growing demand for functional hydration products (Danone Press Release, 2024). This strategic expansion signifies a significant investment in the hydration market, as consumers increasingly seek convenient, health-conscious beverage options.
  • In May 2025, Nestlé Waters and Coca-Cola European Partners entered into a joint venture to produce and distribute Nestlé's Vittel and S.Pellegrino brands in Europe, expanding their reach and market share in the premium bottled water segment (Reuters, 2025). This collaboration represents a major strategic move to strengthen their positions in the competitive market.
  • In July 2024, PepsiCo completed the acquisition of SodaStream, a leading home beverage system company, for approximately USD 3.2 billion (Bloomberg, 2024). This acquisition marks a significant shift for PepsiCo, as it aims to expand its product offerings beyond traditional bottled beverages and tap into the growing demand for at-home hydration solutions.

Research Analyst Overview

In the dynamic hydration market, various innovations and trends are shaping consumer behavior. Hydration assessment and monitoring devices, such as hydration sensors and smart water bottles, are gaining popularity among health-conscious individuals and athletes. Hydration insights from these devices help users understand their hydration levels and adjust their hydration plans and schedules accordingly. Hydration supplements, including hydration gels and bars, offer convenient solutions for individuals with active lifestyles. Portable water filters ensure access to clean drinking water, aligning with hydration sustainability and ethics. Hydration regulations and safety standards continue to evolve, with certifications and analytics playing a crucial role in ensuring product quality and consumer trust.  Data analytics and consumer demographics continue to shape the value perception of sports drinks in the market.

Hydration marketing and branding strategies are increasingly focused on promoting the importance of proper hydration, as hydration trends shift towards more eco-friendly and convenient solutions. Water dispensers and hydration kits cater to businesses, while hydration apps and advertising help spread awareness and education on the importance of hydration. Hydration trends lean towards more personalized and technology-driven approaches, with hydration trackers and hydration schedules becoming essential tools for maintaining optimal hydration levels. Hydration innovations continue to emerge, with hydration marketing and advertising playing a significant role in driving consumer interest and adoption. From hydration pouches and hydration plans to hydration regulations and hydration safety, the market is constantly evolving to meet the changing needs of consumers.

Dive into Technavio's robust research methodology, blending expert interviews, extensive data synthesis, and validated models for unparalleled Hydration Products Market insights. See full methodology.

Market Scope

Report Coverage

Details

Page number

223

Base year

2024

Historic period

2019-2023

Forecast period

2025-2029

Growth momentum & CAGR

Accelerate at a CAGR of 10.1%

Market growth 2025-2029

USD 656.2 million

Market structure

Fragmented

YoY growth 2024-2025(%)

9.0

Key countries

US, Germany, Canada, China, UK, Italy, Japan, France, India, and South Korea

Competitive landscape

Leading Companies, Market Positioning of Companies, Competitive Strategies, and Industry Risks

Request Free Sample

What are the Key Data Covered in this Hydration Products Market Research and Growth Report?

  • CAGR of the Hydration Products industry during the forecast period
  • Detailed information on factors that will drive the growth and forecasting between 2025 and 2029
  • Precise estimation of the size of the market and its contribution of the industry in focus to the parent market
  • Accurate predictions about upcoming growth and trends and changes in consumer behaviour
  • Growth of the market across North America, Europe, APAC, South America, and Middle East and Africa
  • Thorough analysis of the market's competitive landscape and detailed information about companies
  • Comprehensive analysis of factors that will challenge the hydration products market growth of industry companies

We can help! Our analysts can customize this hydration products market research report to meet your requirements.

Get in touch

1 Executive Summary

  • 1.1 Market overview
    • Executive Summary - Chart on Market Overview
    • Executive Summary - Data Table on Market Overview
    • Executive Summary - Chart on Global Market Characteristics
    • Executive Summary - Chart on Market by Geography
    • Executive Summary - Chart on Market Segmentation by End-user
    • Executive Summary - Chart on Market Segmentation by Product
    • Executive Summary - Chart on Market Segmentation by Distribution Channel
    • Executive Summary - Chart on Incremental Growth
    • Executive Summary - Data Table on Incremental Growth
    • Executive Summary - Chart on Company Market Positioning

2 Technavio Analysis

  • 2.1 Analysis of price sensitivity, lifecycle, customer purchase basket, adoption rates, and purchase criteria
    • Analysis of price sensitivity, lifecycle, customer purchase basket, adoption rates, and purchase criteria
  • 2.2 Criticality of inputs and Factors of differentiation
    • Overview on criticality of inputs and factors of differentiation
  • 2.3 Factors of disruption
    • Overview on factors of disruption
  • 2.4 Impact of drivers and challenges
    • Impact of drivers and challenges in 2024 and 2029

3 Market Landscape

  • 3.1 Market ecosystem
    • Parent Market
    • Data Table on - Parent Market
  • 3.2 Market characteristics
    • Market characteristics analysis
  • 3.3 Value chain analysis
    • Value chain analysis

4 Market Sizing

  • 4.1 Market definition
    • Offerings of companies included in the market definition
  • 4.2 Market segment analysis
    • Market segments
  • 4.3 Market size 2024
    • 4.4 Market outlook: Forecast for 2024-2029
      • Chart on Global - Market size and forecast 2024-2029 ($ million)
      • Data Table on Global - Market size and forecast 2024-2029 ($ million)
      • Chart on Global Market: Year-over-year growth 2024-2029 (%)
      • Data Table on Global Market: Year-over-year growth 2024-2029 (%)

    5 Historic Market Size

    • 5.1 Global Hydration Products Market 2019 - 2023
      • Historic Market Size - Data Table on Global Hydration Products Market 2019 - 2023 ($ million)
    • 5.2 End-user segment analysis 2019 - 2023
      • Historic Market Size - End-user Segment 2019 - 2023 ($ million)
    • 5.3 Product segment analysis 2019 - 2023
      • Historic Market Size - Product Segment 2019 - 2023 ($ million)
    • 5.4 Distribution Channel segment analysis 2019 - 2023
      • Historic Market Size - Distribution Channel Segment 2019 - 2023 ($ million)
    • 5.5 Geography segment analysis 2019 - 2023
      • Historic Market Size - Geography Segment 2019 - 2023 ($ million)
    • 5.6 Country segment analysis 2019 - 2023
      • Historic Market Size - Country Segment 2019 - 2023 ($ million)

    6 Qualitative Analysis

    • 6.1 Impact of AI in the Global Hydration Product Market

      7 Five Forces Analysis

      • 7.1 Five forces summary
        • Five forces analysis - Comparison between 2024 and 2029
      • 7.2 Bargaining power of buyers
        • Bargaining power of buyers - Impact of key factors 2024 and 2029
      • 7.3 Bargaining power of suppliers
        • Bargaining power of suppliers - Impact of key factors in 2024 and 2029
      • 7.4 Threat of new entrants
        • Threat of new entrants - Impact of key factors in 2024 and 2029
      • 7.5 Threat of substitutes
        • Threat of substitutes - Impact of key factors in 2024 and 2029
      • 7.6 Threat of rivalry
        • Threat of rivalry - Impact of key factors in 2024 and 2029
      • 7.7 Market condition
        • Chart on Market condition - Five forces 2024 and 2029

      8 Market Segmentation by End-user

      • 8.1 Market segments
        • Chart on End-user - Market share 2024-2029 (%)
        • Data Table on End-user - Market share 2024-2029 (%)
      • 8.2 Comparison by End-user
        • Chart on Comparison by End-user
        • Data Table on Comparison by End-user
      • 8.3 Sports - Market size and forecast 2024-2029
        • Chart on Sports - Market size and forecast 2024-2029 ($ million)
        • Data Table on Sports - Market size and forecast 2024-2029 ($ million)
        • Chart on Sports - Year-over-year growth 2024-2029 (%)
        • Data Table on Sports - Year-over-year growth 2024-2029 (%)
      • 8.4 Military - Market size and forecast 2024-2029
        • Chart on Military - Market size and forecast 2024-2029 ($ million)
        • Data Table on Military - Market size and forecast 2024-2029 ($ million)
        • Chart on Military - Year-over-year growth 2024-2029 (%)
        • Data Table on Military - Year-over-year growth 2024-2029 (%)
      • 8.5 Others - Market size and forecast 2024-2029
        • Chart on Others - Market size and forecast 2024-2029 ($ million)
        • Data Table on Others - Market size and forecast 2024-2029 ($ million)
        • Chart on Others - Year-over-year growth 2024-2029 (%)
        • Data Table on Others - Year-over-year growth 2024-2029 (%)
      • 8.6 Market opportunity by End-user
        • Market opportunity by End-user ($ million)
        • Data Table on Market opportunity by End-user ($ million)

      9 Market Segmentation by Product

      • 9.1 Market segments
        • Chart on Product - Market share 2024-2029 (%)
        • Data Table on Product - Market share 2024-2029 (%)
      • 9.2 Comparison by Product
        • Chart on Comparison by Product
        • Data Table on Comparison by Product
      • 9.3 Hydration backpacks - Market size and forecast 2024-2029
        • Chart on Hydration backpacks - Market size and forecast 2024-2029 ($ million)
        • Data Table on Hydration backpacks - Market size and forecast 2024-2029 ($ million)
        • Chart on Hydration backpacks - Year-over-year growth 2024-2029 (%)
        • Data Table on Hydration backpacks - Year-over-year growth 2024-2029 (%)
      • 9.4 Water bottles - Market size and forecast 2024-2029
        • Chart on Water bottles - Market size and forecast 2024-2029 ($ million)
        • Data Table on Water bottles - Market size and forecast 2024-2029 ($ million)
        • Chart on Water bottles - Year-over-year growth 2024-2029 (%)
        • Data Table on Water bottles - Year-over-year growth 2024-2029 (%)
      • 9.5 Purification and filtration - Market size and forecast 2024-2029
        • Chart on Purification and filtration - Market size and forecast 2024-2029 ($ million)
        • Data Table on Purification and filtration - Market size and forecast 2024-2029 ($ million)
        • Chart on Purification and filtration - Year-over-year growth 2024-2029 (%)
        • Data Table on Purification and filtration - Year-over-year growth 2024-2029 (%)
      • 9.6 Accessories - Market size and forecast 2024-2029
        • Chart on Accessories - Market size and forecast 2024-2029 ($ million)
        • Data Table on Accessories - Market size and forecast 2024-2029 ($ million)
        • Chart on Accessories - Year-over-year growth 2024-2029 (%)
        • Data Table on Accessories - Year-over-year growth 2024-2029 (%)
      • 9.7 Others - Market size and forecast 2024-2029
        • Chart on Others - Market size and forecast 2024-2029 ($ million)
        • Data Table on Others - Market size and forecast 2024-2029 ($ million)
        • Chart on Others - Year-over-year growth 2024-2029 (%)
        • Data Table on Others - Year-over-year growth 2024-2029 (%)
      • 9.8 Market opportunity by Product
        • Market opportunity by Product ($ million)
        • Data Table on Market opportunity by Product ($ million)

      10 Market Segmentation by Distribution Channel

      • 10.1 Market segments
        • Chart on Distribution Channel - Market share 2024-2029 (%)
        • Data Table on Distribution Channel - Market share 2024-2029 (%)
      • 10.2 Comparison by Distribution Channel
        • Chart on Comparison by Distribution Channel
        • Data Table on Comparison by Distribution Channel
      • 10.3 Offline - Market size and forecast 2024-2029
        • Chart on Offline - Market size and forecast 2024-2029 ($ million)
        • Data Table on Offline - Market size and forecast 2024-2029 ($ million)
        • Chart on Offline - Year-over-year growth 2024-2029 (%)
        • Data Table on Offline - Year-over-year growth 2024-2029 (%)
      • 10.4 Online - Market size and forecast 2024-2029
        • Chart on Online - Market size and forecast 2024-2029 ($ million)
        • Data Table on Online - Market size and forecast 2024-2029 ($ million)
        • Chart on Online - Year-over-year growth 2024-2029 (%)
        • Data Table on Online - Year-over-year growth 2024-2029 (%)
      • 10.5 Market opportunity by Distribution Channel
        • Market opportunity by Distribution Channel ($ million)
        • Data Table on Market opportunity by Distribution Channel ($ million)

      11 Customer Landscape

      • 11.1 Customer landscape overview
        • Analysis of price sensitivity, lifecycle, customer purchase basket, adoption rates, and purchase criteria

      12 Geographic Landscape

      • 12.1 Geographic segmentation
        • Chart on Market share by geography 2024-2029 (%)
        • Data Table on Market share by geography 2024-2029 (%)
      • 12.2 Geographic comparison
        • Chart on Geographic comparison
        • Data Table on Geographic comparison
      • 12.3 North America - Market size and forecast 2024-2029
        • Chart on North America - Market size and forecast 2024-2029 ($ million)
        • Data Table on North America - Market size and forecast 2024-2029 ($ million)
        • Chart on North America - Year-over-year growth 2024-2029 (%)
        • Data Table on North America - Year-over-year growth 2024-2029 (%)
      • 12.4 Europe - Market size and forecast 2024-2029
        • Chart on Europe - Market size and forecast 2024-2029 ($ million)
        • Data Table on Europe - Market size and forecast 2024-2029 ($ million)
        • Chart on Europe - Year-over-year growth 2024-2029 (%)
        • Data Table on Europe - Year-over-year growth 2024-2029 (%)
      • 12.5 APAC - Market size and forecast 2024-2029
        • Chart on APAC - Market size and forecast 2024-2029 ($ million)
        • Data Table on APAC - Market size and forecast 2024-2029 ($ million)
        • Chart on APAC - Year-over-year growth 2024-2029 (%)
        • Data Table on APAC - Year-over-year growth 2024-2029 (%)
      • 12.6 South America - Market size and forecast 2024-2029
        • Chart on South America - Market size and forecast 2024-2029 ($ million)
        • Data Table on South America - Market size and forecast 2024-2029 ($ million)
        • Chart on South America - Year-over-year growth 2024-2029 (%)
        • Data Table on South America - Year-over-year growth 2024-2029 (%)
      • 12.7 Middle East and Africa - Market size and forecast 2024-2029
        • Chart on Middle East and Africa - Market size and forecast 2024-2029 ($ million)
        • Data Table on Middle East and Africa - Market size and forecast 2024-2029 ($ million)
        • Chart on Middle East and Africa - Year-over-year growth 2024-2029 (%)
        • Data Table on Middle East and Africa - Year-over-year growth 2024-2029 (%)
      • 12.8 US - Market size and forecast 2024-2029
        • Chart on US - Market size and forecast 2024-2029 ($ million)
        • Data Table on US - Market size and forecast 2024-2029 ($ million)
        • Chart on US - Year-over-year growth 2024-2029 (%)
        • Data Table on US - Year-over-year growth 2024-2029 (%)
      • 12.9 Germany - Market size and forecast 2024-2029
        • Chart on Germany - Market size and forecast 2024-2029 ($ million)
        • Data Table on Germany - Market size and forecast 2024-2029 ($ million)
        • Chart on Germany - Year-over-year growth 2024-2029 (%)
        • Data Table on Germany - Year-over-year growth 2024-2029 (%)
      • 12.10 China - Market size and forecast 2024-2029
        • Chart on China - Market size and forecast 2024-2029 ($ million)
        • Data Table on China - Market size and forecast 2024-2029 ($ million)
        • Chart on China - Year-over-year growth 2024-2029 (%)
        • Data Table on China - Year-over-year growth 2024-2029 (%)
      • 12.11 Canada - Market size and forecast 2024-2029
        • Chart on Canada - Market size and forecast 2024-2029 ($ million)
        • Data Table on Canada - Market size and forecast 2024-2029 ($ million)
        • Chart on Canada - Year-over-year growth 2024-2029 (%)
        • Data Table on Canada - Year-over-year growth 2024-2029 (%)
      • 12.12 UK - Market size and forecast 2024-2029
        • Chart on UK - Market size and forecast 2024-2029 ($ million)
        • Data Table on UK - Market size and forecast 2024-2029 ($ million)
        • Chart on UK - Year-over-year growth 2024-2029 (%)
        • Data Table on UK - Year-over-year growth 2024-2029 (%)
      • 12.13 France - Market size and forecast 2024-2029
        • Chart on France - Market size and forecast 2024-2029 ($ million)
        • Data Table on France - Market size and forecast 2024-2029 ($ million)
        • Chart on France - Year-over-year growth 2024-2029 (%)
        • Data Table on France - Year-over-year growth 2024-2029 (%)
      • 12.14 Italy - Market size and forecast 2024-2029
        • Chart on Italy - Market size and forecast 2024-2029 ($ million)
        • Data Table on Italy - Market size and forecast 2024-2029 ($ million)
        • Chart on Italy - Year-over-year growth 2024-2029 (%)
        • Data Table on Italy - Year-over-year growth 2024-2029 (%)
      • 12.15 Japan - Market size and forecast 2024-2029
        • Chart on Japan - Market size and forecast 2024-2029 ($ million)
        • Data Table on Japan - Market size and forecast 2024-2029 ($ million)
        • Chart on Japan - Year-over-year growth 2024-2029 (%)
        • Data Table on Japan - Year-over-year growth 2024-2029 (%)
      • 12.16 India - Market size and forecast 2024-2029
        • Chart on India - Market size and forecast 2024-2029 ($ million)
        • Data Table on India - Market size and forecast 2024-2029 ($ million)
        • Chart on India - Year-over-year growth 2024-2029 (%)
        • Data Table on India - Year-over-year growth 2024-2029 (%)
      • 12.17 South Korea - Market size and forecast 2024-2029
        • Chart on South Korea - Market size and forecast 2024-2029 ($ million)
        • Data Table on South Korea - Market size and forecast 2024-2029 ($ million)
        • Chart on South Korea - Year-over-year growth 2024-2029 (%)
        • Data Table on South Korea - Year-over-year growth 2024-2029 (%)
      • 12.18 Market opportunity by geography
        • Market opportunity by geography ($ million)
        • Data Tables on Market opportunity by geography ($ million)

      13 Drivers, Challenges, and Opportunity/Restraints

      • 13.1 Market drivers
        • 13.2 Market challenges
          • 13.3 Impact of drivers and challenges
            • Impact of drivers and challenges in 2024 and 2029
          • 13.4 Market opportunities/restraints

            14 Competitive Landscape

            • 14.1 Overview
              • 14.2 Competitive Landscape
                • Overview on criticality of inputs and factors of differentiation
              • 14.3 Landscape disruption
                • Overview on factors of disruption
              • 14.4 Industry risks
                • Impact of key risks on business

              15 Competitive Analysis

              • 15.1 Companies profiled
                • Companies covered
              • 15.2 Company ranking index
                • Company ranking index
              • 15.3 Market positioning of companies
                • Matrix on companies position and classification
              • 15.4 A. O. Smith Corp.
                • A. O. Smith Corp. - Overview
                • A. O. Smith Corp. - Business segments
                • A. O. Smith Corp. - Key news
                • A. O. Smith Corp. - Key offerings
                • A. O. Smith Corp. - Segment focus
                • SWOT
              • 15.5 ANTA Sports Products Ltd.
                • ANTA Sports Products Ltd. - Overview
                • ANTA Sports Products Ltd. - Business segments
                • ANTA Sports Products Ltd. - Key news
                • ANTA Sports Products Ltd. - Key offerings
                • ANTA Sports Products Ltd. - Segment focus
                • SWOT
              • 15.6 Aquamira
                • Aquamira - Overview
                • Aquamira - Product / Service
                • Aquamira - Key offerings
                • SWOT
              • 15.7 BRITA SE
                • BRITA SE - Overview
                • BRITA SE - Product / Service
                • BRITA SE - Key offerings
                • SWOT
              • 15.8 Cascade Designs Inc.
                • Cascade Designs Inc. - Overview
                • Cascade Designs Inc. - Product / Service
                • Cascade Designs Inc. - Key offerings
                • SWOT
              • 15.9 Dometic Group AB
                • Dometic Group AB - Overview
                • Dometic Group AB - Business segments
                • Dometic Group AB - Key news
                • Dometic Group AB - Key offerings
                • Dometic Group AB - Segment focus
                • SWOT
              • 15.10 Helen of Troy Ltd.
                • Helen of Troy Ltd. - Overview
                • Helen of Troy Ltd. - Business segments
                • Helen of Troy Ltd. - Key offerings
                • Helen of Troy Ltd. - Segment focus
                • SWOT
              • 15.11 HydraPak LLC
                • HydraPak LLC - Overview
                • HydraPak LLC - Product / Service
                • HydraPak LLC - Key offerings
                • SWOT
              • 15.12 Klean Kanteen
                • Klean Kanteen - Overview
                • Klean Kanteen - Product / Service
                • Klean Kanteen - Key offerings
                • SWOT
              • 15.13 Leatt Corp.
                • Leatt Corp. - Overview
                • Leatt Corp. - Business segments
                • Leatt Corp. - Key news
                • Leatt Corp. - Key offerings
                • Leatt Corp. - Segment focus
                • SWOT
              • 15.14 Lifetime Brands Inc.
                • Lifetime Brands Inc. - Overview
                • Lifetime Brands Inc. - Product / Service
                • Lifetime Brands Inc. - Key offerings
                • SWOT
              • 15.15 Newell Brands Inc.
                • Newell Brands Inc. - Overview
                • Newell Brands Inc. - Business segments
                • Newell Brands Inc. - Key offerings
                • Newell Brands Inc. - Segment focus
                • SWOT
              • 15.16 Safariland LLC
                • Safariland LLC - Overview
                • Safariland LLC - Product / Service
                • Safariland LLC - Key offerings
                • SWOT
              • 15.17 Vista Outdoor Inc.
                • Vista Outdoor Inc. - Overview
                • Vista Outdoor Inc. - Business segments
                • Vista Outdoor Inc. - Key offerings
                • Vista Outdoor Inc. - Segment focus
                • SWOT
              • 15.18 ZHE JIANG HAERS VACUUM CONTAINERS CO. LTD.
                • ZHE JIANG HAERS VACUUM CONTAINERS CO. LTD. - Overview
                • ZHE JIANG HAERS VACUUM CONTAINERS CO. LTD. - Product / Service
                • ZHE JIANG HAERS VACUUM CONTAINERS CO. LTD. - Key offerings
                • SWOT

              16 Appendix

              • 16.1 Scope of the report
                • 16.2 Inclusions and exclusions checklist
                  • Inclusions checklist
                  • Exclusions checklist
                • 16.3 Currency conversion rates for US$
                  • Currency conversion rates for US$
                • 16.4 Research methodology
                  • Research methodology
                • 16.5 Data procurement
                  • Information sources
                • 16.6 Data validation
                  • Data validation
                • 16.7 Validation techniques employed for market sizing
                  • Validation techniques employed for market sizing
                • 16.8 Data synthesis
                  • Data synthesis
                • 16.9 360 degree market analysis
                  • 360 degree market analysis
                • 16.10 List of abbreviations
                  • List of abbreviations

                Research Methodology

                Technavio presents a detailed picture of the market by way of study, synthesis, and summation of data from multiple sources. The analysts have presented the various facets of the market with a particular focus on identifying the key industry influencers. The data thus presented is comprehensive, reliable, and the result of extensive research, both primary and secondary.

                INFORMATION SOURCES

                Primary sources

                • Manufacturers and suppliers
                • Channel partners
                • Industry experts
                • Strategic decision makers

                Secondary sources

                • Industry journals and periodicals
                • Government data
                • Financial reports of key industry players
                • Historical data
                • Press releases

                DATA ANALYSIS

                Data Synthesis

                • Collation of data
                • Estimation of key figures
                • Analysis of derived insights

                Data Validation

                • Triangulation with data models
                • Reference against proprietary databases
                • Corroboration with industry experts

                REPORT WRITING

                Qualitative

                • Market drivers
                • Market challenges
                • Market trends
                • Five forces analysis

                Quantitative

                • Market size and forecast
                • Market segmentation
                • Geographical insights
                • Competitive landscape

                Interested in this report?

                Get your sample now to see our research methodology and insights!

                Download Now

                Frequently Asked Questions

                Hydration Products market growth will increase by $ 656.2 mn during 2025-2029 .

                The Hydration Products market is expected to grow at a CAGR of 10.1% during 2025-2029 .

                Hydration Products market is segmented by End-user( Sports, Military, Others, Accessories, Others) Product( Hydration backpacks, Water bottles, Purification and filtration, Accessories, Others) Distribution Channel( Offline, Online, APAC, MEA, South America)

                A. O. Smith Corp., ANTA Sports Products Ltd., Aquamira, BRITA SE, Cascade Designs Inc., Dometic Group AB, Ergodyne, Helen of Troy Ltd., HydraPak LLC, Klean Kanteen, Leatt Corp., Lifetime Brands Inc., Nestle SA, Newell Brands Inc., Safariland LLC, Samsonite International SA, TECHNICHE LLC, Thermos LLC, Vista Outdoor Inc., Zhejiang Haers Vacuum Containers Co. Ltd. are a few of the key vendors in the Hydration Products market.

                North America will register the highest growth rate of 37% among the other regions. Therefore, the Hydration Products market in North America is expected to garner significant business opportunities for the vendors during the forecast period.

                US, Germany, Canada, China, UK, Italy, Japan, France, India, South Korea

                • Increase in military expenditureThe rise in military expenditure is a significant driver for the hydration products market. As defense budgets expand is the driving factor this market.
                • there is a growing emphasis on enhancing soldier performance and endurance is the driving factor this market.
                • particularly in challenging environments such as deserts is the driving factor this market.
                • jungles is the driving factor this market.
                • and arctic regions. Hydration plays a crucial role in maintaining energy levels is the driving factor this market.
                • cognitive function is the driving factor this market.
                • and physical performance is the driving factor this market.
                • which are essential for military personnel engaged in high-intensity tasks.Increased military spending enables the development and procurement of advanced hydration systems is the driving factor this market.
                • including portable water filtration devices and electrolyte-enhanced hydration solutions. These innovations ensure that soldiers can maintain optimal hydration levels during extended missions is the driving factor this market.
                • thereby improving operational efficiency and reducing the risk of dehydration-related health issues. For instance is the driving factor this market.
                • in 2024 is the driving factor this market.
                • the United States leads global military spending with a budget of approximately $842 billion is the driving factor this market.
                • reflecting its continued commitment to maintaining a robust defense infrastructure. China follows with a significant increase in its defense budget is the driving factor this market.
                • reaching $246 billion is the driving factor this market.
                • a 7.2% rise from the previous year. The European Union collectively allocates around $356 billion to defense is the driving factor this market.
                • representing 1.9% of its GDP. Russia military expenditure sees a notable surge to $149 billion is the driving factor this market.
                • marking a 38% increase from 2023. India dedicates $74.4 billion to its defense needs is the driving factor this market.
                • while Germany and the United Kingdom allocate $86 billion and $81.1 billion is the driving factor this market.
                • respectively. Japan defense budget stands at $53 billion is the driving factor this market.
                • and South Korea commits $43.9 billion to its military spending. These figures underscore the substantial investments nations are making in their military capabilities amidst evolving geopolitical dynamics and security challenges.Military personnel uses hydration packs to keep them hydrated during combat. The increase in spending on military expenses is the driving factor this market.
                • such as operating costs is the driving factor this market.
                • includes the armor and protective equipment used by the military forces. The global increase in spending will drive the market for hydration packs in the form of reservoirs by the military forces during the forecast period. is the driving factor this market.

                The Hydration Products market vendors should focus on grabbing business opportunities from the Sports segment as it accounted for the largest market share in the base year.