Hazardous Location Connectors Market Analysis North America, Europe, APAC, Middle East and Africa, South America - US, China, Germany, UK, Canada - Size and Forecast 2024-2028

Hazardous Location Connectors Market Analysis North America, Europe, APAC, Middle East and Africa, South America - US, China, Germany, UK, Canada - Size and Forecast 2024-2028

Published: Jul 2024 143 Pages SKU: IRTNTR74089

Market Overview at a Glance

$1.99 B
Market Opportunity
4.5%
CAGR
4.23
YoY growth 2023-2024(%)

Hazardous Location Connectors Market Size 2024-2028

The hazardous location connectors market size is forecast to increase by USD 1.99 billion at a CAGR of 4.5% between 2023 and 2028.

  • The market is witnessing significant growth due to the rising industrial safety measures and increasing global energy demand. The need to ensure safety in hazardous environments, such as oil and gas refineries and chemical plants, is driving the market. Additionally, the lack of skilled human resources for the installation and maintenance of these connectors is leading to an increase in demand for reliable and easy-to-install solutions. Furthermore, advancements in technology are enabling the development of connectors that can withstand extreme temperatures, pressures, and hazardous conditions, making them essential for various industries. Political instability in certain regions can impact production and supply chains, while social trends, such as the increasing demand for renewable energy and the shift towards automation, can create new opportunities for the market. These trends are expected to continue, making the market a promising investment opportunity for manufacturers and suppliers.

What will be the Size of the Hazardous Location Connectors Market During the Forecast Period?

Hazardous Location Connectors Market Size

 Request Free Sample

  • The market encompasses fiber optic connectors specifically designed for use in Class I, Division 1 and 2 locations, where the presence of flammable gases, vapors, or combustible dusts may pose a safety risk. This market caters to various industries, including the oil sector, wastewater treatment facilities, and refineries. Crude oil production and processing, as well as natural gas extraction and distribution, are significant end-users. Key product offerings include compact barrier glands, inorganic connectors, and connectors. The market's growth is driven by increasing demand for reliable communication networks in hazardous environments, stringent safety regulations, and the expanding presence of emerging players in the submarkets.
  • Consumer behavior and the economic landscape also influence market dynamics. Overall, the market is expected to continue its steady growth, providing essential solutions for industries dealing with hazardous conditions.

How is this Hazardous Location Connectors Industry segmented and which is the largest segment?

The hazardous location connectors industry research report provides comprehensive data (region-wise segment analysis), with forecasts and estimates in "USD million" for the period 2024-2028, as well as historical data from 2018-2022 for the following segments.

  • End-user
    • Oil and gas
    • Food and beverage
    • Pharmaceutical
    • Wastewater treatment
    • Others
  • Geography
    • North America
      • Canada
      • US
    • Europe
      • Germany
      • UK
    • APAC
      • China
    • Middle East and Africa
    • South America

By End-user Insights

  • The oil and gas segment is estimated to witness significant growth during the forecast period.

The market is primarily driven by the oil and gas sector, which is expected to experience significant growth due to increasing global energy demand, particularly in developing countries.  In the oil and gas industry, refineries and petrochemical plants contain potentially explosive gases and chemicals, making safety a top priority. Fiber optic connectors, which are essential for communication and automation systems in hazardous locations, are crucial for ensuring safety measures in Class I, Division 1 and 2 locations.

The market's breadth and scalability make it an attractive investment opportunity, despite challenges such as economic and political instability and social concerns. Recent initiatives, including mergers and acquisitions, are expanding the market's product offerings and enhancing its features, including the use of inorganic materials for improved durability.

Hazardous Location Connectors Market Size

Get a glance at the market report of share of various segments Request Free Sample

The Oil and gas segment was valued at USD 2.3 billion in 2018 and showed a gradual increase during the forecast period.

Regional Analysis

  • North America is estimated to contribute 32% to the growth of the global market during the forecast period.

Technavio's analysts have elaborately explained the regional trends and drivers that shape the market during the forecast period.

Hazardous Location Connectors Market Share by Geography

For more insights on the market size of various regions, Request Free Sample

The North American market is projected to lead the market due to the region's significant oil and gas production. The US, Canada, and Mexico are major contributors, with increased unconventional E&P activities driving growth. Government regulations mandating the use of explosion-proof connectors in various industries further boost demand. In the market, ease of installation and maintenance are crucial factors. Fiber optic connectors, a key subsegment, ensure safety in Class I, Location (explosive) areas. The oil sector, including oil refineries and petrochemical refineries, and wastewater treatment facilities are significant end-users. The food & beverage processing and oil & gas production industries also utilize hazardous location connectors.

Product features, scalability, and safety measures are essential considerations for consumers. The economic, political, and social landscapes impact market growth, while impediments include high costs and complex regulations. Investment avenues include research and development, mergers and acquisitions, and partnerships. Recent initiatives focus on inorganic growth strategies and the use of advanced materials, such as inorganic connectors.

Market Dynamics

Our researchers analyzed the data with 2023 as the base year, along with the key drivers, trends, and challenges. A holistic analysis of drivers will help companies refine their marketing strategies to gain a competitive advantage.

What are the key market drivers leading to the rise in the adoption of Hazardous Location Connectors Industry?

Rising industrial safety measures is the key driver of the market.

  • In the industrial sector, hazardous locations necessitate specialized safety measures to mitigate potential risks. One essential component of industrial safety in such environments is the use of fiber optic connectors in Class I locations, which are areas where explosive gases are present in the air. These locations are prevalent in the oil sector, including oil refineries, petrochemical refineries, and wastewater treatment facilities. The fiber optic connector market caters to these subsectors, offering inorganic solutions that ensure safety and reliability. Product features, such as scalability, are crucial considerations for companies in the Oil & Gas Production and Food & Beverage Processing industries.
  • The economic, political, and social landscapes influence the market. Economic factors, such as the price of crude oil and regulatory compliance costs, impact demand. Political instability and geopolitical risks can disrupt supply chains, while social trends, such as increasing environmental awareness, may drive demand for safer and more sustainable industrial solutions. Despite the market's growth potential, impediments, such as high initial investment costs and the need for specialized expertise, may deter some companies from entering the market.

What are the market trends shaping the Hazardous Location Connectors Industry?

Rising global energy demand is the upcoming market trend.

  • The market is witnessing significant growth due to the increasing energy demand in various sectors, including the Oil sector, Wastewater treatment facilities, Food & Beverage Processing, Oil & Gas Production, and Oil Refineries. Inorganic growth in the form of mergers and acquisitions is a key trend in this market. The market's breadth can be attributed to the need for safety measures in Class I locations, where the potential for explosive atmospheres exists. Product features such as scalability and high-performance make fiber optic connectors a preferred choice in these environments. The economic, political, and social landscapes are driving the market's growth, with the oil sector being a major contributor.
  • Impediments include the high initial investment and complex installation processes. However, investment avenues exist in the form of recent initiatives to improve safety and efficiency in hazardous locations. Key players are focusing on product innovation to meet the evolving demands of the market. The beverage industry is also expected to emerge as a new submarket due to the increasing industry automation and digitization in production processes.

What challenges does the Hazardous Location Connectors Industry face during its growth?

Lack of skilled human resources is a key challenge affecting the industry growth.

  • The market caters to various industries requiring safety measures in Class I locations, including the oil sector, wastewater treatment facilities, food & beverage processing, oil & gas production, and oil refineries. These connectors, which come in various sizes and types with contact configurations ranging from 2 to 79, are essential for RF, fiber optic, and coaxial applications in manufacturing and production sites. However, the market faces challenges due to the scarcity of skilled labor for installing, servicing, and calibrating these connectors properly. End-users' dissatisfaction arises when connectors are not installed correctly, leading to inefficiencies and potential safety hazards.
  • Despite these challenges, the market offers significant investment avenues through its broad product features, scalability, and submarkets. Inorganic growth strategies, such as mergers and acquisitions, are common in this industry. Companies contribute to the market's development by providing innovative solutions to meet the evolving needs of their customers.

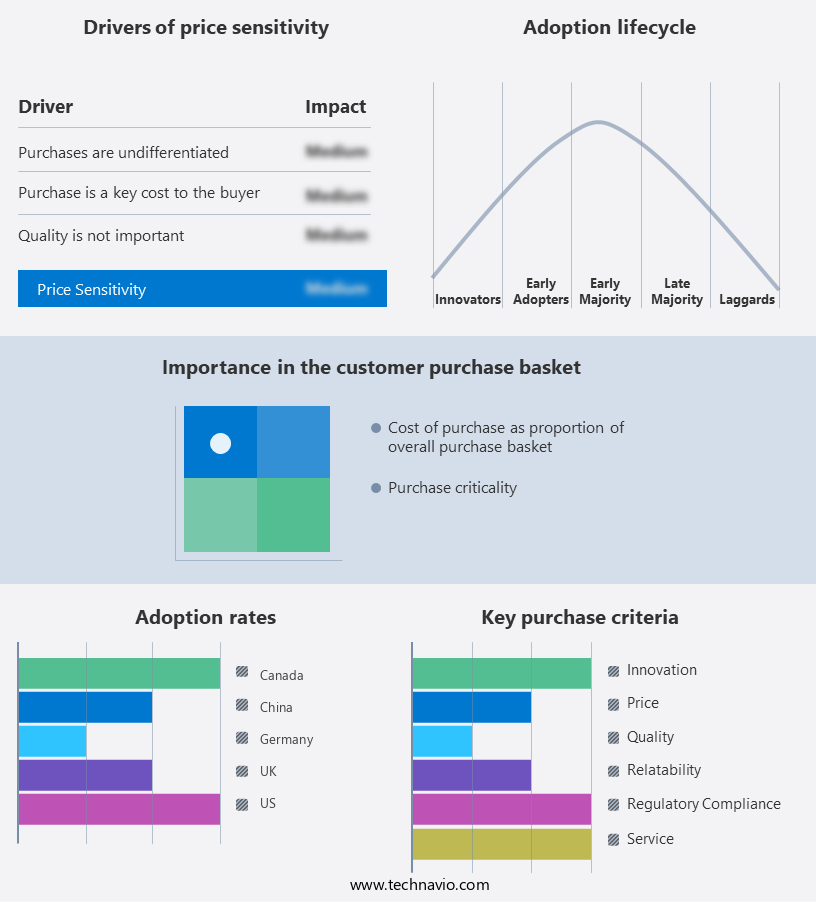
Exclusive Customer Landscape

The market forecasting report includes the adoption lifecycle of the market, covering from the innovator's stage to the laggard's stage. It focuses on adoption rates in different regions based on penetration. Furthermore, the market report also includes key purchase criteria and drivers of price sensitivity to help companies evaluate and develop their market growth analysis strategies.

Hazardous Location Connectors Market Share by Geography

 Customer Landscape

Key Companies & Market Insights

Companies are implementing various strategies, such as strategic alliances, market forecast, partnerships, mergers and acquisitions, geographical expansion, and product/service launches, to enhance their presence in the industry.

The industry research and growth report includes detailed analyses of the competitive landscape of the market and information about key companies, including:

  • ABB Ltd.
  • American Connectors
  • Amphenol Industrial Products Group
  • Atkore Inc
  • Bulgin Ltd.
  • Eaton Corp. Plc
  • Elcom International Pvt. Ltd.
  • Emerson Electric Co.
  • Freudenberg and Co. KG
  • HARTING Technology Group
  • Hubbell Inc.
  • ITT BIW Connector Systems
  • Pepperl and Fuchs SE
  • R Stahl AG
  • Sonepar Group
  • Steck Connections
  • TURCK India Automation Pvt. Ltd.
  • WAGO GmbH and Co. KG
  • Warom Technology Inc.

Qualitative and quantitative analysis of companies has been conducted to help clients understand the wider business environment as well as the strengths and weaknesses of key industry players. Data is qualitatively analyzed to categorize companies as pure play, category-focused, industry-focused, and diversified; it is quantitatively analyzed to categorize companies as dominant, leading, strong, tentative, and weak.

Research Analyst Overview

The market caters to industries with unique safety requirements, primarily in sectors such as oil and gas production, refineries, petrochemical refineries, and wastewater treatment facilities. These industries necessitate the use of Class I location connectors due to the presence of flammable gases or vapors, combustible dust, or other hazardous conditions. Fiber optic connectors play a crucial role in ensuring reliable and efficient communication and data transfer in hazardous environments. The market is driven by several factors, including the increasing demand for automation, remote monitoring, artificial intelligence (AI), and predictive analytics in hazardous locations, the need for high-speed data transmission, and the growing adoption of fiber optic technology in various industries.

Safety measures are a top priority in the market. These connectors are designed to meet stringent safety standards and regulations, such as those set by the International Electrotechnical Commission (IEC) and the National Electrical Manufacturers Association (NEMA). They are typically made of inorganic materials to prevent the risk of ignition and are tested under various conditions to ensure their safety and durability. The oil sector is a significant contributor to the hazardous location connector market. Crude oil production and refining processes involve the handling of flammable liquids and gases, making safety a top priority. Fiber optic connectors are used extensively in oil rigs, pipelines, and refineries to ensure reliable communication and data transfer, even in the most challenging environments.

Another submarket for hazardous location connectors is the food and beverage processing industry. While not as hazardous as the oil and gas sector, food and beverage processing facilities still require the use of Class I, Division 2 connectors due to the presence of combustible dust. These connectors are essential for automating processes and ensuring efficient communication between various systems in the facility. The economic, political, and social landscapes also impact the hazardous location connector market. Economic factors, such as the cost of raw materials and the price of oil, can influence the demand for these connectors.

Market Scope

Report Coverage

Details

Page number

143

Base year

2023

Historic period

2018-2022

Forecast period

2024-2028

Growth momentum & CAGR

Accelerate at a CAGR of 4.5%

Market growth 2024-2028

USD 1.99 billion

Market structure

Fragmented

YoY growth 2023-2024(%)

4.23

Key countries

US, China, Germany, UK, and Canada

Competitive landscape

Leading Companies, Market Positioning of Companies, Competitive Strategies, and Industry Risks

Request Free Sample

What are the Key Data Covered in this Hazardous Location Connectors Market Research and Growth Report?

  • CAGR of the Hazardous Location Connectors industry during the forecast period
  • Detailed information on factors that will drive the market growth and forecasting between 2024 and 2028
  • Precise estimation of the size of the market and its contribution of the industry in focus to the parent market
  • Accurate predictions about upcoming growth and trends and changes in consumer behaviour
  • Growth of the market across North America, Europe, APAC, Middle East and Africa, and South America
  • Thorough analysis of the market's competitive landscape and detailed information about companies
  • Comprehensive analysis of factors that will challenge the hazardous location connectors market growth of industry companies

We can help! Our analysts can customize this hazardous location connectors market research report to meet your requirements.

Get in touch

1 Executive Summary

  • 1.1 Market overview
    • Executive Summary - Chart on Market Overview
    • Executive Summary - Data Table on Market Overview
    • Executive Summary - Chart on Global Market Characteristics
    • Executive Summary - Chart on Market by Geography
    • Executive Summary - Chart on Market Segmentation by End-user
    • Executive Summary - Chart on Incremental Growth
    • Executive Summary - Data Table on Incremental Growth
    • Executive Summary - Chart on Company Market Positioning

2 Market Landscape

  • 2.1 Market ecosystem
    • Parent Market
    • Data Table on - Parent Market
  • 2.2 Market characteristics
    • Market characteristics analysis
  • 2.3 Value chain analysis
    • Value Chain Analysis

3 Market Sizing

  • 3.1 Market definition
    • Offerings of companies included in the market definition
  • 3.2 Market segment analysis
    • Market segments
  • 3.3 Market size 2023
    • 3.4 Market outlook: Forecast for 2023-2028
      • Chart on Global - Market size and forecast 2023-2028 ($ million)
      • Data Table on Global - Market size and forecast 2023-2028 ($ million)
      • Chart on Global Market: Year-over-year growth 2023-2028 (%)
      • Data Table on Global Market: Year-over-year growth 2023-2028 (%)

    4 Historic Market Size

    • 4.1 Global Hazardous Location Connectors Market 2018 - 2022
      • Historic Market Size - Data Table on Global Hazardous Location Connectors Market 2018 - 2022 ($ million)
    • 4.2 End-user segment analysis 2018 - 2022
      • Historic Market Size - End-user Segment 2018 - 2022 ($ million)
    • 4.3 Geography segment analysis 2018 - 2022
      • Historic Market Size - Geography Segment 2018 - 2022 ($ million)
    • 4.4 Country segment analysis 2018 - 2022
      • Historic Market Size - Country Segment 2018 - 2022 ($ million)

    5 Five Forces Analysis

    • 5.1 Five forces summary
      • Five forces analysis - Comparison between 2023 and 2028
    • 5.2 Bargaining power of buyers
      • Bargaining power of buyers - Impact of key factors 2023 and 2028
    • 5.3 Bargaining power of suppliers
      • Bargaining power of suppliers - Impact of key factors in 2023 and 2028
    • 5.4 Threat of new entrants
      • Threat of new entrants - Impact of key factors in 2023 and 2028
    • 5.5 Threat of substitutes
      • Threat of substitutes - Impact of key factors in 2023 and 2028
    • 5.6 Threat of rivalry
      • Threat of rivalry - Impact of key factors in 2023 and 2028
    • 5.7 Market condition
      • Chart on Market condition - Five forces 2023 and 2028

    6 Market Segmentation by End-user

    • 6.1 Market segments
      • Chart on End-user - Market share 2023-2028 (%)
      • Data Table on End-user - Market share 2023-2028 (%)
    • 6.2 Comparison by End-user
      • Chart on Comparison by End-user
      • Data Table on Comparison by End-user
    • 6.3 Oil and gas - Market size and forecast 2023-2028
      • Chart on Oil and gas - Market size and forecast 2023-2028 ($ million)
      • Data Table on Oil and gas - Market size and forecast 2023-2028 ($ million)
      • Chart on Oil and gas - Year-over-year growth 2023-2028 (%)
      • Data Table on Oil and gas - Year-over-year growth 2023-2028 (%)
    • 6.4 Food and beverage - Market size and forecast 2023-2028
      • Chart on Food and beverage - Market size and forecast 2023-2028 ($ million)
      • Data Table on Food and beverage - Market size and forecast 2023-2028 ($ million)
      • Chart on Food and beverage - Year-over-year growth 2023-2028 (%)
      • Data Table on Food and beverage - Year-over-year growth 2023-2028 (%)
    • 6.5 Pharmaceutical - Market size and forecast 2023-2028
      • Chart on Pharmaceutical - Market size and forecast 2023-2028 ($ million)
      • Data Table on Pharmaceutical - Market size and forecast 2023-2028 ($ million)
      • Chart on Pharmaceutical - Year-over-year growth 2023-2028 (%)
      • Data Table on Pharmaceutical - Year-over-year growth 2023-2028 (%)
    • 6.6 Wastewater treatment - Market size and forecast 2023-2028
      • Chart on Wastewater treatment - Market size and forecast 2023-2028 ($ million)
      • Data Table on Wastewater treatment - Market size and forecast 2023-2028 ($ million)
      • Chart on Wastewater treatment - Year-over-year growth 2023-2028 (%)
      • Data Table on Wastewater treatment - Year-over-year growth 2023-2028 (%)
    • 6.7 Others - Market size and forecast 2023-2028
      • Chart on Others - Market size and forecast 2023-2028 ($ million)
      • Data Table on Others - Market size and forecast 2023-2028 ($ million)
      • Chart on Others - Year-over-year growth 2023-2028 (%)
      • Data Table on Others - Year-over-year growth 2023-2028 (%)
    • 6.8 Market opportunity by End-user
      • Market opportunity by End-user ($ million)
      • Data Table on Market opportunity by End-user ($ million)

    7 Customer Landscape

    • 7.1 Customer landscape overview
      • Analysis of price sensitivity, lifecycle, customer purchase basket, adoption rates, and purchase criteria

    8 Geographic Landscape

    • 8.1 Geographic segmentation
      • Chart on Market share by geography 2023-2028 (%)
      • Data Table on Market share by geography 2023-2028 (%)
    • 8.2 Geographic comparison
      • Chart on Geographic comparison
      • Data Table on Geographic comparison
    • 8.3 North America - Market size and forecast 2023-2028
      • Chart on North America - Market size and forecast 2023-2028 ($ million)
      • Data Table on North America - Market size and forecast 2023-2028 ($ million)
      • Chart on North America - Year-over-year growth 2023-2028 (%)
      • Data Table on North America - Year-over-year growth 2023-2028 (%)
    • 8.4 Europe - Market size and forecast 2023-2028
      • Chart on Europe - Market size and forecast 2023-2028 ($ million)
      • Data Table on Europe - Market size and forecast 2023-2028 ($ million)
      • Chart on Europe - Year-over-year growth 2023-2028 (%)
      • Data Table on Europe - Year-over-year growth 2023-2028 (%)
    • 8.5 APAC - Market size and forecast 2023-2028
      • Chart on APAC - Market size and forecast 2023-2028 ($ million)
      • Data Table on APAC - Market size and forecast 2023-2028 ($ million)
      • Chart on APAC - Year-over-year growth 2023-2028 (%)
      • Data Table on APAC - Year-over-year growth 2023-2028 (%)
    • 8.6 Middle East and Africa - Market size and forecast 2023-2028
      • Chart on Middle East and Africa - Market size and forecast 2023-2028 ($ million)
      • Data Table on Middle East and Africa - Market size and forecast 2023-2028 ($ million)
      • Chart on Middle East and Africa - Year-over-year growth 2023-2028 (%)
      • Data Table on Middle East and Africa - Year-over-year growth 2023-2028 (%)
    • 8.7 South America - Market size and forecast 2023-2028
      • Chart on South America - Market size and forecast 2023-2028 ($ million)
      • Data Table on South America - Market size and forecast 2023-2028 ($ million)
      • Chart on South America - Year-over-year growth 2023-2028 (%)
      • Data Table on South America - Year-over-year growth 2023-2028 (%)
    • 8.8 US - Market size and forecast 2023-2028
      • Chart on US - Market size and forecast 2023-2028 ($ million)
      • Data Table on US - Market size and forecast 2023-2028 ($ million)
      • Chart on US - Year-over-year growth 2023-2028 (%)
      • Data Table on US - Year-over-year growth 2023-2028 (%)
    • 8.9 China - Market size and forecast 2023-2028
      • Chart on China - Market size and forecast 2023-2028 ($ million)
      • Data Table on China - Market size and forecast 2023-2028 ($ million)
      • Chart on China - Year-over-year growth 2023-2028 (%)
      • Data Table on China - Year-over-year growth 2023-2028 (%)
    • 8.10 Germany - Market size and forecast 2023-2028
      • Chart on Germany - Market size and forecast 2023-2028 ($ million)
      • Data Table on Germany - Market size and forecast 2023-2028 ($ million)
      • Chart on Germany - Year-over-year growth 2023-2028 (%)
      • Data Table on Germany - Year-over-year growth 2023-2028 (%)
    • 8.11 UK - Market size and forecast 2023-2028
      • Chart on UK - Market size and forecast 2023-2028 ($ million)
      • Data Table on UK - Market size and forecast 2023-2028 ($ million)
      • Chart on UK - Year-over-year growth 2023-2028 (%)
      • Data Table on UK - Year-over-year growth 2023-2028 (%)
    • 8.12 Canada - Market size and forecast 2023-2028
      • Chart on Canada - Market size and forecast 2023-2028 ($ million)
      • Data Table on Canada - Market size and forecast 2023-2028 ($ million)
      • Chart on Canada - Year-over-year growth 2023-2028 (%)
      • Data Table on Canada - Year-over-year growth 2023-2028 (%)
    • 8.13 Market opportunity by geography
      • Market opportunity by geography ($ million)
      • Data Tables on Market opportunity by geography ($ million)

    9 Drivers, Challenges, and Opportunity/Restraints

    • 9.1 Market drivers
      • 9.2 Market challenges
        • 9.3 Impact of drivers and challenges
          • Impact of drivers and challenges in 2023 and 2028
        • 9.4 Market opportunities/restraints

          10 Competitive Landscape

          • 10.1 Overview
            • 10.2 Competitive Landscape
              • Overview on criticality of inputs and factors of differentiation
            • 10.3 Landscape disruption
              • Overview on factors of disruption
            • 10.4 Industry risks
              • Impact of key risks on business

            11 Competitive Analysis

            • 11.1 Companies profiled
              • Companies covered
            • 11.2 Market positioning of companies
              • Matrix on companies position and classification
            • 11.3 ABB Ltd.
              • ABB Ltd. - Overview
              • ABB Ltd. - Business segments
              • ABB Ltd. - Key news
              • ABB Ltd. - Key offerings
              • ABB Ltd. - Segment focus
            • 11.4 American Connectors
              • American Connectors - Overview
              • American Connectors - Product / Service
              • American Connectors - Key offerings
            • 11.5 Amphenol Industrial Products Group
              • Amphenol Industrial Products Group - Overview
              • Amphenol Industrial Products Group - Product / Service
              • Amphenol Industrial Products Group - Key offerings
            • 11.6 Eaton Corp. Plc
              • Eaton Corp. Plc - Overview
              • Eaton Corp. Plc - Business segments
              • Eaton Corp. Plc - Key news
              • Eaton Corp. Plc - Key offerings
              • Eaton Corp. Plc - Segment focus
            • 11.7 Emerson Electric Co.
              • Emerson Electric Co. - Overview
              • Emerson Electric Co. - Business segments
              • Emerson Electric Co. - Key news
              • Emerson Electric Co. - Key offerings
              • Emerson Electric Co. - Segment focus
            • 11.8 Freudenberg and Co. KG
              • Freudenberg and Co. KG - Overview
              • Freudenberg and Co. KG - Product / Service
              • Freudenberg and Co. KG - Key news
              • Freudenberg and Co. KG - Key offerings
            • 11.9 Hubbell Inc.
              • Hubbell Inc. - Overview
              • Hubbell Inc. - Business segments
              • Hubbell Inc. - Key news
              • Hubbell Inc. - Key offerings
              • Hubbell Inc. - Segment focus
            • 11.10 ITT BIW Connector Systems
              • ITT BIW Connector Systems - Overview
              • ITT BIW Connector Systems - Product / Service
              • ITT BIW Connector Systems - Key offerings
            • 11.11 Sonepar Group
              • Sonepar Group - Overview
              • Sonepar Group - Product / Service
              • Sonepar Group - Key offerings
            • 11.12 Steck Connections
              • Steck Connections - Overview
              • Steck Connections - Product / Service
              • Steck Connections - Key offerings

            12 Appendix

            • 12.1 Scope of the report
              • 12.2 Inclusions and exclusions checklist
                • Inclusions checklist
                • Exclusions checklist
              • 12.3 Currency conversion rates for US$
                • Currency conversion rates for US$
              • 12.4 Research methodology
                • Research methodology
              • 12.5 Data procurement
                • Information sources
              • 12.6 Data validation
                • Data validation
              • 12.7 Validation techniques employed for market sizing
                • Validation techniques employed for market sizing
              • 12.8 Data synthesis
                • Data synthesis
              • 360 degree market analysis
                • 360 degree market analysis
              • 12.10 List of abbreviations
                • List of abbreviations

              Research Methodology

              Technavio presents a detailed picture of the market by way of study, synthesis, and summation of data from multiple sources. The analysts have presented the various facets of the market with a particular focus on identifying the key industry influencers. The data thus presented is comprehensive, reliable, and the result of extensive research, both primary and secondary.

              INFORMATION SOURCES

              Primary sources

              • Manufacturers and suppliers
              • Channel partners
              • Industry experts
              • Strategic decision makers

              Secondary sources

              • Industry journals and periodicals
              • Government data
              • Financial reports of key industry players
              • Historical data
              • Press releases

              DATA ANALYSIS

              Data Synthesis

              • Collation of data
              • Estimation of key figures
              • Analysis of derived insights

              Data Validation

              • Triangulation with data models
              • Reference against proprietary databases
              • Corroboration with industry experts

              REPORT WRITING

              Qualitative

              • Market drivers
              • Market challenges
              • Market trends
              • Five forces analysis

              Quantitative

              • Market size and forecast
              • Market segmentation
              • Geographical insights
              • Competitive landscape

              Interested in this report?

              Get your sample now to see our research methodology and insights!

              Download Now

              Frequently Asked Questions

              Hazardous Location Connectors market growth will increase by $ 1987.4 mn during 2024-2028 .

              The Hazardous Location Connectors market is expected to grow at a CAGR of 4.5% during 2024-2028 .

              Hazardous Location Connectors market is segmented by End-user( Oil and gas, Food and beverage, Pharmaceutical, Wastewater treatment, Others)

              ABB Ltd., American Connectors, Amphenol Industrial Products Group, Atkore Inc, Bulgin Ltd., Eaton Corp. Plc, Elcom International Pvt. Ltd., Emerson Electric Co., Freudenberg and Co. KG, HARTING Technology Group, Hubbell Inc., ITT BIW Connector Systems, Pepperl and Fuchs SE, R Stahl AG, Sonepar Group, Steck Connections, TURCK India Automation Pvt. Ltd., WAGO GmbH and Co. KG, Warom Technology Inc. are a few of the key vendors in the Hazardous Location Connectors market.

              North America will register the highest growth rate of 32% among the other regions. Therefore, the Hazardous Location Connectors market in North America is expected to garner significant business opportunities for the vendors during the forecast period.

              US, China, Germany, UK, Canada

              • Rising industrial safety measuresIndustrial safety refers to safety management practices that apply to the industrial sector. These processes are aimed at protecting industrial workers is the driving factor this market.
              • machinery is the driving factor this market.
              • plants is the driving factor this market.
              • structures is the driving factor this market.
              • and the environment. Industrial safety is monitored by federal is the driving factor this market.
              • state is the driving factor this market.
              • and local laws and regulations. The Occupational Safety and Health Association (OSHA) is the leading US regulatory body specializing in workplace safety is the driving factor this market.
              • especially in the industrial sector. While all workplaces and jobs carry some safety risks is the driving factor this market.
              • industrial risks are high risk and can cause serious injury is the driving factor this market.
              • widespread property damage is the driving factor this market.
              • or catastrophic environmental damage. Violations can have a significant impact on a company's manufacturing performance is the driving factor this market.
              • shipping schedule is the driving factor this market.
              • performance is the driving factor this market.
              • supplier relationships is the driving factor this market.
              • and customer satisfaction. The number of fatalities in industrial sectors across the globe has increased in recent years. For instance is the driving factor this market.
              • in April 2021 is the driving factor this market.
              • an explosion and fire broke out at a polymer resin plant in a paint plant in Columbus is the driving factor this market.
              • US is the driving factor this market.
              • which killed one worker is the driving factor this market.
              • hospitalized five and injured four workers with minor injuries. Similarly is the driving factor this market.
              • in April 2022 is the driving factor this market.
              • six people were killed and 12 injured in a huge fire and reactor blast at a chemical factory in Andhra Pradesh's Eluru district. Such incidents increase the adoption of safety measures in different industries. For instance is the driving factor this market.
              • in the US industrial sectors is the driving factor this market.
              • employers must have to comply with all applicable OSHA standards. They must also comply with the general obligations of the Industrial Safety and Health Act. This clause requires employers to make their workplaces unaware of serious dangers. In the oil and gas industry is the driving factor this market.
              • due to the general obligation of occupational health and safety (the law that created OSHA) is the driving factor this market.
              • employers are not aware of any risks that could cause death or serious injury. Exposure to hazards present in the oil and gas well drilling is the driving factor this market.
              • servicing is the driving factor this market.
              • and storage industries are addressed in specific standards for the general industry. Similarly is the driving factor this market.
              • Health Safety and Environment (HSE) is the number one priority in the oil and gas sector to formulate is the driving factor this market.
              • address is the driving factor this market.
              • and contribute to the reasonable reduction of related accidents is the driving factor this market.
              • fatalities is the driving factor this market.
              • and losses (both time and property) to occupational health. Thus is the driving factor this market.
              • the implementation of such regulations is considered important by different industries in different nations. Every nation has introduced its industrial safety measures to reduce the number of fatalities. The tools and equipment used in manufacturing industries is the driving factor this market.
              • such as automobiles is the driving factor this market.
              • produce heat and flame is the driving factor this market.
              • thereby increasing the risk for fires is the driving factor this market.
              • especially in Class I locations in which hazardous location connectors play an important role in preventing these types of explosions. Thus is the driving factor this market.
              • the rising industrial safety measures will spur the demand for hazardous location connectors across the globe is the driving factor this market.
              • which is the driving factor this market.
              • in turn is the driving factor this market.
              • will propel the growth of the market during the forecast period. is the driving factor this market.

              The Hazardous Location Connectors market vendors should focus on grabbing business opportunities from the Oil and gas segment as it accounted for the largest market share in the base year.