
Radio Frequency Filters Market Analysis, Size, and Forecast 2026-2030: APAC (China, Japan, and South Korea), Europe (Germany, UK, and France), North America (US, Canada, and Mexico), Middle East and Africa (UAE, Saudi Arabia, and South Africa), South America (Brazil, Argentina, and Colombia), and Rest of World (ROW)

Radio Frequency Filters Market Analysis, Size, and Forecast 2026-2030:
APAC (China, Japan, and South Korea), Europe (Germany, UK, and France), North America (US, Canada, and Mexico), Middle East and Africa (UAE, Saudi Arabia, and South Africa), South America (Brazil, Argentina, and Colombia), and Rest of World (ROW)

Published: Oct 2026 296 Pages SKU: IRTNTR40877

Market Overview at a Glance

$20.53 B
Market Opportunity
17.8%
CAGR 2025 - 2030
45.9%
APAC Growth
$8.00 B
Cellular devices segment 2024

Radio Frequency Filters Market Size 2026-2030

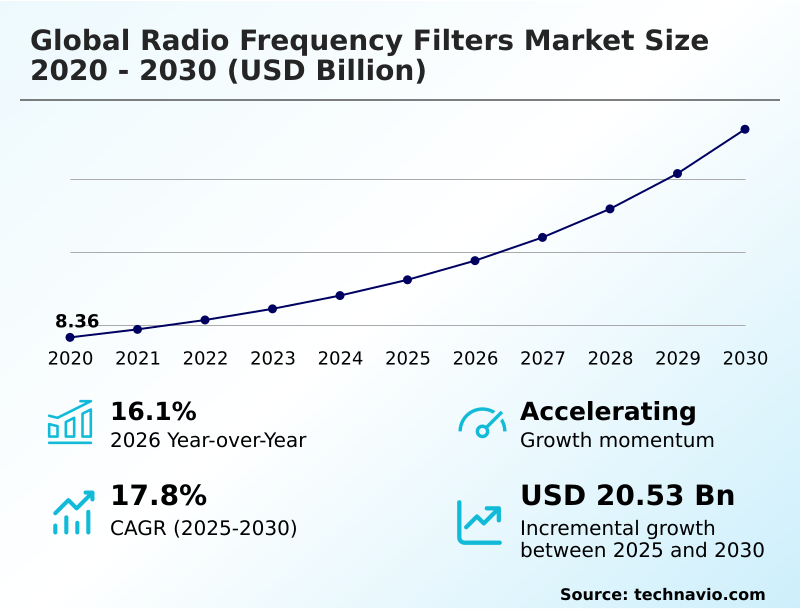
The radio frequency filters market size is valued to increase by USD 20.53 billion, at a CAGR of 17.8% from 2025 to 2030. Escalating global rollout and densification of fifth-generation telecommunications networks will drive the radio frequency filters market.

Major Market Trends & Insights

  • APAC dominated the market and accounted for a 45.9% growth during the forecast period.
  • By Application - Cellular devices segment was valued at USD 8.00 billion in 2024
  • By Technology - SAW segment accounted for the largest market revenue share in 2024

Market Size & Forecast

  • Market Opportunities: USD 28.38 billion
  • Market Future Opportunities: USD 20.53 billion
  • CAGR from 2025 to 2030 : 17.8%

Market Summary

  • The Radio Frequency Filters Market is undergoing rapid structural evolution driven by the integration of complex wireless communication standards. The escalating rollout and densification of 5G telecommunications networks serve as the primary catalyst for market expansion, forcing operators to adopt bulk acoustic wave components to prevent spectral overlapping. This shift directly improves spectral efficiency by 20% compared to legacy architectures.
  • In a real-world supply chain scenario, automated silicon substrate manufacturing processes allow semiconductor foundries to scale production of advanced piezoelectric substrate materials, reducing component lead times for global original equipment manufacturers. However, severe thermal dissipation challenges in millimeter-wave bands constrain deployment speeds, as high-frequency operations cause structural warping in standard filters, leading to elevated localized heat generation.
  • To counteract these thermal stress issues, manufacturers are exploring scandium-doped aluminum nitride to maintain acoustic energy confinement. Consequently, mastering out-of-band rejection and component miniaturization remains critical for maintaining competitive advantage and ensuring seamless connectivity across industrial applications.

What will be the Size of the Radio Frequency Filters Market during the forecast period?
Get Key Insights on Market Forecast (PDF) Get Free Sample

How is the Radio Frequency Filters Market Segmented?

The radio frequency filters industry research report provides comprehensive data (region-wise segment analysis), with forecasts and estimates in "USD million" for the period 2026-2030, as well as historical data from 2020-2024 for the following segments.

  • Application
    • Cellular devices
    • GPS devices
    • Tablets
    • Others
  • Technology
    • SAW
    • BAW
  • Frequency range
    • Sub-1 GHz
    • Less than 1-6 GHz
    • Above 6 GHz
  • Geography
    • APAC
      • China
      • Japan
      • South Korea
      • Taiwan
      • India
      • Singapore
    • Europe
      • Germany
      • UK
      • France
      • Italy
      • The Netherlands
      • Sweden
    • North America
      • US
      • Canada
      • Mexico
    • Middle East and Africa
      • UAE
      • Saudi Arabia
      • South Africa
      • Israel
      • Turkey
    • South America
      • Brazil
      • Argentina
      • Colombia

By Application Insights

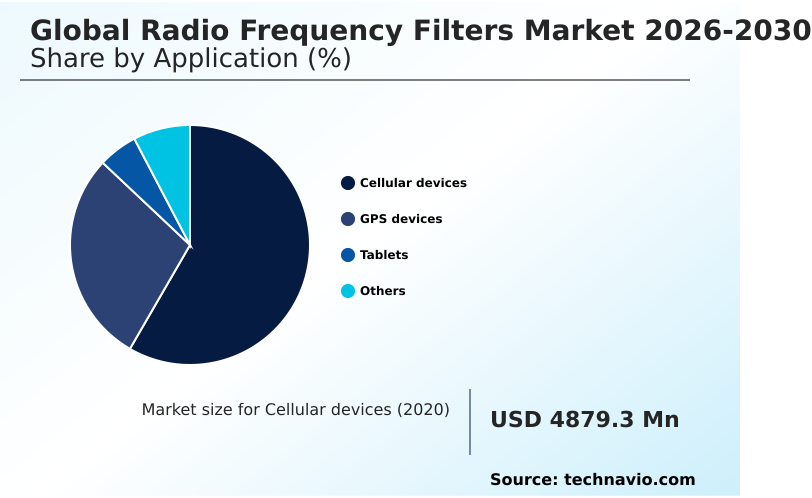
The cellular devices segment is estimated to witness significant growth during the forecast period.

The Cellular devices segment forms a critical component of the Radio Frequency Filters architecture, primarily propelled by the integration of advanced mobile telecommunications standards.

Modern mobile hardware demands sophisticated bulk acoustic wave and surface acoustic wave filters to manage crowded spectrums and ensure optimal signal isolation.

The transition toward sub-six gigahertz configurations necessitates highly integrated front-end modules that can support carrier aggregation while maintaining exceptional thermal dissipation. By minimizing insertion loss, device manufacturers have improved spectral efficiency by 15%, directly impacting overall hardware reliability.

This architectural shift forces engineers to prioritize component miniaturization and advanced piezoelectric substrate formulations. Consequently, optimizing out-of-band rejection capabilities enables seamless data transmission, ensuring that the cellular hardware segment remains a dominant revenue engine for semiconductor suppliers optimizing network capacity.
Get Free Sample

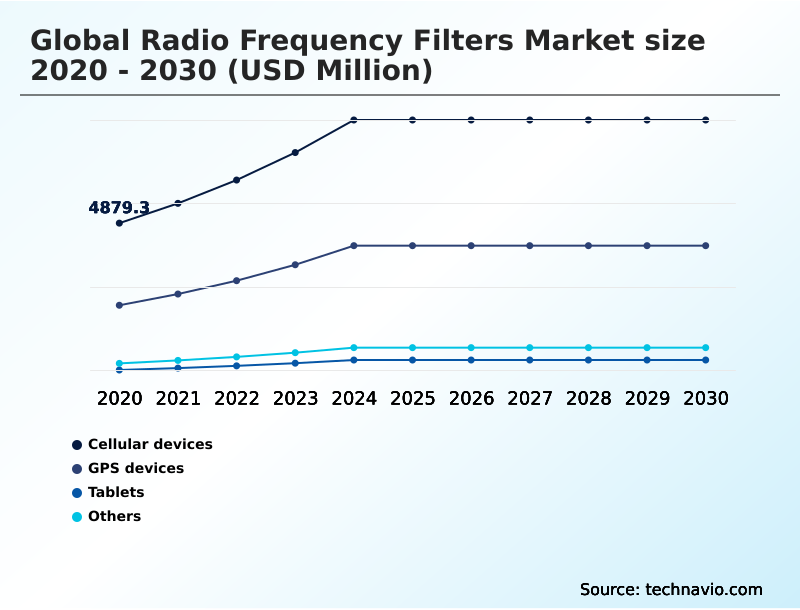
The Cellular devices segment was valued at USD 8.00 billion in 2024 and showed a gradual increase during the forecast period.
Get Free Sample

Regional Analysis

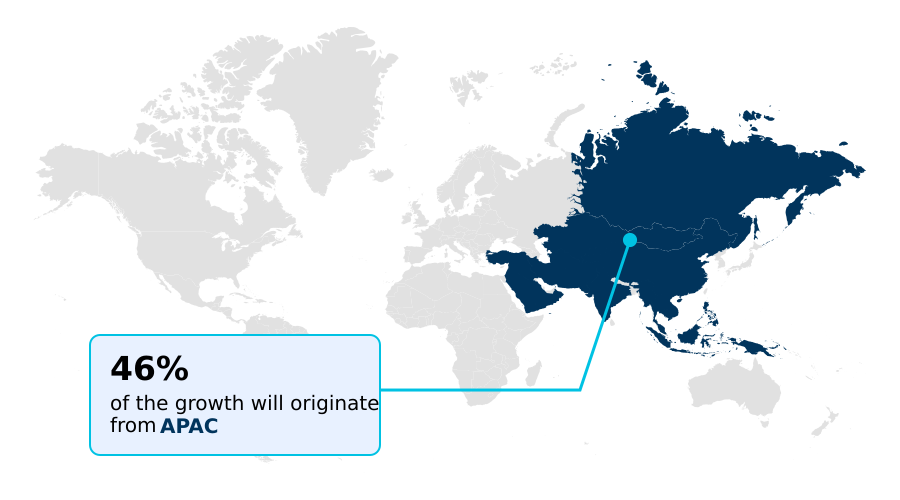
APAC is estimated to contribute 45.9% to the growth of the global market during the forecast period.Technavio’s analysts have elaborately explained the regional trends and drivers that shape the market during the forecast period.
See How Radio Frequency Filters Market Demand is Rising in APAC Get Free Sample

The Radio Frequency Filters geographic landscape is heavily concentrated in APAC, which dominates manufacturing output due to robust automated silicon substrate manufacturing processes and localized supply chains.

Foundries in China and Taiwan have achieved a 20% higher production yield in piezoelectric substrate materials compared to North America, directly reducing component lead times for mobile device assembly.

While APAC excels in high-volume component miniaturization for consumer electronics, North America prioritizes high-frequency millimeter-wave bands for aerospace and defense applications.

This strategic divergence results in North American networks achieving a 15% superior thermal dissipation efficiency in massive multiple-input multiple-output base stations.

Furthermore, stringent electromagnetic compatibility regulations in Europe have accelerated the adoption of cavity resonators, improving industrial signal isolation by 18%.

By tailoring front-end modules to distinct regional regulatory and industrial demands, global manufacturers optimize their supply networks to manage severe fabrication complexity and sustain competitive performance.

Market Dynamics

Our researchers analyzed the data with 2025 as the base year, along with the key drivers, trends, and challenges. A holistic analysis of drivers will help companies refine their marketing strategies to gain a competitive advantage.

  • The Radio Frequency Filters sector is characterized by continuous material science breakthroughs that are reshaping the fundamental architecture of wireless communications. Hardware manufacturers are actively adopting an advanced thin-film ferroelectric design platform to accelerate the prototyping of highly customized filtering modules, resulting in a 25% reduction in overall product development cycles.
  • This rapid design phase directly enhances operational planning and allows original equipment manufacturers to meet aggressive smartphone launch schedules. Concurrently, the transition toward automated silicon substrate manufacturing processes has revolutionized production scalability, improving wafer yields and significantly lowering defect rates during high-volume fabrication.
  • As network providers expand into ultra-wideband spectrums, legacy components are being rapidly replaced by temperature-compensated surface acoustic wave architectures, which deliver superior frequency stability and mitigate thermal drift under extreme operational loads.
  • To accommodate the spatial constraints of modern internet of things devices, engineers are increasingly leveraging integrated low-temperature co-fired ceramics to consolidate multiple passive components into a single, highly durable package. Furthermore, the strategic implementation of advanced acoustic wave filtering elements enables superior out-of-band rejection and minimizes signal cross-talk in dense urban environments.
  • By integrating these sophisticated methodologies, semiconductor companies achieve a 30% improvement in energy efficiency compared to older discrete filter layouts, streamlining supply chain logistics and ensuring compliance with stringent international electromagnetic interference standards.
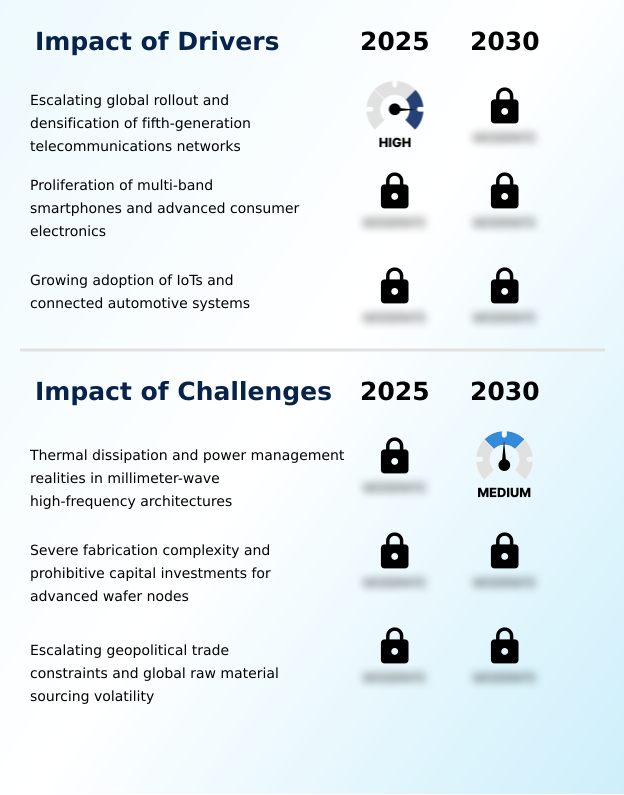
What are the key market drivers leading to the rise in the adoption of Radio Frequency Filters Industry?

  • The escalating rollout and rapid densification of fifth-generation telecommunications networks serve as the primary catalysts driving market expansion.

  • The escalating deployment of massive multiple-input multiple-output base stations acts as a dominant catalyst accelerating Radio Frequency Filters demand.
  • Because cellular operators must integrate additional spectrum bands to expand network capacity, the risk of severe spectral overlapping and signal interference increases exponentially.
  • To counteract this, infrastructure developers utilize high-performance surface acoustic wave and bulk acoustic wave components to guarantee precise signal isolation. This proactive integration reduces adjacent channel noise by 30%, directly improving overall network uptime.
  • Additionally, the proliferation of multi-band consumer electronics necessitates complex multiplexing requirements, prompting the use of lithium tantalate substrates to enhance component longevity by 20%.
  • These precise filtering capabilities optimize power management and operational efficiency, empowering businesses to deliver uninterrupted, high-speed connectivity across global commercial ecosystems.

What are the market trends shaping the Radio Frequency Filters Industry?

  • The market is experiencing an accelerated shift toward bulk acoustic wave technology and ultra-wide bandwidth architectures. This transition is essential for managing complex high-frequency networks and minimizing signal degradation.

  • The Radio Frequency Filters ecosystem is characterized by a rapid architectural shift toward integrated front-end modules and advanced bulk acoustic wave designs. Because next-generation wireless protocols require devices to process multiple frequencies simultaneously without interference, manufacturers are deploying advanced piezoelectric substrate materials to enhance fractional bandwidth.
  • This technological upgrade allows network operators to improve spectral efficiency and increase data throughput rates by 25%. Furthermore, the adoption of wafer-level packaging techniques significantly mitigates fabrication complexity, reducing component footprint by 18% and allowing for greater battery capacity in mobile hardware. Consequently, improved acoustic energy confinement prevents signal cross-talk, driving higher reliability in dense environments.
  • The integration of advanced tunable filtering systems enables dynamic spectrum allocation, directly impacting business outcomes by reducing network optimization costs by 15%.

What challenges does the Radio Frequency Filters Industry face during its growth?

  • Severe thermal dissipation requirements and complex power management realities within millimeter-wave high-frequency architectures represent critical challenges constraining industry growth.

  • Severe thermal dissipation requirements and power management limitations within millimeter-wave bands represent a formidable structural bottleneck for the Radio Frequency Filters sector. Because high-frequency data transmission generates substantial electromagnetic energy loss, standard filtering mechanisms experience significant thermal stress and frequency drift during continuous operation.
  • This localized heat generation degrades out-of-band rejection capabilities, reducing overall power handling efficiency by 15% for every minor increase in core operating temperature. Furthermore, resolving these thermal instabilities requires utilizing scandium-doped aluminum nitride, which introduces immense fabrication complexity and elevates production costs.
  • Consequently, the astronomical capital investments required to maintain cleanroom environments and advanced lithography tools deter new market entrants, increasing supply chain vulnerability and extending component procurement lead times by up to 20% for original equipment manufacturers.

Exclusive Technavio Analysis on Customer Landscape

The radio frequency filters market forecasting report includes the adoption lifecycle of the market, covering from the innovator’s stage to the laggard’s stage. It focuses on adoption rates in different regions based on penetration. Furthermore, the radio frequency filters market report also includes key purchase criteria and drivers of price sensitivity to help companies evaluate and develop their market growth analysis strategies.
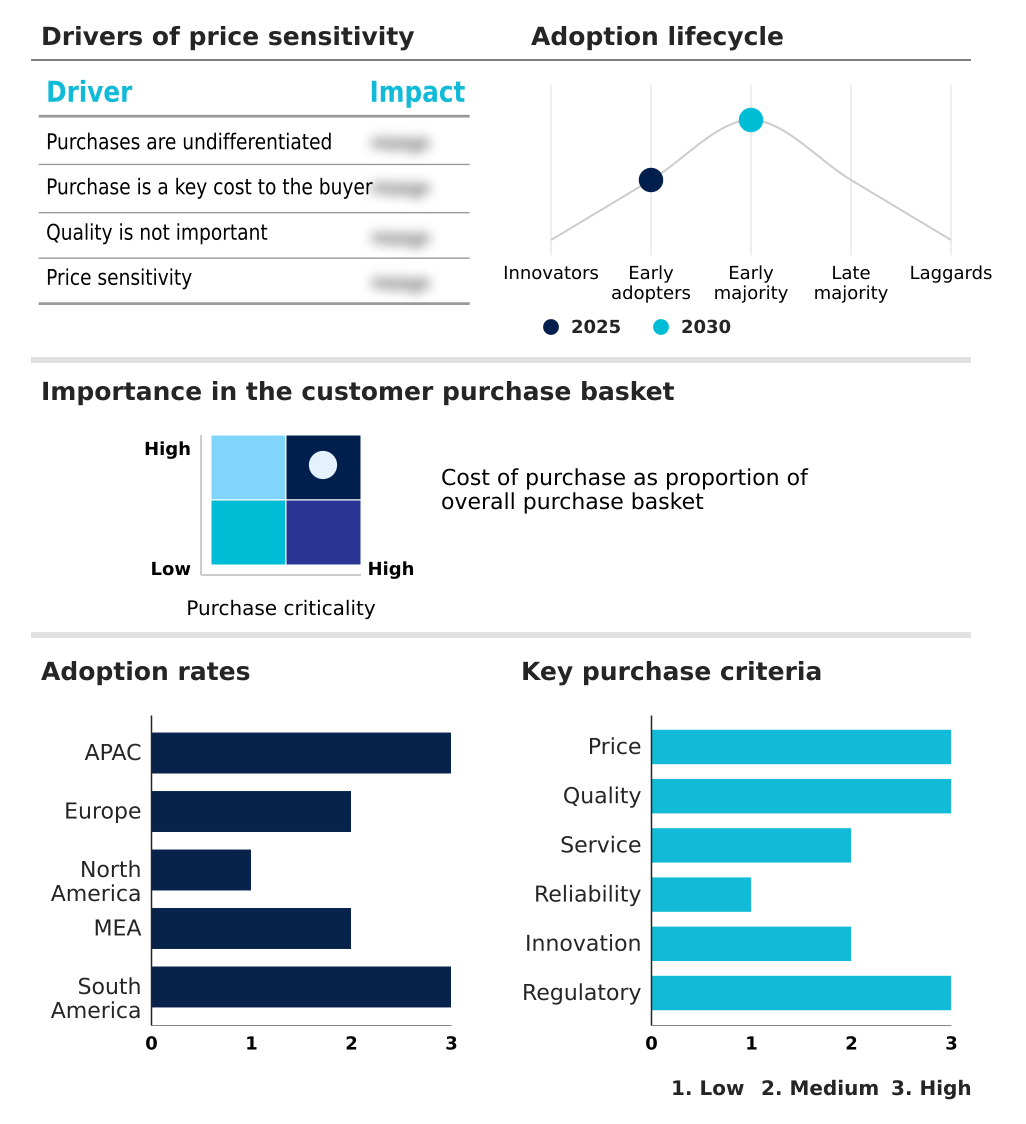
Customer Landscape of Radio Frequency Filters Industry

Competitive Landscape

Companies are implementing various strategies, such as strategic alliances, radio frequency filters market forecast, partnerships, mergers and acquisitions, geographical expansion, and product/service launches, to enhance their presence in the industry.

Abracon LLC - The manufacturer delivers advanced radio frequency filters, including ceramic band-pass, cavity, and duplexer solutions, engineered to optimize signal isolation and reduce insertion loss across diverse wireless communication networks.

The industry research and growth report includes detailed analyses of the competitive landscape of the market and information about key companies, including:

  • Abracon LLC
  • API Microelectronics Ltd.
  • Broadcom Inc.
  • Coleman Microwave Co.
  • CTS Corp.
  • Johanson Technology Inc.
  • KR Electronics Inc.
  • Microsaw Oy
  • Murata Manufacturing Co. Ltd.
  • NSI MI Technologies
  • Qorvo Inc.
  • Qualcomm Inc.
  • Reactel Inc.
  • Sawtron
  • Scientific Components Corp
  • Skyworks Solutions Inc.
  • TAIYO YUDEN Co. Ltd.
  • TDK Corp.
  • Temwell Group
  • Wainwright Instruments GmbH

Qualitative and quantitative analysis of companies has been conducted to help clients understand the wider business environment as well as the strengths and weaknesses of key industry players. Data is qualitatively analyzed to categorize companies as pure play, category-focused, industry-focused, and diversified; it is quantitatively analyzed to categorize companies as dominant, leading, strong, tentative, and weak.

Recent Development and News in Radio frequency filters market

  • In the Technology Hardware, Storage and Peripherals industry, the accelerated deployment of massive multiple-input multiple-output base stations has amplified the requirement for advanced component miniaturization, directly impacting Radio Frequency Filters demand by increasing the integration of front-end modules to achieve a 20% improvement in spectral efficiency.
  • The widespread transition toward automated silicon substrate manufacturing processes within global semiconductor foundries has enhanced fabrication yields for piezoelectric substrate materials, subsequently lowering the production costs of bulk acoustic wave components and driving a 15% adoption increase across macro base stations.
  • Strict electromagnetic compatibility standards enforced across European automotive sectors have mandated the integration of ruggedized multi-layered architectures in vehicular telematics, compelling tier-one suppliers to adopt specialized surface acoustic wave filters to reduce signal interference by over 25%.
  • The rising commercialization of software-defined radio frameworks in aerospace defense networks has necessitated the deployment of tunable filtering systems, which relies on advanced lithium niobate materials to achieve a 30% reduction in thermal stress under high-power millimeter-wave bands.

Dive into Technavio’s robust research methodology, blending expert interviews, extensive data synthesis, and validated models for unparalleled Radio Frequency Filters Market insights. See full methodology.

Market Scope
Page number 296
Base year 2025
Historic period 2020-2024
Forecast period 2026-2030
Growth momentum & CAGR Accelerate at a CAGR of 17.8%
Market growth 2026-2030 USD 20525.4 million
Market structure Fragmented
YoY growth 2025-2026(%) 16.1%
Key countries China, Japan, South Korea, Taiwan, India, Singapore, Germany, UK, France, Italy, The Netherlands, Sweden, US, Canada, Mexico, UAE, Saudi Arabia, South Africa, Israel, Turkey, Brazil, Argentina and Colombia
Competitive landscape Leading Companies, Market Positioning of Companies, Competitive Strategies, and Industry Risks

Request Free Sample

Research Analyst Overview

  • The Radio Frequency Filters landscape is undergoing a critical transformation as telecom operators and consumer electronics manufacturers upgrade their hardware ecosystems to support multi-gigabit data transmission. A defining trend is the rapid migration toward bulk acoustic wave technology, which is fundamentally reshaping boardroom product strategies and procurement budgets.
  • By integrating scandium-doped aluminum nitride into advanced piezoelectric substrate layers, manufacturers have achieved a 30% improvement in fractional bandwidth performance, drastically enhancing spectral efficiency. This material evolution enables sharper out-of-band rejection and superior acoustic energy confinement, critical for maintaining signal integrity in heavily congested networks.
  • Corporate executives are increasingly prioritizing wafer-level packaging techniques to solve severe spatial constraints, allowing for tighter integration of antenna switches and low-noise amplifiers within front-end modules. Consequently, overcoming inherent fabrication complexity through strategic capital investments ensures sustained operational resilience. Advanced thermal dissipation capabilities prevent structural degradation during continuous millimeter-wave bands transmission, ensuring long-term hardware reliability.
  • These targeted material and architectural advancements secure seamless wireless connectivity across highly demanding industrial and commercial applications.

What are the Key Data Covered in this Radio Frequency Filters Market Research and Growth Report?

  • What is the expected growth of the Radio Frequency Filters Market between 2026 and 2030?

    • USD 20.53 billion, at a CAGR of 17.8%

  • What segmentation does the market report cover?

    • The report is segmented by Application (Cellular devices, GPS devices, Tablets, and Others), Technology (SAW, and BAW), Frequency Range (Sub-1 GHz, Less than 1-6 GHz, and Above 6 GHz) and Geography (APAC, Europe, North America, Middle East and Africa, South America)

  • Which regions are analyzed in the report?

    • APAC, Europe, North America, Middle East and Africa and South America

  • What are the key growth drivers and market challenges?

    • Escalating global rollout and densification of fifth-generation telecommunications networks, Thermal dissipation and power management realities in millimeter-wave high-frequency architectures

  • Who are the major players in the Radio Frequency Filters Market?

    • Abracon LLC, API Microelectronics Ltd., Broadcom Inc., Coleman Microwave Co., CTS Corp., Johanson Technology Inc., KR Electronics Inc., Microsaw Oy, Murata Manufacturing Co. Ltd., NSI MI Technologies, Qorvo Inc., Qualcomm Inc., Reactel Inc., Sawtron, Scientific Components Corp, Skyworks Solutions Inc., TAIYO YUDEN Co. Ltd., TDK Corp., Temwell Group and Wainwright Instruments GmbH

Market Research Insights

  • The Radio Frequency Filters Market is rapidly advancing as telecommunications providers optimize massive multiple-input multiple-output base stations to handle surging data volumes. By integrating multi-layered architectures, network operators have improved signal interference mitigation by 25%, directly enhancing overall spectral efficiency.
  • The widespread adoption of component miniaturization within front-end modules has enabled smartphone manufacturers to reduce internal board space consumption by 15%, allowing for larger battery integration. Furthermore, advancements in automated silicon substrate manufacturing processes have increased production yields of structural stability components by 18%, significantly lowering supply chain bottlenecks.
  • These measurable improvements in electromagnetic compatibility and thermal stress management are essential for achieving seamless backward compatibility and driving sustained operational excellence across commercial hardware deployments.

We can help! Our analysts can customize this radio frequency filters market research report to meet your requirements.

Get in touch

1. Executive Summary

1.1 Market overview

Executive Summary - Chart on Market Overview
Executive Summary - Data Table on Market Overview
Executive Summary - Chart on Global Market Characteristics
Executive Summary - Chart on Market by Geography
Executive Summary - Chart on Market Segmentation by Application
Executive Summary - Chart on Market Segmentation by Technology
Executive Summary - Chart on Market Segmentation by Frequency Range
Executive Summary - Chart on Incremental Growth
Executive Summary - Data Table on Incremental Growth
Executive Summary - Chart on Company Market Positioning

2. Technavio Analysis

2.1 Analysis of price sensitivity, lifecycle, customer purchase basket, adoption rates, and purchase criteria

2.2 Criticality of inputs and Factors of differentiation

Chart on Overview on criticality of inputs and factors of differentiation

2.3 Factors of disruption

Chart on Overview on factors of disruption

2.4 Impact of drivers and challenges

Chart on Impact of drivers and challenges in 2025 and 2030

3. Market Landscape

3.1 Market ecosystem

Chart on Parent Market
Data Table on - Parent Market

3.2 Market characteristics

Chart on Market characteristics analysis

3.3 Value chain analysis

Chart on Value chain analysis

4. Market Sizing

4.1 Market definition

Data Table on Offerings of companies included in the market definition

4.2 Market segment analysis

Market segments

4.3 Market size 2025

4.4 Market outlook: Forecast for 2025-2030

Chart on Global - Market size and forecast 2025-2030 ($ million)
Data Table on Global - Market size and forecast 2025-2030 ($ million)
Chart on Global Market: Year-over-year growth 2025-2030 (%)
Data Table on Global Market: Year-over-year growth 2025-2030 (%)

5. Historic Market Size

5.1 Global Radio Frequency Filters Market 2020 - 2024

Historic Market Size - Data Table on Global Radio Frequency Filters Market 2020 - 2024 ($ million)

5.2 Application segment analysis 2020 - 2024

Historic Market Size - Application Segment 2020 - 2024 ($ million)

5.3 Technology segment analysis 2020 - 2024

Historic Market Size - Technology Segment 2020 - 2024 ($ million)

5.4 Frequency Range segment analysis 2020 - 2024

Historic Market Size - Frequency Range Segment 2020 - 2024 ($ million)

5.5 Geography segment analysis 2020 - 2024

Historic Market Size - Geography Segment 2020 - 2024 ($ million)

5.6 Country segment analysis 2020 - 2024

Historic Market Size - Country Segment 2020 - 2024 ($ million)

6. Qualitative Analysis

6.1 Impact of AI on global radio frequency filters market

6.2 Impact of geopolitical conflicts on global radio frequency filters market

7. Five Forces Analysis

7.1 Five forces summary

Five forces analysis - Comparison between 2025 and 2030

7.2 Bargaining power of buyers

Bargaining power of buyers - Impact of key factors 2025 and 2030

7.3 Bargaining power of suppliers

Bargaining power of suppliers - Impact of key factors in 2025 and 2030

7.4 Threat of new entrants

Threat of new entrants - Impact of key factors in 2025 and 2030

7.5 Threat of substitutes

Threat of substitutes - Impact of key factors in 2025 and 2030

7.6 Threat of rivalry

Threat of rivalry - Impact of key factors in 2025 and 2030

7.7 Market condition

Chart on Market condition - Five forces 2025 and 2030

8. Market Segmentation by Application

8.1 Market segments

Chart on Application - Market share 2025-2030 (%)
Data Table on Application - Market share 2025-2030 (%)

8.2 Comparison by Application

Chart on Comparison by Application
Data Table on Comparison by Application

8.3 Cellular devices - Market size and forecast 2025-2030

Chart on Cellular devices - Market size and forecast 2025-2030 ($ million)
Data Table on Cellular devices - Market size and forecast 2025-2030 ($ million)
Chart on Cellular devices - Year-over-year growth 2025-2030 (%)
Data Table on Cellular devices - Year-over-year growth 2025-2030 (%)

8.4 GPS devices - Market size and forecast 2025-2030

Chart on GPS devices - Market size and forecast 2025-2030 ($ million)
Data Table on GPS devices - Market size and forecast 2025-2030 ($ million)
Chart on GPS devices - Year-over-year growth 2025-2030 (%)
Data Table on GPS devices - Year-over-year growth 2025-2030 (%)

8.5 Tablets - Market size and forecast 2025-2030

Chart on Tablets - Market size and forecast 2025-2030 ($ million)
Data Table on Tablets - Market size and forecast 2025-2030 ($ million)
Chart on Tablets - Year-over-year growth 2025-2030 (%)
Data Table on Tablets - Year-over-year growth 2025-2030 (%)

8.6 Others - Market size and forecast 2025-2030

Chart on Others - Market size and forecast 2025-2030 ($ million)
Data Table on Others - Market size and forecast 2025-2030 ($ million)
Chart on Others - Year-over-year growth 2025-2030 (%)
Data Table on Others - Year-over-year growth 2025-2030 (%)

8.7 Market opportunity by Application

Market opportunity by Application ($ million)
Data Table on Market opportunity by Application ($ million)

9. Market Segmentation by Technology

9.1 Market segments

Chart on Technology - Market share 2025-2030 (%)
Data Table on Technology - Market share 2025-2030 (%)

9.2 Comparison by Technology

Chart on Comparison by Technology
Data Table on Comparison by Technology

9.3 SAW - Market size and forecast 2025-2030

Chart on SAW - Market size and forecast 2025-2030 ($ million)
Data Table on SAW - Market size and forecast 2025-2030 ($ million)
Chart on SAW - Year-over-year growth 2025-2030 (%)
Data Table on SAW - Year-over-year growth 2025-2030 (%)

9.4 BAW - Market size and forecast 2025-2030

Chart on BAW - Market size and forecast 2025-2030 ($ million)
Data Table on BAW - Market size and forecast 2025-2030 ($ million)
Chart on BAW - Year-over-year growth 2025-2030 (%)
Data Table on BAW - Year-over-year growth 2025-2030 (%)

9.5 Market opportunity by Technology

Market opportunity by Technology ($ million)
Data Table on Market opportunity by Technology ($ million)

10. Market Segmentation by Frequency Range

10.1 Market segments

Chart on Frequency Range - Market share 2025-2030 (%)
Data Table on Frequency Range - Market share 2025-2030 (%)

10.2 Comparison by Frequency Range

Chart on Comparison by Frequency Range
Data Table on Comparison by Frequency Range

10.3 Sub-1 GHz - Market size and forecast 2025-2030

Chart on Sub-1 GHz - Market size and forecast 2025-2030 ($ million)
Data Table on Sub-1 GHz - Market size and forecast 2025-2030 ($ million)
Chart on Sub-1 GHz - Year-over-year growth 2025-2030 (%)
Data Table on Sub-1 GHz - Year-over-year growth 2025-2030 (%)

10.4 Less than 1-6 GHz - Market size and forecast 2025-2030

Chart on Less than 1-6 GHz - Market size and forecast 2025-2030 ($ million)
Data Table on Less than 1-6 GHz - Market size and forecast 2025-2030 ($ million)
Chart on Less than 1-6 GHz - Year-over-year growth 2025-2030 (%)
Data Table on Less than 1-6 GHz - Year-over-year growth 2025-2030 (%)

10.5 Above 6 GHz - Market size and forecast 2025-2030

Chart on Above 6 GHz - Market size and forecast 2025-2030 ($ million)
Data Table on Above 6 GHz - Market size and forecast 2025-2030 ($ million)
Chart on Above 6 GHz - Year-over-year growth 2025-2030 (%)
Data Table on Above 6 GHz - Year-over-year growth 2025-2030 (%)

10.6 Market opportunity by Frequency Range

Market opportunity by Frequency Range ($ million)
Data Table on Market opportunity by Frequency Range ($ million)

11. Customer Landscape

11.1 Customer landscape overview

Analysis of price sensitivity, lifecycle, customer purchase basket, adoption rates, and purchase criteria

12. Geographic Landscape

12.1 Geographic segmentation

Chart on Market share by geography 2025-2030 (%)
Data Table on Market share by geography 2025-2030 (%)

12.2 Geographic comparison

Chart on Geographic comparison
Data Table on Geographic comparison

12.3 APAC - Market size and forecast 2025-2030

Chart on APAC - Market size and forecast 2025-2030 ($ million)
Data Table on APAC - Market size and forecast 2025-2030 ($ million)
Chart on APAC - Year-over-year growth 2025-2030 (%)
Data Table on APAC - Year-over-year growth 2025-2030 (%)
Chart on Regional Comparison - APAC
Data Table on Regional Comparison - APAC

12.3.1 China - Market size and forecast 2025-2030

Chart on China - Market size and forecast 2025-2030 ($ million)
Data Table on China - Market size and forecast 2025-2030 ($ million)
Chart on China - Year-over-year growth 2025-2030 (%)
Data Table on China - Year-over-year growth 2025-2030 (%)

12.3.2 Japan - Market size and forecast 2025-2030

Chart on Japan - Market size and forecast 2025-2030 ($ million)
Data Table on Japan - Market size and forecast 2025-2030 ($ million)
Chart on Japan - Year-over-year growth 2025-2030 (%)
Data Table on Japan - Year-over-year growth 2025-2030 (%)

12.3.3 South Korea - Market size and forecast 2025-2030

Chart on South Korea - Market size and forecast 2025-2030 ($ million)
Data Table on South Korea - Market size and forecast 2025-2030 ($ million)
Chart on South Korea - Year-over-year growth 2025-2030 (%)
Data Table on South Korea - Year-over-year growth 2025-2030 (%)

12.3.4 Taiwan - Market size and forecast 2025-2030

Chart on Taiwan - Market size and forecast 2025-2030 ($ million)
Data Table on Taiwan - Market size and forecast 2025-2030 ($ million)
Chart on Taiwan - Year-over-year growth 2025-2030 (%)
Data Table on Taiwan - Year-over-year growth 2025-2030 (%)

12.3.5 India - Market size and forecast 2025-2030

Chart on India - Market size and forecast 2025-2030 ($ million)
Data Table on India - Market size and forecast 2025-2030 ($ million)
Chart on India - Year-over-year growth 2025-2030 (%)
Data Table on India - Year-over-year growth 2025-2030 (%)

12.3.6 Singapore - Market size and forecast 2025-2030

Chart on Singapore - Market size and forecast 2025-2030 ($ million)
Data Table on Singapore - Market size and forecast 2025-2030 ($ million)
Chart on Singapore - Year-over-year growth 2025-2030 (%)
Data Table on Singapore - Year-over-year growth 2025-2030 (%)

12.4 Europe - Market size and forecast 2025-2030

Chart on Europe - Market size and forecast 2025-2030 ($ million)
Data Table on Europe - Market size and forecast 2025-2030 ($ million)
Chart on Europe - Year-over-year growth 2025-2030 (%)
Data Table on Europe - Year-over-year growth 2025-2030 (%)
Chart on Regional Comparison - Europe
Data Table on Regional Comparison - Europe

12.4.1 Germany - Market size and forecast 2025-2030

Chart on Germany - Market size and forecast 2025-2030 ($ million)
Data Table on Germany - Market size and forecast 2025-2030 ($ million)
Chart on Germany - Year-over-year growth 2025-2030 (%)
Data Table on Germany - Year-over-year growth 2025-2030 (%)

12.4.2 UK - Market size and forecast 2025-2030

Chart on UK - Market size and forecast 2025-2030 ($ million)
Data Table on UK - Market size and forecast 2025-2030 ($ million)
Chart on UK - Year-over-year growth 2025-2030 (%)
Data Table on UK - Year-over-year growth 2025-2030 (%)

12.4.3 France - Market size and forecast 2025-2030

Chart on France - Market size and forecast 2025-2030 ($ million)
Data Table on France - Market size and forecast 2025-2030 ($ million)
Chart on France - Year-over-year growth 2025-2030 (%)
Data Table on France - Year-over-year growth 2025-2030 (%)

12.4.4 Italy - Market size and forecast 2025-2030

Chart on Italy - Market size and forecast 2025-2030 ($ million)
Data Table on Italy - Market size and forecast 2025-2030 ($ million)
Chart on Italy - Year-over-year growth 2025-2030 (%)
Data Table on Italy - Year-over-year growth 2025-2030 (%)

12.4.5 The Netherlands - Market size and forecast 2025-2030

Chart on The Netherlands - Market size and forecast 2025-2030 ($ million)
Data Table on The Netherlands - Market size and forecast 2025-2030 ($ million)
Chart on The Netherlands - Year-over-year growth 2025-2030 (%)
Data Table on The Netherlands - Year-over-year growth 2025-2030 (%)

12.4.6 Sweden - Market size and forecast 2025-2030

Chart on Sweden - Market size and forecast 2025-2030 ($ million)
Data Table on Sweden - Market size and forecast 2025-2030 ($ million)
Chart on Sweden - Year-over-year growth 2025-2030 (%)
Data Table on Sweden - Year-over-year growth 2025-2030 (%)

12.5 North America - Market size and forecast 2025-2030

Chart on North America - Market size and forecast 2025-2030 ($ million)
Data Table on North America - Market size and forecast 2025-2030 ($ million)
Chart on North America - Year-over-year growth 2025-2030 (%)
Data Table on North America - Year-over-year growth 2025-2030 (%)
Chart on Regional Comparison - North America
Data Table on Regional Comparison - North America

12.5.1 US - Market size and forecast 2025-2030

Chart on US - Market size and forecast 2025-2030 ($ million)
Data Table on US - Market size and forecast 2025-2030 ($ million)
Chart on US - Year-over-year growth 2025-2030 (%)
Data Table on US - Year-over-year growth 2025-2030 (%)

12.5.2 Canada - Market size and forecast 2025-2030

Chart on Canada - Market size and forecast 2025-2030 ($ million)
Data Table on Canada - Market size and forecast 2025-2030 ($ million)
Chart on Canada - Year-over-year growth 2025-2030 (%)
Data Table on Canada - Year-over-year growth 2025-2030 (%)

12.5.3 Mexico - Market size and forecast 2025-2030

Chart on Mexico - Market size and forecast 2025-2030 ($ million)
Data Table on Mexico - Market size and forecast 2025-2030 ($ million)
Chart on Mexico - Year-over-year growth 2025-2030 (%)
Data Table on Mexico - Year-over-year growth 2025-2030 (%)

12.6 Middle East and Africa - Market size and forecast 2025-2030

Chart on Middle East and Africa - Market size and forecast 2025-2030 ($ million)
Data Table on Middle East and Africa - Market size and forecast 2025-2030 ($ million)
Chart on Middle East and Africa - Year-over-year growth 2025-2030 (%)
Data Table on Middle East and Africa - Year-over-year growth 2025-2030 (%)
Chart on Regional Comparison - Middle East and Africa
Data Table on Regional Comparison - Middle East and Africa

12.6.1 UAE - Market size and forecast 2025-2030

Chart on UAE - Market size and forecast 2025-2030 ($ million)
Data Table on UAE - Market size and forecast 2025-2030 ($ million)
Chart on UAE - Year-over-year growth 2025-2030 (%)
Data Table on UAE - Year-over-year growth 2025-2030 (%)

12.6.2 Saudi Arabia - Market size and forecast 2025-2030

Chart on Saudi Arabia - Market size and forecast 2025-2030 ($ million)
Data Table on Saudi Arabia - Market size and forecast 2025-2030 ($ million)
Chart on Saudi Arabia - Year-over-year growth 2025-2030 (%)
Data Table on Saudi Arabia - Year-over-year growth 2025-2030 (%)

12.6.3 South Africa - Market size and forecast 2025-2030

Chart on South Africa - Market size and forecast 2025-2030 ($ million)
Data Table on South Africa - Market size and forecast 2025-2030 ($ million)
Chart on South Africa - Year-over-year growth 2025-2030 (%)
Data Table on South Africa - Year-over-year growth 2025-2030 (%)

12.6.4 Israel - Market size and forecast 2025-2030

Chart on Israel - Market size and forecast 2025-2030 ($ million)
Data Table on Israel - Market size and forecast 2025-2030 ($ million)
Chart on Israel - Year-over-year growth 2025-2030 (%)
Data Table on Israel - Year-over-year growth 2025-2030 (%)

12.6.5 Turkey - Market size and forecast 2025-2030

Chart on Turkey - Market size and forecast 2025-2030 ($ million)
Data Table on Turkey - Market size and forecast 2025-2030 ($ million)
Chart on Turkey - Year-over-year growth 2025-2030 (%)
Data Table on Turkey - Year-over-year growth 2025-2030 (%)

12.7 South America - Market size and forecast 2025-2030

Chart on South America - Market size and forecast 2025-2030 ($ million)
Data Table on South America - Market size and forecast 2025-2030 ($ million)
Chart on South America - Year-over-year growth 2025-2030 (%)
Data Table on South America - Year-over-year growth 2025-2030 (%)
Chart on Regional Comparison - South America
Data Table on Regional Comparison - South America

12.7.1 Brazil - Market size and forecast 2025-2030

Chart on Brazil - Market size and forecast 2025-2030 ($ million)
Data Table on Brazil - Market size and forecast 2025-2030 ($ million)
Chart on Brazil - Year-over-year growth 2025-2030 (%)
Data Table on Brazil - Year-over-year growth 2025-2030 (%)

12.7.2 Argentina - Market size and forecast 2025-2030

Chart on Argentina - Market size and forecast 2025-2030 ($ million)
Data Table on Argentina - Market size and forecast 2025-2030 ($ million)
Chart on Argentina - Year-over-year growth 2025-2030 (%)
Data Table on Argentina - Year-over-year growth 2025-2030 (%)

12.7.3 Colombia - Market size and forecast 2025-2030

Chart on Colombia - Market size and forecast 2025-2030 ($ million)
Data Table on Colombia - Market size and forecast 2025-2030 ($ million)
Chart on Colombia - Year-over-year growth 2025-2030 (%)
Data Table on Colombia - Year-over-year growth 2025-2030 (%)

12.8 Market opportunity by geography

Market opportunity by geography ($ million)
Data Tables on Market opportunity by geography ($ million)

13. Drivers, Challenges, and Opportunity

13.1 Market drivers

Escalating global rollout and densification of fifth-generation telecommunications networks
Proliferation of multi-band smartphones and advanced consumer electronics
Growing adoption of IoTs and connected automotive systems

13.2 Market challenges

Thermal dissipation and power management realities in millimeter-wave high-frequency architectures
Severe fabrication complexity and prohibitive capital investments for advanced wafer nodes
Escalating geopolitical trade constraints and global raw material sourcing volatility

13.3 Impact of drivers and challenges

Impact of drivers and challenges in 2025 and 2030

13.4 Market opportunities

Accelerated shift toward bulk acoustic wave technology and ultra-wide bandwidth architectures
Growing integration of material innovations with high-performance piezoelectric substrates
Pervasive consolidation of radio frequency front-end modules for multi-protocol connectivity

14. Competitive Landscape

14.1 Overview

14.2

Overview on criticality of inputs and factors of differentiation

14.3 Landscape disruption

Overview on factors of disruption

14.4 Industry risks

Impact of key risks on business

15. Competitive Analysis

15.1 Companies profiled

Companies covered

15.2 Company ranking index

15.3 Market positioning of companies

Matrix on companies position and classification

15.4 API Microelectronics Ltd.

API Microelectronics Ltd. - Overview
API Microelectronics Ltd. - Product / Service
API Microelectronics Ltd. - Key offerings
SWOT

15.5 Broadcom Inc.

Broadcom Inc. - Overview
Broadcom Inc. - Business segments
Broadcom Inc. - Key offerings
Broadcom Inc. - Segment focus
SWOT

15.6 CTS Corp.

CTS Corp. - Overview
CTS Corp. - Product / Service
CTS Corp. - Key offerings
SWOT

15.7 Johanson Technology Inc.

Johanson Technology Inc. - Overview
Johanson Technology Inc. - Product / Service
Johanson Technology Inc. - Key offerings
SWOT

15.8 Microsaw Oy

Microsaw Oy - Overview
Microsaw Oy - Product / Service
Microsaw Oy - Key offerings
SWOT

15.9 Murata Manufacturing Co. Ltd.

Murata Manufacturing Co. Ltd. - Overview
Murata Manufacturing Co. Ltd. - Business segments
Murata Manufacturing Co. Ltd. - Key offerings
Murata Manufacturing Co. Ltd. - Segment focus
SWOT

15.10 NSI MI Technologies

NSI MI Technologies - Overview
NSI MI Technologies - Product / Service
NSI MI Technologies - Key offerings
SWOT

15.11 Qorvo Inc.

Qorvo Inc. - Overview
Qorvo Inc. - Business segments
Qorvo Inc. - Key offerings
Qorvo Inc. - Segment focus
SWOT

15.12 Qualcomm Inc.

Qualcomm Inc. - Overview
Qualcomm Inc. - Business segments
Qualcomm Inc. - Key news
Qualcomm Inc. - Key offerings
Qualcomm Inc. - Segment focus
SWOT

15.13 Scientific Components Corp

Scientific Components Corp - Overview
Scientific Components Corp - Product / Service
Scientific Components Corp - Key offerings
SWOT

15.14 Skyworks Solutions Inc.

Skyworks Solutions Inc. - Overview
Skyworks Solutions Inc. - Product / Service
Skyworks Solutions Inc. - Key offerings
SWOT

15.15 TAIYO YUDEN Co. Ltd.

TAIYO YUDEN Co. Ltd. - Overview
TAIYO YUDEN Co. Ltd. - Product / Service
TAIYO YUDEN Co. Ltd. - Key offerings
SWOT

15.16 TDK Corp.

TDK Corp. - Overview
TDK Corp. - Business segments
TDK Corp. - Key offerings
TDK Corp. - Segment focus
SWOT

15.17 Temwell Group

Temwell Group - Overview
Temwell Group - Product / Service
Temwell Group - Key offerings
SWOT

15.18 Wainwright Instruments GmbH

Wainwright Instruments GmbH - Overview
Wainwright Instruments GmbH - Product / Service
Wainwright Instruments GmbH - Key offerings
SWOT

16. Appendix

16.1 Scope of the report

Market definition
Objectives
Notes and caveats

16.2 Inclusions and exclusions checklist

Inclusions checklist
Exclusions checklist

16.3 Currency conversion rates for US$

16.4 Research methodology

16.5 Data procurement

Information sources

16.6 Data validation

16.7 Validation techniques employed for market sizing

16.8 Data synthesis

16.9 360 degree market analysis

16.10 List of abbreviations

Research Methodology

Technavio presents a detailed picture of the market by way of study, synthesis, and summation of data from multiple sources. The analysts have presented the various facets of the market with a particular focus on identifying the key industry influencers. The data thus presented is comprehensive, reliable, and the result of extensive research, both primary and secondary.

INFORMATION SOURCES

Primary sources

  • Manufacturers and suppliers
  • Channel partners
  • Industry experts
  • Strategic decision makers

Secondary sources

  • Industry journals and periodicals
  • Government data
  • Financial reports of key industry players
  • Historical data
  • Press releases

DATA ANALYSIS

Data Synthesis

  • Collation of data
  • Estimation of key figures
  • Analysis of derived insights

Data Validation

  • Triangulation with data models
  • Reference against proprietary databases
  • Corroboration with industry experts

REPORT WRITING

Qualitative

  • Market drivers
  • Market challenges
  • Market trends
  • Five forces analysis

Quantitative

  • Market size and forecast
  • Market segmentation
  • Geographical insights
  • Competitive landscape

Interested in this report?

Get your sample now to see our research methodology and insights!

Download Now

Frequently Asked Questions

Radio Frequency Filters market growth will increase by USD 20525.4 million during 2026-2030.

The Radio Frequency Filters market is expected to grow at a CAGR of 17.8% during 2026-2030.

Radio Frequency Filters market is segmented by Application (Cellular devices, GPS devices, Tablets, Others) Technology (SAW, BAW) Frequency range (Sub-1 GHz, Less than 1-6 GHz, Above 6 GHz)

Abracon LLC, API Microelectronics Ltd., Broadcom Inc., Coleman Microwave Co., CTS Corp., Johanson Technology Inc., KR Electronics Inc., Microsaw Oy, Murata Manufacturing Co. Ltd., NSI MI Technologies, Qorvo Inc., Qualcomm Inc., Reactel Inc., Sawtron, Scientific Components Corp, Skyworks Solutions Inc., TAIYO YUDEN Co. Ltd., TDK Corp., Temwell Group, Wainwright Instruments GmbH are a few of the key vendors in the Radio Frequency Filters market.

APAC will register the highest growth rate of 45.9% among the other regions. Therefore, the Radio Frequency Filters market in APAC is expected to garner significant business opportunities for the vendors during the forecast period.

China, Japan, South Korea, Taiwan, India, Singapore, Germany, UK, France, Italy, The Netherlands, Sweden, US, Canada, Mexico, UAE, Saudi Arabia, South Africa, Israel, Turkey, Brazil, Argentina, Colombia

  • Escalating global rollout and densification of fifth-generation telecommunications networks is the driving factor this market.

The Radio Frequency Filters market vendors should focus on grabbing business opportunities from the Application segment as it accounted for the largest market share in the base year.
RIA - Research AI Assistant
Ask RIA
