
Heat Network Market Size 2024-2028
The heat network market size is forecast to increase by USD 23.39 billion at a CAGR of 4.4% between 2023 and 2028.
- The market is witnessing significant growth due to various driving factors. Regulatory changes and government initiatives are key catalysts propelling the market's expansion. For instance, the US Energy Policy Act of 2005 encourages the development of district heating and cooling systems. Additionally, irregularities in the pricing of heat networks are being addressed through the implementation of transparency regulations, such as the Heat Network (Metering and Billing) Regulations In the UK. Renewable energy sources, such as biomass and geothermal, are becoming increasingly popular for heat energy production in heat plants. However, challenges persist, including the high upfront costs of installing heat networks and the need for standardization in technology and regulations across regions. To mitigate these challenges, industry collaborations and technological advancements are essential.
What will be the Size of the Heat Network Market During the Forecast Period?

- The market In the US is experiencing significant growth due to increasing energy efficiency, environmental concerns, and the pursuit of climate change goals. District heating systems, including those utilizing renewable energy sources such as geothermal and solar thermal, are gaining popularity as they offer reduced greenhouse gas emissions, improved air quality, and cost savings on energy bills.
- Smart heat networks, equipped with sensors and controls, optimize energy usage and enhance overall system performance. Centralized heating systems, which produce heat at a central location and distribute it through a network, are also on the rise. Power generation and heat production are increasingly being integrated, providing additional cost savings and carbon emission reduction. Overall, the market is poised for continued growth as the US strives to reduce its carbon footprint and improve energy efficiency in residential and commercial sectors.
How is this Heat Network Industry segmented and which is the largest segment?
The heat network industry research report provides comprehensive data (region-wise segment analysis), with forecasts and estimates in "USD billion" for the period 2024-2028, as well as historical data from 2018-2022 for the following segments.
- Type
- Hot water heat network
- Steam heat network
- End-user
- Residential
- Commercial
- Geography
- Europe
- Germany
- UK
- Sweden
- Denmark
- APAC
- China
- Japan
- South Korea
- North America
- US
- South America
- Middle East and Africa
- Europe
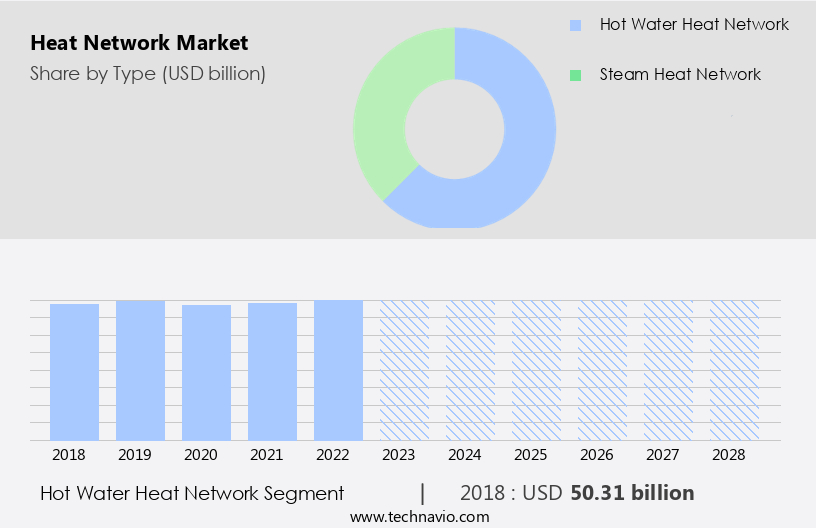
By Type Insights
- The hot water heat network segment is estimated to witness significant growth during the forecast period.
The hot water market is experiencing growth as cities pursue sustainable heating solutions. For instance, the city council of Plymouth, UK, is planning the initial phase of a district heating system. This system will distribute heat from a central source to multiple consumers through underground pipes carrying hot water. This approach eliminates the need for gas boilers or electric heaters in each building, resulting in a more efficient city-wide central heating system.
Heat generation sources include power generation and waste heat, with renewable sources increasingly used for energy transition and carbon emission reduction. Energy efficiency is a significant factor In the market's growth, making heat networks an attractive option for businesses and residential areas.
Get a glance at the Heat Network Industry report of share of various segments Request Free Sample
The hot water heat network segment was valued at USD 50.31 billion in 2018 and showed a gradual increase during the forecast period.
Regional Analysis
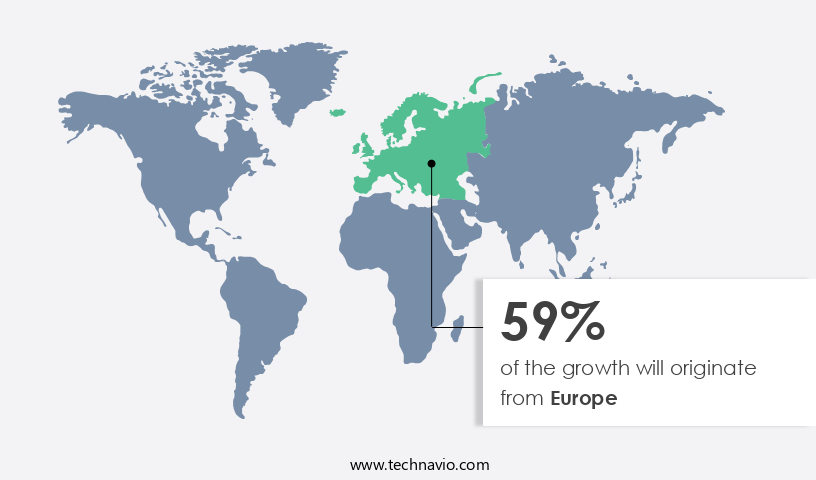
- Europe is estimated to contribute 59% to the growth of the global market during the forecast period.
Technavio's analysts have elaborately explained the regional trends and drivers that shape the market during the forecast period.
For more insights on the market share of various regions, Request Free Sample
The European market is witnessing notable expansion due to forward-thinking initiatives and strategic partnerships. For instance, NTT's plan to link its Frankfurt data center to a local district heating system in Hattersheim am Main showcases the potential of utilizing waste heat from data centers for residential heating. Announced in June 2024, this project, in collaboration with Mainova, aims to heat over 600 households using waste heat from NTT's data center. This endeavor underscores the significance of energy efficiency and sustainability by meeting residential heating demands through waste heat. The NTT Data center will primarily supply heating requirements for the network, while the existing gas-powered combined heat and power plant remains for peak loads and backup. This project's implementation contributes to reducing greenhouse gas emissions, improving air quality, and decreasing energy costs for households.
Market Dynamics
Our heat network market researchers analyzed the data with 2023 as the base year, along with the key drivers, trends, and challenges. A holistic analysis of drivers will help companies refine their marketing strategies to gain a competitive advantage.
What are the key market drivers leading to the rise In the adoption of Heat Network Industry?
Regulatory changes is the key driver of the market.
- The market is experiencing significant growth due to increasing focus on energy efficiency, reducing greenhouse gas emissions, and improving air quality. The adoption of renewable energy sources, such as geothermal and solar thermal, is a key trend in this market. Advanced control systems, sensors, and data analytics are being integrated into heat networks to optimize energy production and reduce carbon emissions. District heating systems, including community heating and microgrids, are gaining popularity as energy-efficient solutions for residential, commercial, and industrial applications. Heat source diversity is expanding beyond fossil fuels to include waste heat and renewable energy sources.
- System configuration options include open and closed loops, hybrid systems, and waste heat recovery. Regulatory changes, such as the UK Government's commitment to new legislation by 2025, are driving the market's expansion. This legislation aims to establish price protections and standards for district heating systems, ensuring fair treatment and reliable service for consumers. The energy transition towards renewable energy sources and the need to reduce carbon emissions are major market drivers. Energy security and climate change are significant concerns, making energy management and renewable energy integration essential for heat networks. Heating solutions must be efficient, reliable, and sustainable to meet climate change goals and reduce energy costs. The market offers various energy-efficient and renewable energy solutions for heat production, including biomass densification and solar thermal.
What are the market trends shaping the Heat Network Industry?
Government initiatives is the upcoming market trend.
- The market is witnessing substantial growth due to increasing emphasis on energy efficiency, reduced greenhouse gas emissions, and improved air quality. Government initiatives, such as the UK's Heat Network Efficiency Scheme (HNES), are driving this trend by providing financial support to enhance the performance of heat networks.
- The transition to renewable energy sources, such as geothermal, solar thermal, and waste heat recovery, is also gaining momentum in heat network systems. Advanced control systems, sensors, data analytics, and application insights are being integrated into smart heat networks to improve energy management and efficiency. The adoption of renewable energy sources and energy-efficient solutions in district heating, community heating, and industrial applications is crucial in meeting climate change goals and reducing carbon emissions from energy production. Heat networks utilizing renewable energy sources, such as biomass densification and solar thermal, offer energy security and contribute to the energy transition.
What challenges does the Heat Network Industry face during its growth?
Irregularities in the pricing of heat networks is a key challenge affecting the industry growth.
- The market is experiencing significant growth due to the increasing adoption of renewable energy sources for heat generation. Energy efficiency, a key driver in this market, is essential in reducing greenhouse gas emissions and improving air quality. District heating systems, including community heating and microgrids, are becoming increasingly popular as energy-efficient solutions for residential, commercial, and industrial applications. Renewable energy sources, such as geothermal, solar thermal, and biomass, are being integrated into heat networks to reduce reliance on fossil fuels and waste heat. Advanced control systems and sensors enable the optimization of heat production and distribution, enhancing energy efficiency and reducing carbon emissions.
- The integration of renewable energy sources into heat networks presents challenges, such as system configuration and energy density. Open and closed-loop systems, hybrid systems, and waste heat recovery are some of the solutions being explored to address these challenges. The transition to renewable energy sources is crucial in meeting climate change goals and reducing energy costs. Energy security is another factor driving the growth of the market. Centralized heating systems, such as heat plants and boiler plants, are being replaced with renewable energy sources to ensure a stable and reliable energy supply. Data analytics and application insights are being used to optimize heat network performance and improve energy management.
Exclusive Customer Landscape
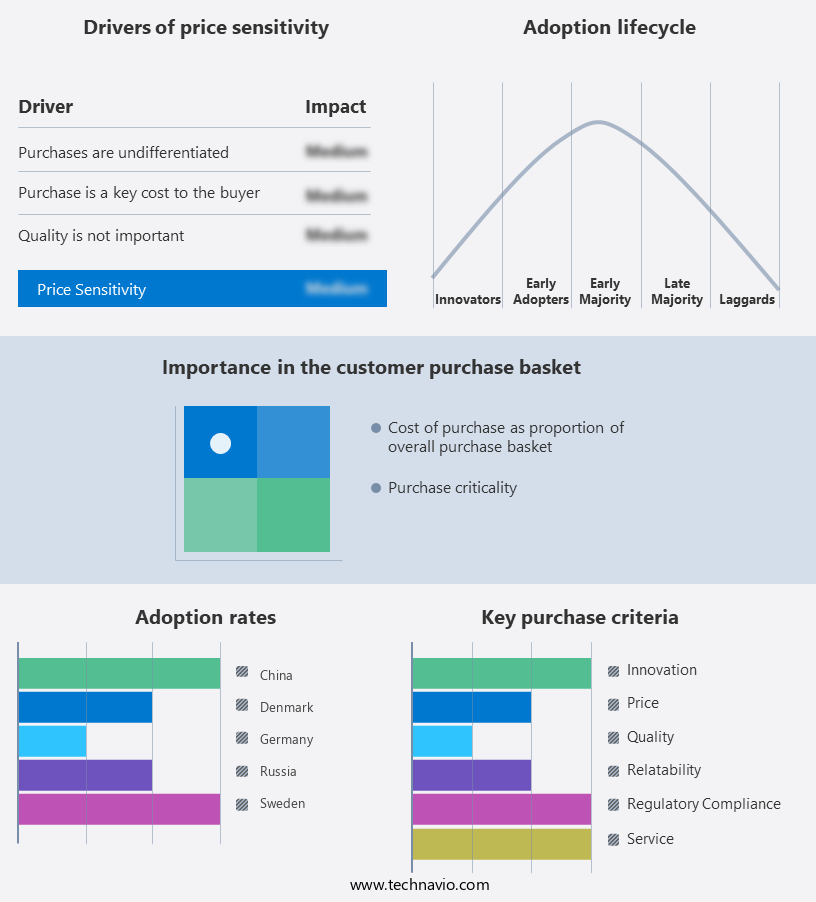
The heat network market forecasting report includes the adoption lifecycle of the market, covering from the innovator's stage to the laggard's stage. It focuses on adoption rates in different regions based on penetration. Furthermore, the heat network market report also includes key purchase criteria and drivers of price sensitivity to help companies evaluate and develop their market growth analysis strategies.
Customer Landscape
Key Companies & Market Insights
Companies are implementing various strategies, such as strategic alliances, heat network market forecast, partnerships, mergers and acquisitions, geographical expansion, and product/service launches, to enhance their presence In the industry.
The industry research and growth report includes detailed analyses of the competitive landscape of the market and information about key companies, including:
- Alfa Laval AB
- BRUGG Rohrsystem AG
- Danfoss AS
- E.ON UK Plc
- ENGIE SA
- Fortum Oyj
- FVB Energy Inc
- Helen Ltd.
- LOGSTOR Denmark Holding ApS
- Ramboll Group AS
- REHAU Ltd.
- Rendesco Ltd
- Statkraft AS
- STEAG GmbH
- Thermaflex
- Uniper SE
- Uponor Corp.
- Vattenfall UK
- Veolia Environnement SA
- Viessmann Werke GmbH and Co. KG
Qualitative and quantitative analysis of companies has been conducted to help clients understand the wider business environment as well as the strengths and weaknesses of key industry players. Data is qualitatively analyzed to categorize companies as pure play, category-focused, industry-focused, and diversified; it is quantitatively analyzed to categorize companies as dominant, leading, strong, tentative, and weak.
Research Analyst Overview
Heat networks, also known as district heating systems, have emerged as a critical component of the global energy landscape. These systems provide centralized heating and hot water solutions to residential, commercial, and industrial sectors, offering numerous benefits such as energy efficiency, reduced greenhouse gas emissions, and improved air quality. The market for heat networks is driven by various factors. Energy costs, a primary concern for consumers and businesses, continue to rise, making energy-efficient solutions increasingly attractive. The need to reduce carbon emissions and mitigate climate change goals is another significant factor.
Moreover, renewable energy sources, such as geothermal and solar thermal, have gained significant traction as heat sources, contributing to the decarbonization of heat production. Advanced control systems and data analytics play a crucial role in optimizing heat network performance. Sensors and controls enable real-time monitoring and adjustment of system parameters, ensuring energy efficiency and minimizing energy losses. Renewable energy adoption in heat networks is on the rise, with hybrid systems combining fossil fuels and waste heat recovery becoming increasingly popular. Heat networks can be configured as open or closed loops, depending on the specific requirements of the application. Centralized heating systems, such as boiler plants, provide heat to a large number of consumers, while community heating systems serve smaller, localized areas.
Furthermore, microgrids, which can operate independently from the main power grid, offer enhanced energy security and resilience. The transition to renewable energy sources in heat networks presents both opportunities and challenges. Biomass, a renewable energy source, can be densified for use in heat production. However, the integration of renewable energy into existing heat networks requires careful planning and management to ensure energy density and system compatibility. Renewable energy sources, such as solar thermal and wind, offer significant potential for heat generation. Solar thermal systems use the sun's energy to produce hot water or steam, while wind energy can be used to generate electricity, which can then be converted into heat.
|
Heat Network Market Scope |
|
|
Report Coverage |
Details |
|
Page number |
201 |
|
Base year |
2023 |
|
Historic period |
2018-2022 |
|
Forecast period |
2024-2028 |
|
Growth momentum & CAGR |
Accelerate at a CAGR of 4.4% |
|
Market Growth 2024-2028 |
USD 23.39 billion |
|
Market structure |
Fragmented |
|
YoY growth 2023-2024(%) |
3.0 |
|
Key countries |
Denmark, Russia, China, Sweden, Germany, Poland, Japan, UK, US, and South Korea |
|
Competitive landscape |
Leading Companies, Market Positioning of Companies, Competitive Strategies, and Industry Risks |
What are the Key Data Covered in this Heat Network Market Research and Growth Report?
- CAGR of the Heat Network industry during the forecast period
- Detailed information on factors that will drive the Heat Network growth and forecasting between 2024 and 2028
- Precise estimation of the size of the market and its contribution of the industry in focus to the parent market
- Accurate predictions about upcoming growth and trends and changes in consumer behaviour
- Growth of the market across Europe, APAC, North America, South America, and Middle East and Africa
- Thorough analysis of the market's competitive landscape and detailed information about companies
- Comprehensive analysis of factors that will challenge the heat network market growth of industry companies
We can help! Our analysts can customize this heat network market research report to meet your requirements.
 RIA -
RIA - 
