District Heating Market Analysis Europe, APAC, North America, South America, Middle East and Africa - Denmark, Russia, China, Sweden, Germany, Poland, UK, Japan, US, South Korea - Size and Forecast 2024-2028

District Heating Market Analysis Europe, APAC, North America, South America, Middle East and Africa - Denmark, Russia, China, Sweden, Germany, Poland, UK, Japan, US, South Korea - Size and Forecast 2024-2028

Published: Oct 2024 205 Pages SKU: IRTNTR44491

Market Overview at a Glance

$49.5 B
Market Opportunity
4.8%
CAGR
3.5
YoY growth 2023-2024(%)

District Heating Market Size and Trends

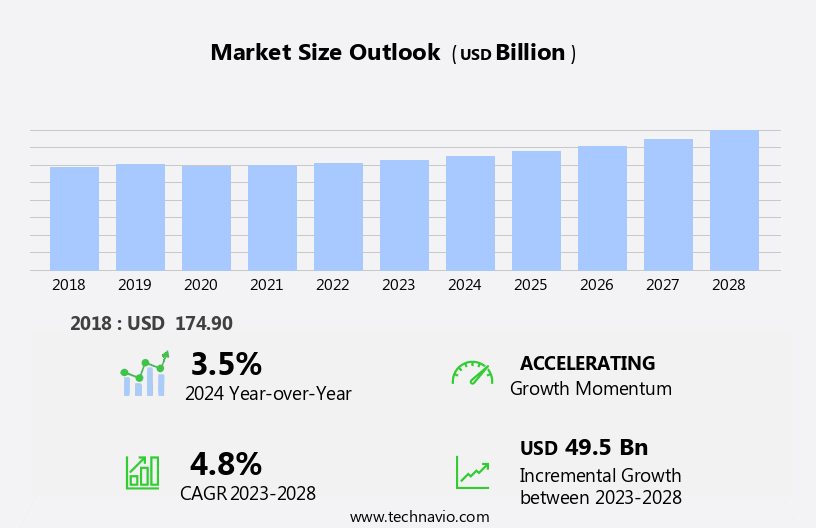
The district heating market size is forecast to increase by USD 49.5 billion at a CAGR of 4.8% between 2023 and 2028. The market is witnessing significant growth due to decarbonization goals and government initiatives to promote sustainable energy solutions. Energy management and smart grids are becoming essential components of district heating systems, enabling efficient energy distribution and demand response. Waste heat recovery is another trend gaining traction, as it offers an opportunity to reduce energy consumption and costs. Waste heat recovery, when combined with smart sensors, can be improved at the central plants. However, technical and economic barriers persist, including high upfront costs and complex retrofitting processes. Space heating applications are a major market for district heating, providing cost-effective and environmentally friendly alternatives to traditional heating methods. Irregularities in the pricing of district heating networks remain a challenge, necessitating regulatory intervention to ensure fair and transparent pricing structures.

Market Overview

District Heating Market Size

 Request Free Sample

The market is witnessing significant growth due to the increasing adoption of renewable sources and sustainable energy practices. The shift towards sustainable energy is driven by the need to reduce carbon footprints and mitigate climate change. Renewable sources, such as biomass, geothermal, and solar, are gaining popularity in district heating systems. Biomass, derived from organic materials, is a carbon-neutral fuel source that can be used to generate heat. The integration of Internet of Things (IoT) technologies in combined heat and power (CHP) systems within new-generation district heating plants enhances the efficiency of district energy system by enabling smarter management and recycling of waste energies in the power sector. However, the implementation of district heating systems faces regulatory and permitting hurdles. Infrastructure development and the installation of central heat plants, district heat networks, insulated pipes, boilers, and heat pumps require extensive permitting processes and adherence to strict regulations. Despite these challenges, the market is expected to grow significantly in the coming years.

Furthermore, the adoption of decentralized heating systems and the recycling of waste energies are also contributing to the market's growth. Space heating applications, both residential and industrial, are the primary consumers of district heating systems. For instance, high-capacity chillers or boilers can perform more efficiently when placed at centralized locations. These systems provide efficient and cost-effective heating solutions, making them a popular choice for consumers. The use of renewable energy sources, efficient heat production, and the recycling of waste energies are key drivers of growth in the market.

Market Segmentation

The market research report provides comprehensive data (region-wise segment analysis), with forecasts and estimates in "USD billion" for the period 2024-2028, as well as historical data from 2018 - 2022 for the following segments.
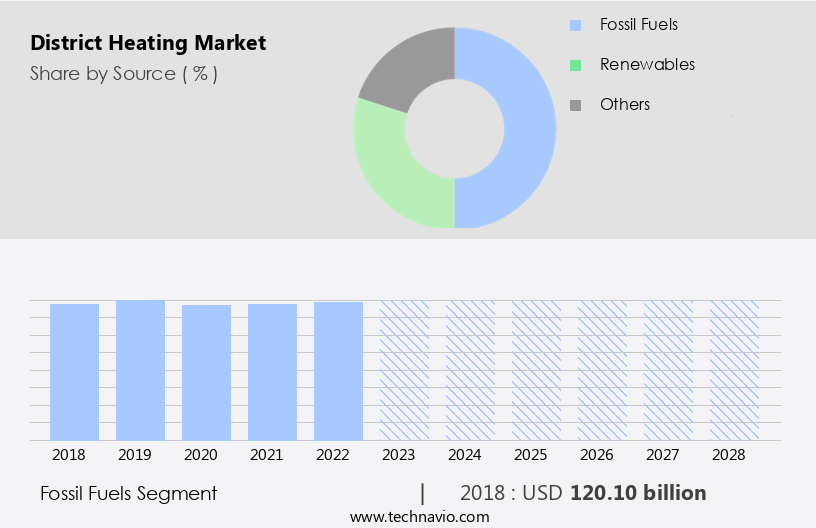
  • Source
    • Fossil fuels
    • Renewables
    • Others
  • End-user
    • Residential
    • Commercial
    • Industrial
  • Geography
    • Europe
      • Germany
      • UK
      • Sweden
      • Denmark
    • APAC
      • China
      • Japan
      • South Korea
    • North America
      • US
    • South America
    • Middle East and Africa

By Source Insights

The market share growth by the fossil fuels segment will be significant during the forecast period. District heating networks offer an efficient and economical means of supplying low-carbon heat to residential areas on a large scale. This heavy reliance on non-renewable energy sources poses a significant hurdle for the shift towards more sustainable heating solutions

District Heating Market Size

Get a glance at the market share of various segments Download the PDF Sample

The fossil fuels segment was the largest segment and was valued at USD 120.10 billion in 2018. In colder countries, there is a growing push to replace traditional fossil fuel heating sources, such as oil and gas, with renewable energy alternatives to minimize greenhouse gas emissions from district energy systems. However, the demand for fossil fuel-based heat is predicted to persist and increase in the coming years due to population growth. Central heat plants, which are responsible for heat production in district energy systems, can be upgraded to use insulated pipes and renewable energy sources like biomass, geothermal, or solar energy to reduce reliance on fossil fuels. Boilers, a common heat production technology in district heating systems, can also be retrofitted with advanced technologies to improve efficiency and reduce emissions. 

Regional Analysis

District Heating Market Share by Geography

For more insights on the market share of various regions Download PDF Sample now!

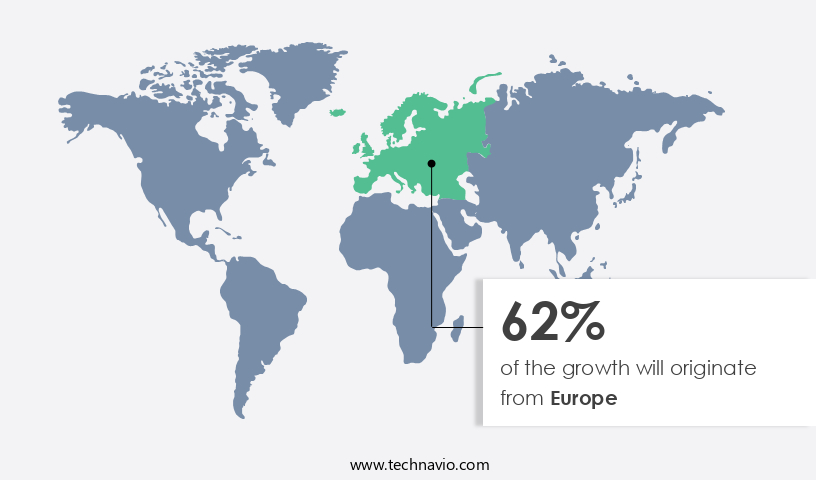
Europe is estimated to contribute 62% to the growth of the global market during the forecast period. Technavio's analysts have elaborately explained the regional trends and drivers that shape the market during the forecast period. The market is witnessing notable progress, fueled by advanced technologies and substantial investments in sustainable infrastructure. This intelligent algorithm uses spatial machine learning to assist landowners, energy firms, developers, and authorities in identifying optimal routes for district heating and cooling networks. By analyzing local data, District One generates efficient designs, expediting the planning and installation process for citywide systems. This technology determines the most suitable locations for heating network installation, thereby enhancing the performance and productivity of district energy systems.

Our researchers analyzed the data with 2023 as the base year, along with the key drivers, trends, and challenges. A holistic analysis of drivers will help companies refine their marketing strategies to gain a competitive advantage.

District Heating Market Driver

Decarbonization goals is notably driving market growth. The market is witnessing significant growth due to the increasing focus on energy management and decarbonization. With the integration of smart grids and waste heat recovery, district heating systems are becoming more efficient and sustainable. However, there are both technical and economic barriers to the widespread adoption of district heating, particularly in retrofitting existing buildings. In October 2024, Veolia, a leading energy solutions provider, announced the construction of a new district heating network in London.

Furthermore, this network will utilize low-carbon heat generated from the SELCHP Energy Recovery Facility (ERF), which processes non-recyclable waste. The project aims to supply heat to approximately 5,000 homes, including schools and social housing units. Veolia will oversee the entire project, from design and construction to commissioning and operation. Once operational, the network is expected to deliver heat with a renewable content of around 60%, thanks to the biogenic component of the treated waste. This initiative is a significant step towards reducing carbon emissions and enhancing sustainability in the built environment. Thus, such factors are driving the growth of the market during the forecast period.

District Heating Market Trends

Government initiatives to promote district heating projects is the key trend in the market. The market is witnessing notable expansion due to increasing government initiatives aimed at promoting energy efficiency and sustainability. This funding, which covers approximately 40% of the project's estimated USD1 billion cost, underscores the government's dedication to advancing renewable energy solutions. In the UK, the Heat Network Efficiency Scheme (HNES) continues to play a crucial role in enhancing district heating systems.

Furthermore, energy management, a key aspect of district heating, is being addressed through the implementation of smart grids and waste heat recovery systems. However, technical and economic barriers hinder the widespread adoption of district heating, particularly in retrofitting existing buildings. Despite these challenges, the market's potential for space heating applications makes it an attractive proposition for energy providers and consumers alike. Thus, such trends will shape the growth of the market during the forecast period.

District Heating Market Challenge

Irregularities in pricing of district heating networks is the major challenge that affects the growth of the market. The district heating market encounters substantial challenges due to pricing inconsistencies, which can significantly affect consumer affordability and the viability of new projects.  This substantial increase in tariffs has sparked affordability concerns among residents, straining their living expenses. Energy management and cost-effectiveness are crucial factors in the implementation of district heating systems.

Furthermore, smart grids and waste heat recovery can mitigate these challenges by optimizing energy usage and reducing reliance on traditional energy sources. However, technical and economic barriers hinder the retrofitting of existing buildings with district heating systems. Addressing these obstacles through government incentives and technological advancements is essential to expand the market's growth potential in space heating applications. Hence, the above factors will impede the growth of the market during the forecast period

Exclusive Customer Landscape

The market forecasting report includes the adoption lifecycle of the market, covering from the innovator's stage to the laggard's stage. It focuses on adoption rates in different regions based on penetration. Furthermore, the report also includes key purchase criteria and drivers of price sensitivity to help companies evaluate and develop their market growth analysis strategies.

District Heating Market Share by Geography

 Customer Landscape

Key Companies & Market Insights

Companies are implementing various strategies, such as strategic alliances, partnerships, mergers and acquisitions, geographical expansion, and product/service launches, to enhance their presence in the market.

Alfa Laval AB - The company offers district heating distribution technology that connects users to a variety of heating sources, including renewable or recycled energy.

The market research and growth report also includes detailed analyses of the competitive landscape of the market and information about key companies, including:

  • BRUGG Rohrsystem AG
  • Danfoss AS
  • E.ON UK Plc
  • ENGIE SA
  • Fortum Oyj
  • FVB Energy Inc
  • Helen Ltd.
  • LOGSTOR Denmark Holding ApS
  • Ramboll Group AS
  • REHAU Ltd.
  • Statkraft AS
  • STEAG GmbH
  • Thermaflex
  • Uniper SE
  • Uponor Corp.
  • Vattenfall UK
  • Veolia Environnement SA
  • Viessmann Werke GmbH and Co. KG
  • Vital Energi Ltd.

Qualitative and quantitative analysis of companies has been conducted to help clients understand the wider business environment as well as the strengths and weaknesses of key market players. Data is qualitatively analyzed to categorize companies as pure play, category-focused, industry-focused, and diversified; it is quantitatively analyzed to categorize companies as dominant, leading, strong, tentative, and weak.

Market Analyst Overview

The district heating market is witnessing significant growth due to the increasing adoption of renewable sources for sustainable energy practices. Biomass, geothermal, solar, and other renewable energy sources are increasingly being used for heat production in central heat plants and district heat networks. The shift towards renewable energy is driven by the need to reduce carbon footprints and mitigate climate change. However, the district heating market faces regulatory and permitting hurdles, which can hinder its growth. Infrastructure development and technical barriers are also challenges that need to be addressed. Smart meters, sensors, real-time monitoring, load balancing, data analytics, energy management, and smart grids are being employed to optimize district heating systems and reduce economic barriers.

Furthermore, waste heat recovery from industrial processes and decentralized heating systems are emerging trends in the market. Radiant heat and low-temperature supplies are gaining popularity in residential applications. The use of non-renewable heat sources, such as fossil fuels, is decreasing as climate goals are being met through the recycling of waste energies. District heating systems are being retrofitted with boilers, heat pumps, and insulated pipes to improve efficiency and reduce greenhouse emissions. Demand-based heating systems and home automation are also being integrated into district energy systems to enhance user experience and optimize energy usage.

Market Scope

Report Coverage

Details

Page number

205

Base year

2023

Historic period

2018 - 2022

Forecast period

2024-2028

Growth momentum & CAGR

Accelerate at a CAGR of 4.8%

Market growth 2024-2028

USD 49.5 billion

Market structure

Fragmented

YoY growth 2023-2024(%)

3.5

Regional analysis

Europe, APAC, North America, South America, and Middle East and Africa

Performing market contribution

Europe at 62%

Key countries

Denmark, Russia, China, Sweden, Germany, Poland, UK, Japan, US, and South Korea

Competitive landscape

Leading Companies, Market Positioning of Companies, Competitive Strategies, and Industry Risks

Key companies profiled

Alfa Laval AB, BRUGG Rohrsystem AG, Danfoss AS, E.ON UK Plc, ENGIE SA, Fortum Oyj, FVB Energy Inc, Helen Ltd., LOGSTOR Denmark Holding ApS, Ramboll Group AS, REHAU Ltd., Statkraft AS, STEAG GmbH, Thermaflex, Uniper SE, Uponor Corp., Vattenfall UK, Veolia Environnement SA, Viessmann Werke GmbH and Co. KG, and Vital Energi Ltd.

Market dynamics

Parent market analysis, Market growth inducers and obstacles, Fast-growing and slow-growing segment analysis, COVID-19 impact and recovery analysis and future consumer dynamics, Market condition analysis for market forecast period

Customization purview

If our report has not included the data that you are looking for, you can reach out to our analysts and get segments customized.

Download PDF Sample

What are the Key Data Covered in this Market Report?

  • CAGR of the market during the forecast period
  • Detailed information on factors that will drive the market growth and forecasting between 2024 and 2028
  • Precise estimation of the size of the market  and its contribution of the market in focus to the parent market
  • Accurate predictions about upcoming market growth and trends and changes in consumer behaviour
  • Growth of the market across Europe, APAC, North America, South America, and Middle East and Africa
  • Thorough analysis of the market's competitive landscape and detailed information about companies
  • Comprehensive analysis of factors that will challenge the growth of market companies

We can help! Our analysts can customize this market research report to meet your requirements. Get in touch

1 Executive Summary

  • 1.1 Market overview
    • Executive Summary - Chart on Market Overview
    • Executive Summary - Data Table on Market Overview
    • Executive Summary - Chart on Global Market Characteristics
    • Executive Summary - Chart on Market by Geography
    • Executive Summary - Chart on Market Segmentation by Source
    • Executive Summary - Chart on Market Segmentation by End-user
    • Executive Summary - Chart on Incremental Growth
    • Executive Summary - Data Table on Incremental Growth
    • Executive Summary - Chart on Company Market Positioning

2 Technavio Analysis

  • 2.1 Analysis of price sensitivity, lifecycle, customer purchase basket, adoption rates, and purchase criteria
    • Analysis of price sensitivity, lifecycle, customer purchase basket, adoption rates, and purchase criteria
  • 2.2 Criticality of inputs and Factors of differentiation
    • Overview on criticality of inputs and factors of differentiation
  • 2.3 Factors of disruption
    • Overview on factors of disruption
  • 2.4 Impact of drivers and challenges
    • Impact of drivers and challenges in 2023 and 2028

3 Market Landscape

  • 3.1 Market ecosystem
    • Parent Market
    • Data Table on - Parent Market
  • 3.2 Market characteristics
    • Market characteristics analysis
  • 3.3 Value chain analysis
    • Value Chain Analysis

4 Market Sizing

  • 4.1 Market definition
    • Offerings of companies included in the market definition
  • 4.2 Market segment analysis
    • Market segments
  • 4.3 Market size 2023
    • 4.4 Market outlook: Forecast for 2023-2028
      • Chart on Global - Market size and forecast 2023-2028 ($ billion)
      • Data Table on Global - Market size and forecast 2023-2028 ($ billion)
      • Chart on Global Market: Year-over-year growth 2023-2028 (%)
      • Data Table on Global Market: Year-over-year growth 2023-2028 (%)

    5 Historic Market Size

    • 5.1 Global District Heating Market 2018 - 2022
      • Historic Market Size - Data Table on Global District Heating Market 2018 - 2022 ($ billion)
    • 5.2 Source segment analysis 2018 - 2022
      • Historic Market Size - Source Segment 2018 - 2022 ($ billion)
    • 5.3 End-user segment analysis 2018 - 2022
      • Historic Market Size - End-user Segment 2018 - 2022 ($ billion)
    • 5.4 Geography segment analysis 2018 - 2022
      • Historic Market Size - Geography Segment 2018 - 2022 ($ billion)
    • 5.5 Country segment analysis 2018 - 2022
      • Historic Market Size - Country Segment 2018 - 2022 ($ billion)

    6 Qualitative Analysis

    • 6.1 Impact of Artificial Intelligence (AI) on global district heating market

      7 Five Forces Analysis

      • 7.1 Five forces summary
        • Five forces analysis - Comparison between 2023 and 2028
      • 7.2 Bargaining power of buyers
        • Bargaining power of buyers - Impact of key factors 2023 and 2028
      • 7.3 Bargaining power of suppliers
        • Bargaining power of suppliers - Impact of key factors in 2023 and 2028
      • 7.4 Threat of new entrants
        • Threat of new entrants - Impact of key factors in 2023 and 2028
      • 7.5 Threat of substitutes
        • Threat of substitutes - Impact of key factors in 2023 and 2028
      • 7.6 Threat of rivalry
        • Threat of rivalry - Impact of key factors in 2023 and 2028
      • 7.7 Market condition
        • Chart on Market condition - Five forces 2023 and 2028

      8 Market Segmentation by Source

      • 8.1 Market segments
        • Chart on Source - Market share 2023-2028 (%)
        • Data Table on Source - Market share 2023-2028 (%)
      • 8.2 Comparison by Source
        • Chart on Comparison by Source
        • Data Table on Comparison by Source
      • 8.3 Fossil fuels - Market size and forecast 2023-2028
        • Chart on Fossil fuels - Market size and forecast 2023-2028 ($ billion)
        • Data Table on Fossil fuels - Market size and forecast 2023-2028 ($ billion)
        • Chart on Fossil fuels - Year-over-year growth 2023-2028 (%)
        • Data Table on Fossil fuels - Year-over-year growth 2023-2028 (%)
      • 8.4 Renewables - Market size and forecast 2023-2028
        • Chart on Renewables - Market size and forecast 2023-2028 ($ billion)
        • Data Table on Renewables - Market size and forecast 2023-2028 ($ billion)
        • Chart on Renewables - Year-over-year growth 2023-2028 (%)
        • Data Table on Renewables - Year-over-year growth 2023-2028 (%)
      • 8.5 Others - Market size and forecast 2023-2028
        • Chart on Others - Market size and forecast 2023-2028 ($ billion)
        • Data Table on Others - Market size and forecast 2023-2028 ($ billion)
        • Chart on Others - Year-over-year growth 2023-2028 (%)
        • Data Table on Others - Year-over-year growth 2023-2028 (%)
      • 8.6 Market opportunity by Source
        • Market opportunity by Source ($ billion)
        • Data Table on Market opportunity by Source ($ billion)

      9 Market Segmentation by End-user

      • 9.1 Market segments
        • Chart on End-user - Market share 2023-2028 (%)
        • Data Table on End-user - Market share 2023-2028 (%)
      • 9.2 Comparison by End-user
        • Chart on Comparison by End-user
        • Data Table on Comparison by End-user
      • 9.3 Residential - Market size and forecast 2023-2028
        • Chart on Residential - Market size and forecast 2023-2028 ($ billion)
        • Data Table on Residential - Market size and forecast 2023-2028 ($ billion)
        • Chart on Residential - Year-over-year growth 2023-2028 (%)
        • Data Table on Residential - Year-over-year growth 2023-2028 (%)
      • 9.4 Commercial - Market size and forecast 2023-2028
        • Chart on Commercial - Market size and forecast 2023-2028 ($ billion)
        • Data Table on Commercial - Market size and forecast 2023-2028 ($ billion)
        • Chart on Commercial - Year-over-year growth 2023-2028 (%)
        • Data Table on Commercial - Year-over-year growth 2023-2028 (%)
      • 9.5 Industrial - Market size and forecast 2023-2028
        • Chart on Industrial - Market size and forecast 2023-2028 ($ billion)
        • Data Table on Industrial - Market size and forecast 2023-2028 ($ billion)
        • Chart on Industrial - Year-over-year growth 2023-2028 (%)
        • Data Table on Industrial - Year-over-year growth 2023-2028 (%)
      • 9.6 Market opportunity by End-user
        • Market opportunity by End-user ($ billion)
        • Data Table on Market opportunity by End-user ($ billion)

      10 Customer Landscape

      • 10.1 Customer landscape overview
        • Analysis of price sensitivity, lifecycle, customer purchase basket, adoption rates, and purchase criteria

      11 Geographic Landscape

      • 11.1 Geographic segmentation
        • Chart on Market share by geography 2023-2028 (%)
        • Data Table on Market share by geography 2023-2028 (%)
      • 11.2 Geographic comparison
        • Chart on Geographic comparison
        • Data Table on Geographic comparison
      • 11.3 Europe - Market size and forecast 2023-2028
        • Chart on Europe - Market size and forecast 2023-2028 ($ billion)
        • Data Table on Europe - Market size and forecast 2023-2028 ($ billion)
        • Chart on Europe - Year-over-year growth 2023-2028 (%)
        • Data Table on Europe - Year-over-year growth 2023-2028 (%)
      • 11.4 APAC - Market size and forecast 2023-2028
        • Chart on APAC - Market size and forecast 2023-2028 ($ billion)
        • Data Table on APAC - Market size and forecast 2023-2028 ($ billion)
        • Chart on APAC - Year-over-year growth 2023-2028 (%)
        • Data Table on APAC - Year-over-year growth 2023-2028 (%)
      • 11.5 North America - Market size and forecast 2023-2028
        • Chart on North America - Market size and forecast 2023-2028 ($ billion)
        • Data Table on North America - Market size and forecast 2023-2028 ($ billion)
        • Chart on North America - Year-over-year growth 2023-2028 (%)
        • Data Table on North America - Year-over-year growth 2023-2028 (%)
      • 11.6 South America - Market size and forecast 2023-2028
        • Chart on South America - Market size and forecast 2023-2028 ($ billion)
        • Data Table on South America - Market size and forecast 2023-2028 ($ billion)
        • Chart on South America - Year-over-year growth 2023-2028 (%)
        • Data Table on South America - Year-over-year growth 2023-2028 (%)
      • 11.7 Middle East and Africa - Market size and forecast 2023-2028
        • Chart on Middle East and Africa - Market size and forecast 2023-2028 ($ billion)
        • Data Table on Middle East and Africa - Market size and forecast 2023-2028 ($ billion)
        • Chart on Middle East and Africa - Year-over-year growth 2023-2028 (%)
        • Data Table on Middle East and Africa - Year-over-year growth 2023-2028 (%)
      • 11.8 Denmark - Market size and forecast 2023-2028
        • Chart on Denmark - Market size and forecast 2023-2028 ($ billion)
        • Data Table on Denmark - Market size and forecast 2023-2028 ($ billion)
        • Chart on Denmark - Year-over-year growth 2023-2028 (%)
        • Data Table on Denmark - Year-over-year growth 2023-2028 (%)
      • 11.9 Russia - Market size and forecast 2023-2028
        • Chart on Russia - Market size and forecast 2023-2028 ($ billion)
        • Data Table on Russia - Market size and forecast 2023-2028 ($ billion)
        • Chart on Russia - Year-over-year growth 2023-2028 (%)
        • Data Table on Russia - Year-over-year growth 2023-2028 (%)
      • 11.10 China - Market size and forecast 2023-2028
        • Chart on China - Market size and forecast 2023-2028 ($ billion)
        • Data Table on China - Market size and forecast 2023-2028 ($ billion)
        • Chart on China - Year-over-year growth 2023-2028 (%)
        • Data Table on China - Year-over-year growth 2023-2028 (%)
      • 11.11 Sweden - Market size and forecast 2023-2028
        • Chart on Sweden - Market size and forecast 2023-2028 ($ billion)
        • Data Table on Sweden - Market size and forecast 2023-2028 ($ billion)
        • Chart on Sweden - Year-over-year growth 2023-2028 (%)
        • Data Table on Sweden - Year-over-year growth 2023-2028 (%)
      • 11.12 Germany - Market size and forecast 2023-2028
        • Chart on Germany - Market size and forecast 2023-2028 ($ billion)
        • Data Table on Germany - Market size and forecast 2023-2028 ($ billion)
        • Chart on Germany - Year-over-year growth 2023-2028 (%)
        • Data Table on Germany - Year-over-year growth 2023-2028 (%)
      • 11.13 Poland - Market size and forecast 2023-2028
        • Chart on Poland - Market size and forecast 2023-2028 ($ billion)
        • Data Table on Poland - Market size and forecast 2023-2028 ($ billion)
        • Chart on Poland - Year-over-year growth 2023-2028 (%)
        • Data Table on Poland - Year-over-year growth 2023-2028 (%)
      • 11.14 UK - Market size and forecast 2023-2028
        • Chart on UK - Market size and forecast 2023-2028 ($ billion)
        • Data Table on UK - Market size and forecast 2023-2028 ($ billion)
        • Chart on UK - Year-over-year growth 2023-2028 (%)
        • Data Table on UK - Year-over-year growth 2023-2028 (%)
      • 11.15 Japan - Market size and forecast 2023-2028
        • Chart on Japan - Market size and forecast 2023-2028 ($ billion)
        • Data Table on Japan - Market size and forecast 2023-2028 ($ billion)
        • Chart on Japan - Year-over-year growth 2023-2028 (%)
        • Data Table on Japan - Year-over-year growth 2023-2028 (%)
      • 11.16 US - Market size and forecast 2023-2028
        • Chart on US - Market size and forecast 2023-2028 ($ billion)
        • Data Table on US - Market size and forecast 2023-2028 ($ billion)
        • Chart on US - Year-over-year growth 2023-2028 (%)
        • Data Table on US - Year-over-year growth 2023-2028 (%)
      • 11.17 South Korea - Market size and forecast 2023-2028
        • Chart on South Korea - Market size and forecast 2023-2028 ($ billion)
        • Data Table on South Korea - Market size and forecast 2023-2028 ($ billion)
        • Chart on South Korea - Year-over-year growth 2023-2028 (%)
        • Data Table on South Korea - Year-over-year growth 2023-2028 (%)
      • 11.18 Market opportunity by geography
        • Market opportunity by geography ($ billion)
        • Data Tables on Market opportunity by geography ($ billion)

      12 Drivers, Challenges, and Opportunity/Restraints

      • 12.1 Market drivers
        • 12.2 Market challenges
          • 12.3 Impact of drivers and challenges
            • Impact of drivers and challenges in 2023 and 2028
          • 12.4 Market opportunities/restraints

            13 Competitive Landscape

            • 13.1 Overview
              • 13.2 Competitive Landscape
                • Overview on criticality of inputs and factors of differentiation
              • 13.3 Landscape disruption
                • Overview on factors of disruption
              • 13.4 Industry risks
                • Impact of key risks on business

              14 Competitive Analysis

              • 14.1 Companies profiled
                • Companies covered
              • 14.2 Company ranking index
                • Company ranking index
              • 14.3 Market positioning of companies
                • Matrix on companies position and classification
              • 14.4 Alfa Laval AB
                • Alfa Laval AB - Overview
                • Alfa Laval AB - Business segments
                • Alfa Laval AB - Key news
                • Alfa Laval AB - Key offerings
                • Alfa Laval AB - Segment focus
                • SWOT
              • 14.5 Danfoss AS
                • Danfoss AS - Overview
                • Danfoss AS - Product / Service
                • Danfoss AS - Key offerings
                • SWOT
              • 14.6 E.ON UK Plc
                • E.ON UK Plc - Overview
                • E.ON UK Plc - Product / Service
                • E.ON UK Plc - Key offerings
                • SWOT
              • 14.7 Fortum Oyj
                • Fortum Oyj - Overview
                • Fortum Oyj - Business segments
                • Fortum Oyj - Key news
                • Fortum Oyj - Key offerings
                • Fortum Oyj - Segment focus
                • SWOT
              • 14.8 LOGSTOR Denmark Holding ApS
                • LOGSTOR Denmark Holding ApS - Overview
                • LOGSTOR Denmark Holding ApS - Product / Service
                • LOGSTOR Denmark Holding ApS - Key offerings
                • SWOT
              • 14.9 Ramboll Group AS
                • Ramboll Group AS - Overview
                • Ramboll Group AS - Product / Service
                • Ramboll Group AS - Key offerings
                • SWOT
              • 14.10 REHAU Ltd.
                • REHAU Ltd. - Overview
                • REHAU Ltd. - Product / Service
                • REHAU Ltd. - Key offerings
                • SWOT
              • 14.11 Statkraft AS
                • Statkraft AS - Overview
                • Statkraft AS - Product / Service
                • Statkraft AS - Key offerings
                • SWOT
              • 14.12 STEAG GmbH
                • STEAG GmbH - Overview
                • STEAG GmbH - Product / Service
                • STEAG GmbH - Key offerings
                • SWOT
              • 14.13 Thermaflex
                • Thermaflex - Overview
                • Thermaflex - Product / Service
                • Thermaflex - Key offerings
                • SWOT
              • 14.14 Uniper SE
                • Uniper SE - Overview
                • Uniper SE - Business segments
                • Uniper SE - Key offerings
                • Uniper SE - Segment focus
                • SWOT
              • 14.15 Uponor Corp.
                • Uponor Corp. - Overview
                • Uponor Corp. - Business segments
                • Uponor Corp. - Key offerings
                • Uponor Corp. - Segment focus
                • SWOT
              • 14.16 Vattenfall UK
                • Vattenfall UK - Overview
                • Vattenfall UK - Product / Service
                • Vattenfall UK - Key offerings
                • SWOT
              • 14.17 Veolia Environnement SA
                • Veolia Environnement SA - Overview
                • Veolia Environnement SA - Business segments
                • Veolia Environnement SA - Key news
                • Veolia Environnement SA - Key offerings
                • Veolia Environnement SA - Segment focus
                • SWOT
              • 14.18 Viessmann Werke GmbH and Co. KG
                • Viessmann Werke GmbH and Co. KG - Overview
                • Viessmann Werke GmbH and Co. KG - Product / Service
                • Viessmann Werke GmbH and Co. KG - Key offerings
                • SWOT

              15 Appendix

              • 15.1 Scope of the report
                • 15.2 Inclusions and exclusions checklist
                  • Inclusions checklist
                  • Exclusions checklist
                • 15.3 Currency conversion rates for US$
                  • Currency conversion rates for US$
                • 15.4 Research methodology
                  • Research methodology
                • 15.5 Data procurement
                  • Information sources
                • 15.6 Data validation
                  • Data validation
                • 15.7 Validation techniques employed for market sizing
                  • Validation techniques employed for market sizing
                • 15.8 Data synthesis
                  • Data synthesis
                • 15.9 360 degree market analysis
                  • 360 degree market analysis
                • 15.10 List of abbreviations
                  • List of abbreviations

                Research Methodology

                Technavio presents a detailed picture of the market by way of study, synthesis, and summation of data from multiple sources. The analysts have presented the various facets of the market with a particular focus on identifying the key industry influencers. The data thus presented is comprehensive, reliable, and the result of extensive research, both primary and secondary.

                INFORMATION SOURCES

                Primary sources

                • Manufacturers and suppliers
                • Channel partners
                • Industry experts
                • Strategic decision makers

                Secondary sources

                • Industry journals and periodicals
                • Government data
                • Financial reports of key industry players
                • Historical data
                • Press releases

                DATA ANALYSIS

                Data Synthesis

                • Collation of data
                • Estimation of key figures
                • Analysis of derived insights

                Data Validation

                • Triangulation with data models
                • Reference against proprietary databases
                • Corroboration with industry experts

                REPORT WRITING

                Qualitative

                • Market drivers
                • Market challenges
                • Market trends
                • Five forces analysis

                Quantitative

                • Market size and forecast
                • Market segmentation
                • Geographical insights
                • Competitive landscape

                Interested in this report?

                Get your sample now to see our research methodology and insights!

                Download Now

                Frequently Asked Questions

                District Heating market growth will increase by $ 49.5 bn during 2024-2028.

                The District Heating market is expected to grow at a CAGR of 4.8% during 2024-2028.

                District Heating market is segmented by Source( Fossil fuels, Renewables, Others) End-user( Residential, Commercial, Industrial, MEA, South America)

                Alfa Laval AB, BRUGG Rohrsystem AG, Danfoss AS, E.ON UK Plc, ENGIE SA, Fortum Oyj, FVB Energy Inc, Helen Ltd., LOGSTOR Denmark Holding ApS, Ramboll Group AS, REHAU Ltd., Statkraft AS, STEAG GmbH, Thermaflex, Uniper SE, Uponor Corp., Vattenfall UK, Veolia Environnement SA, Viessmann Werke GmbH and Co. KG, Vital Energi Ltd. are a few of the key vendors in the District Heating market.

                Europe will register the highest growth rate of 62% among the other regions. Therefore, the District Heating market in Europe is expected to garner significant business opportunities for the vendors during the forecast period.

                Denmark, Russia, China, Sweden, Germany, Poland, UK, Japan, US, South Korea

                • Decarbonization goalsThe global district heating market is increasingly driven by ambitious decarbonization goals is the driving factor this market.
                • with significant projects and partnerships emerging to reduce carbon emissions and enhance sustainability. In October 2024 is the driving factor this market.
                • Veolia is the driving factor this market.
                • a leader in local decarbonizing energy solutions in Europe is the driving factor this market.
                • announced the construction of a new district heating network in London. This network will utilize 75 GWh per year of low-carbon heat generated from the SELCHP Energy Recovery Facility (ERF) is the driving factor this market.
                • which processes non-recyclable waste. The project aims to supply heat to nearly 5 is the driving factor this market.
                • 000 homes is the driving factor this market.
                • including 11 social housing units and schools. Veolia will oversee the design is the driving factor this market.
                • construction is the driving factor this market.
                • commissioning is the driving factor this market.
                • and operation of this network. Once operational is the driving factor this market.
                • the project is expected to deliver heat with approximately 60% renewable content is the driving factor this market.
                • thanks to the biogenic component of the treated waste. This initiative will significantly reduce carbon emissions is the driving factor this market.
                • saving around 14 is the driving factor this market.
                • 000 tonnes of CO2 annually compared to traditional natural gas or oil-based heating systems.In another notable development is the driving factor this market.
                • Sage Geosystems Inc. is the driving factor this market.
                • a geothermal and energy storage company is the driving factor this market.
                • announced a partnership in July 2024 with Electrocentrale Bucuresti S.A. is the driving factor this market.
                • a thermal and electrical energy producer in Romania. This collaboration aims to explore the implementation of geothermal energy within Bucharest to replace a fossil-fuel-based thermal plant with a clean is the driving factor this market.
                • reliable alternative. The initial project will generate up to 70 MW of thermal power for a district in Bucharest is the driving factor this market.
                • with plans for expansion to other projects and cities in Romania upon successful implementation.These initiatives underscore the growing emphasis on decarbonization within the global district heating market. By leveraging innovative technologies and forming strategic partnerships is the driving factor this market.
                • companies are making significant strides toward reducing carbon footprints and enhancing the sustainability of urban heating systems. The focus on renewable energy sources is the driving factor this market.
                • such as low-carbon heat from waste processing and geothermal energy is the driving factor this market.
                • is crucial for meeting long-term environmental goals and ensuring a cleaner is the driving factor this market.
                • more sustainable future for district heating networks. As these projects progress is the driving factor this market.
                • they are likely to set benchmarks for similar initiatives worldwide is the driving factor this market.
                • driving further advancements in the global district heating market. is the driving factor this market.

                The District Heating market vendors should focus on grabbing business opportunities from the Fossil fuels segment as it accounted for the largest market share in the base year.