Heat Shrink Tubing Market Analysis, Size, and Forecast 2026-2030: APAC (China, Japan, and India), North America (US, Canada, and Mexico), Europe (Germany, France, and UK), South America (Brazil, Argentina, and Colombia), Middle East and Africa (South Africa, UAE, and Saudi Arabia), and Rest of World (ROW)

Heat Shrink Tubing Market Analysis, Size, and Forecast 2026-2030:
APAC (China, Japan, and India), North America (US, Canada, and Mexico), Europe (Germany, France, and UK), South America (Brazil, Argentina, and Colombia), Middle East and Africa (South Africa, UAE, and Saudi Arabia), and Rest of World (ROW)

Published: Apr 2026 298 Pages SKU: IRTNTR74958

Market Overview at a Glance

$926.4 Mn
Market Opportunity
7.1%
CAGR 2025 - 2030
37.1%
APAC Growth
$1.41 B
OEM segment 2024

Heat Shrink Tubing Market Size 2026-2030

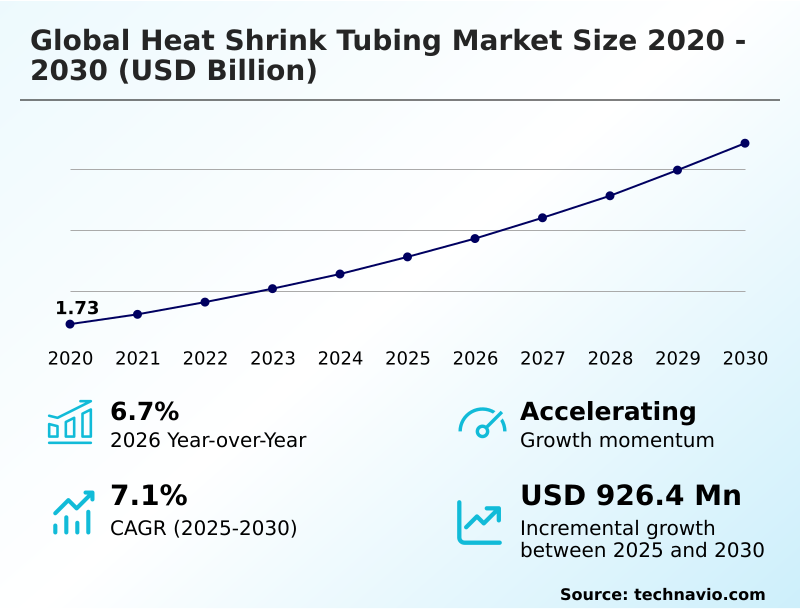
The heat shrink tubing market size is valued to increase by USD 926.4 million, at a CAGR of 7.1% from 2025 to 2030. Rapid expansion of electric vehicle architectures and high-voltage systems will drive the heat shrink tubing market.

Major Market Trends & Insights

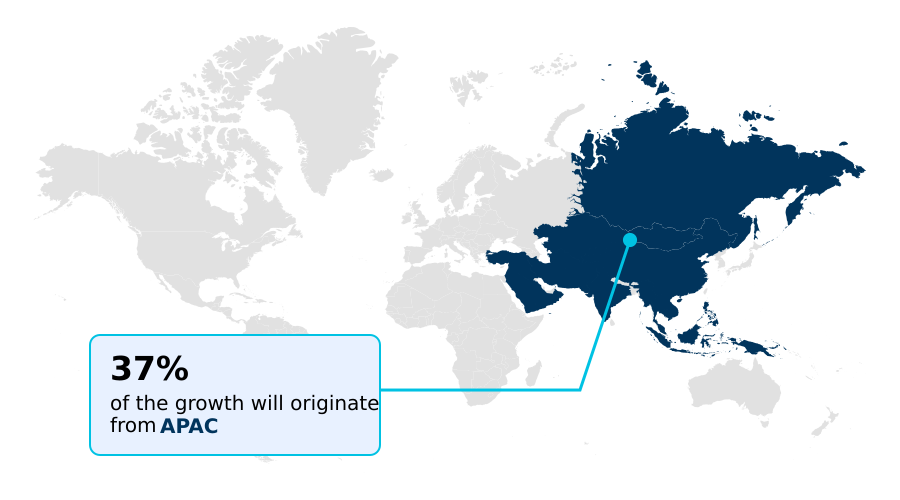
  • APAC dominated the market and accounted for a 37.1% growth during the forecast period.
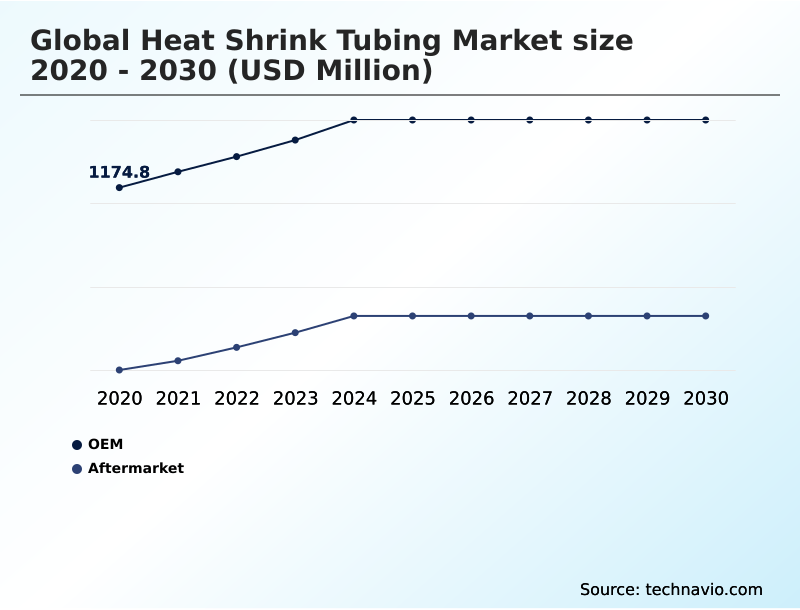
  • By Type - OEM segment was valued at USD 1.41 billion in 2024
  • By End-user - Utilities segment accounted for the largest market revenue share in 2024

Market Size & Forecast

  • Market Opportunities: USD 1.48 billion
  • Market Future Opportunities: USD 926.4 million
  • CAGR from 2025 to 2030 : 7.1%

Market Summary

  • The heat shrink tubing market is sustained by its essential role in providing electrical insulation, mechanical protection, and environmental sealing across critical industries. Demand is largely fueled by the global transition to electric vehicles, where complex automotive wiring harnesses require robust, high-voltage insulation to ensure safety and performance.
  • Concurrently, the expansion of 5G telecommunications and smart grid infrastructure projects necessitates durable cable termination sealing and strain relief solutions. A prominent trend involves the adoption of sustainable, bio-based polymers and halogen-free formulations as companies pivot to meet stricter environmental regulations and corporate sustainability mandates.
  • For instance, a major electronics manufacturer recently streamlined its supply chain by qualifying a new bio-based polyolefin tubing, reducing its carbon footprint by 15% while maintaining dielectric strength and abrasion resistance standards for its consumer products. However, the industry faces challenges from raw material price volatility and supply chain disruptions, impacting production costs and lead times.
  • The push for advanced materials like polyetheretherketone (PEEK) and medical-grade tubing with features like peelable heat shrink tubing (PHST) also drives innovation and competition among suppliers.

What will be the Size of the Heat Shrink Tubing Market during the forecast period?

Get Key Insights on Market Forecast (PDF) Get Free Sample

How is the Heat Shrink Tubing Market Segmented?

The heat shrink tubing industry research report provides comprehensive data (region-wise segment analysis), with forecasts and estimates in "USD million" for the period 2026-2030, as well as historical data from 2020-2024 for the following segments.

  • Type
    • OEM
    • Aftermarket
  • End-user
    • Utilities
    • Automotive
    • Food and beverage
    • Chemical
    • Others
  • Material
    • Polyolefin
    • PVC
    • Fluoropolymers
    • Elastomers
    • Polyetheretherketone
  • Geography
    • APAC
      • China
      • Japan
      • India
    • North America
      • US
      • Canada
      • Mexico
    • Europe
      • Germany
      • France
      • UK
    • South America
      • Brazil
      • Argentina
      • Colombia
    • Middle East and Africa
      • South Africa
      • UAE
      • Saudi Arabia
    • Rest of World (ROW)

By Type Insights

The oem segment is estimated to witness significant growth during the forecast period.

The Original Equipment Manufacturer (OEM) segment dictates market dynamics, integrating specialized tubing directly into new equipment.

This channel is defined by rigorous quality standards and customization, particularly for aerospace component protection and smart grid infrastructure, where materials with superior properties like fluoropolymer chemical inertness are essential. For example, military specification tubing must meet exacting performance criteria.

Applications such as busbar insulation and telecom cable joints demand high-performance solutions. The development of advanced materials like polyetheretherketone (PEEK) and components like PTFE liners is driven by the need for reliable cable termination sealing and subsea cable insulation.

Using appropriate tubing for sensor protection can improve data accuracy by 15% in industrial settings.

Get Free Sample

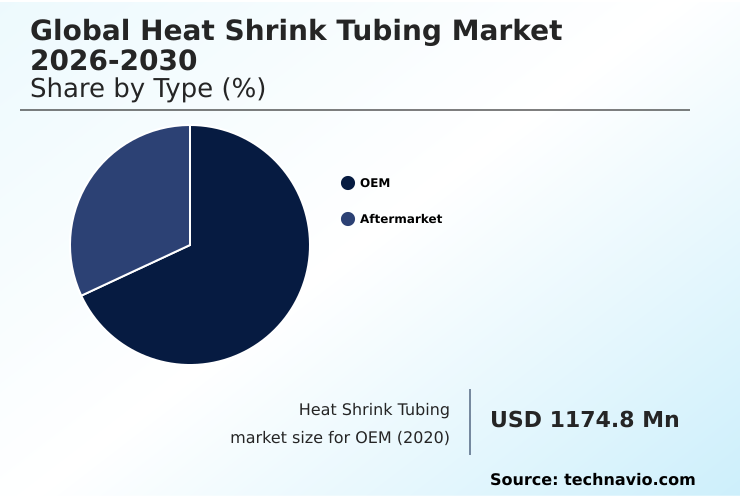
The OEM segment was valued at USD 1.41 billion in 2024 and showed a gradual increase during the forecast period.

Get Free Sample

Regional Analysis

APAC is estimated to contribute 37.1% to the growth of the global market during the forecast period.Technavio’s analysts have elaborately explained the regional trends and drivers that shape the market during the forecast period.

See How Heat Shrink Tubing Market Demand is Rising in APAC Get Free Sample

The market's geographic landscape is shaped by regional industrial strengths and regulatory environments. APAC leads, contributing over 37% of market growth, driven by electronics manufacturing that demands specific polyolefin shrink properties and consistent shrink ratio.

In North America, the aerospace and defense sectors have stringent OEM tubing requirements, focusing on high thermal stability, abrasion resistance, and chemical resistance for harsh environment protection.

The European market, accounting for nearly 24% of opportunity, prioritizes materials offering high dielectric strength and UV radiation protection for its infrastructure projects.

Meeting these varied regional specifications, from precise longitudinal shrinkage for component encapsulation to the availability of aftermarket repair kits, is critical for global suppliers.

Market Dynamics

Our researchers analyzed the data with 2025 as the base year, along with the key drivers, trends, and challenges. A holistic analysis of drivers will help companies refine their marketing strategies to gain a competitive advantage.

  • The Global Heat Shrink Tubing Market 2026-2030 by type shows a clear distinction between OEM and aftermarket channels, with the former dominating new installations. Similarly, the Global Heat Shrink Tubing Market 2026-2030 by end-user highlights the automotive and utilities sectors' substantial consumption.
  • When evaluating the Global Heat Shrink Tubing Market 2026-2030 by material, the choice between polyolefin vs pvc heat shrink tubing often comes down to flame retardancy and cost. For advanced applications, understanding heat shrink tubing for automotive electronics is crucial, as is selecting the best heat shrink tubing for marine applications, where corrosion resistance is paramount.
  • Using heat shrink tubing for battery packs, especially in EVs, demands specific insulation properties. High-voltage insulation for power grids requires materials with superior dielectric strength. For specialized needs, fluoropolymer tubing for chemical resistance is the preferred choice, while adhesive-lined tubing for waterproof seals ensures long-term reliability. Medical device heat shrink tubing specifications are exceptionally strict.
  • A key operational challenge is how to choose the correct shrink ratio for complex geometries. In aerospace, heat shrink tubing in aerospace wiring must meet rigorous safety standards. A growing trend is the adoption of eco-friendly bio-based heat shrink materials. For industrial safety, flame retardant tubing for industrial use is mandatory.
  • The rollout of new networks relies on quality heat shrink tubing for telecommunications infrastructure. Recently, the impact of raw material costs on tubing prices has been significant, with some input costs rising over 40% higher than historical averages, complicating operational planning. Advancements in peelable heat shrink technology are transforming medical device assembly.
  • Finally, examining OEM vs aftermarket heat shrink tubing quality reveals performance disparities, and understanding insulation requirements for electric vehicle charging cables is vital for safety and compliance.

What are the key market drivers leading to the rise in the adoption of Heat Shrink Tubing Industry?

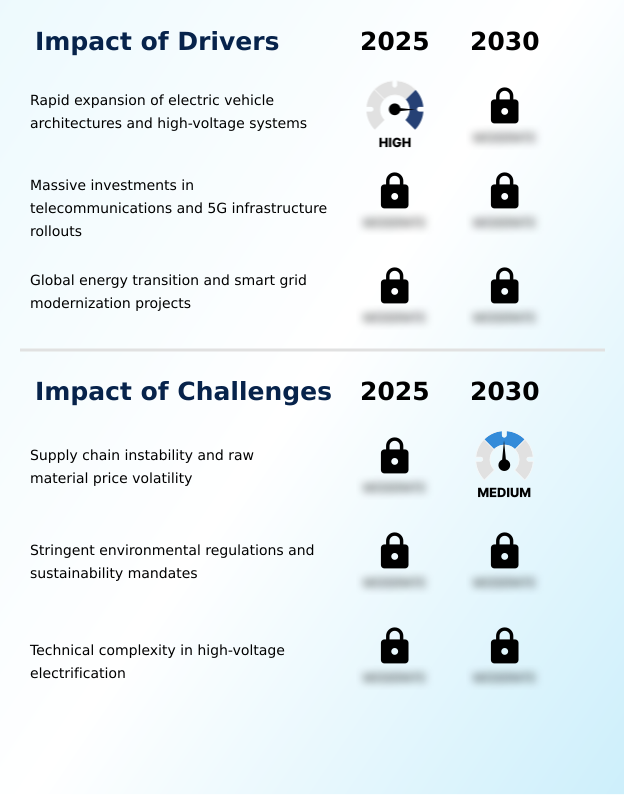
  • The rapid expansion of electric vehicle architectures and the increasing complexity of high-voltage systems are key drivers propelling market growth.

  • The market's primary driver is the rapid expansion of electric vehicle production, which demands advanced industrial insulation materials. This surge requires sophisticated wire harness protection and superior high-voltage insulation, particularly for EV battery insulation.
  • Effective cable management solutions are crucial for providing reliable electrical insulation and mechanical protection within compact vehicle architectures. These systems rely on tubing for strain relief and efficient cable bundling.
  • The need for robust power distribution insulation in smart grids also fuels demand. In these applications, dependable environmental sealing and moisture-proof sealing are non-negotiable, with advanced electrical component covering solutions reducing weather-related failures by as much as 30%.

What are the market trends shaping the Heat Shrink Tubing Industry?

  • A significant market trend is the integration of sustainable and bio-based polymer formulations. This shift is driven by manufacturers aiming to align with global decarbonization goals.

  • Current trends are transforming heat shrink tubing applications, with a major shift towards sustainable materials. The development of bio-based polymers and halogen-free formulations, such as low-smoke zero-halogen tubing, is redefining tubing material properties. This is driven by regulations and corporate goals, impacting traditional choices like polyolefin tubing and polyvinyl chloride (PVC) tubing.
  • Innovations in fluoropolymer insulation and elastomeric sleeves are enabling new high-temperature tubing options. In parallel, advancements in medical-grade tubing are supported by flexible tubing solutions tailored for sophisticated tubing for medical devices, with some new materials improving biocompatibility by over 20% and reducing material waste by 10% during manufacturing.

What challenges does the Heat Shrink Tubing Industry face during its growth?

  • Supply chain instability, coupled with significant price volatility for raw materials, presents a key challenge to industry growth.

  • Significant challenges stem from raw material price volatility, particularly for cross-linked polyolefin, which can increase manufacturing costs by over 20% unexpectedly. This instability complicates the supply of standard products like thin-wall tubing and heavy-wall tubing. Concurrently, technical complexity is rising in applications like automotive wiring harnesses and medical devices.
  • Developing custom shrink tubing that is also split-resistant and incorporates flame-retardant materials requires extensive R&D, extending project timelines by months. Innovations such as peelable heat shrink tubing (PHST), often used for peelable tubing for catheters, face high development hurdles. The need for reliable adhesive-lined tubing and effective corrosion protection sleeves in harsh environments adds another layer of technical challenge.

Exclusive Technavio Analysis on Customer Landscape

The heat shrink tubing market forecasting report includes the adoption lifecycle of the market, covering from the innovator’s stage to the laggard’s stage. It focuses on adoption rates in different regions based on penetration. Furthermore, the heat shrink tubing market report also includes key purchase criteria and drivers of price sensitivity to help companies evaluate and develop their market growth analysis strategies.

Customer Landscape of Heat Shrink Tubing Industry

Competitive Landscape

Companies are implementing various strategies, such as strategic alliances, heat shrink tubing market forecast, partnerships, mergers and acquisitions, geographical expansion, and product/service launches, to enhance their presence in the industry.

3M Co. - Offers specialized tubing for electrical insulation, moisture sealing, and cable bundling, serving safety, industrial, transportation, and electronics sectors.

The industry research and growth report includes detailed analyses of the competitive landscape of the market and information about key companies, including:

  • 3M Co.
  • ABB Ltd.
  • Alpha Wire Inc.
  • BuyHeatShrink
  • Dasheng Group
  • DSG Canusa
  • Dunbar Products, LLC.
  • GH Material
  • HellermannTyton GmbH
  • Molex LLC
  • National Plastics Group
  • Nexans SA
  • NSPA
  • Panduit Corp.
  • PEXCO
  • Qualtek Electronics Corp.
  • Sumitomo Electric Industries
  • Techflex Inc.
  • Woer Heat Shrinkable Material
  • Zeus Co. Inc.

Qualitative and quantitative analysis of companies has been conducted to help clients understand the wider business environment as well as the strengths and weaknesses of key industry players. Data is qualitatively analyzed to categorize companies as pure play, category-focused, industry-focused, and diversified; it is quantitatively analyzed to categorize companies as dominant, leading, strong, tentative, and weak.

Recent Development and News in Heat shrink tubing market

  • In March, 2025, TE Connectivity entered into a strategic partnership with Yazaki to jointly develop next-generation automotive-grade heat shrink tubing solutions engineered for high-vibration and high-temperature environments in modern vehicle architectures.
  • In April, 2025, Junkosha Inc. unveiled new developments in etched PTFE liners for its peelable heat shrink tubing, a product designed to meet the stringent requirements of medical device original equipment manufacturers.
  • In April, 2025, E. NEXT introduced its TERMO PRO series of adhesive-lined heat shrink tubing, specifically developed for industrial and electrical installations in harsh environments.
  • In May, 2025, Nexans introduced a new series of eco-designed, heavy-duty heat shrinkable sleeves focusing on halogen-free materials to modernize European power grids under stringent environmental and safety regulations.

Dive into Technavio’s robust research methodology, blending expert interviews, extensive data synthesis, and validated models for unparalleled Heat Shrink Tubing Market insights. See full methodology.

Market Scope
Page number 298
Base year 2025
Historic period 2020-2024
Forecast period 2026-2030
Growth momentum & CAGR Accelerate at a CAGR of 7.1%
Market growth 2026-2030 USD 926.4 million
Market structure Fragmented
YoY growth 2025-2026(%) 6.7%
Key countries China, Japan, India, South Korea, Australia, Indonesia, US, Canada, Mexico, Germany, France, UK, Italy, Spain, The Netherlands, Brazil, Argentina, Colombia, South Africa, UAE, Saudi Arabia, Egypt and Israel
Competitive landscape Leading Companies, Market Positioning of Companies, Competitive Strategies, and Industry Risks

Request Free Sample

Research Analyst Overview

  • The heat shrink tubing market's evolution is directly tied to advancements in material science and its application in high-stakes industries. Core products providing electrical insulation and mechanical protection are fundamental, but specialization is driving the competitive landscape.
  • For boardroom decisions, the key lies in materials strategy—choosing between standard cross-linked polyolefin and advanced fluoropolymer insulation or polyetheretherketone (PEEK) can significantly impact end-product reliability and cost. For example, in aerospace component protection, switching to a higher-grade material has been shown to reduce in-service failures by over 50%.
  • The proliferation of automotive wiring harnesses in electric vehicles necessitates superior high-voltage insulation and thermal stability. Meanwhile, innovations like medical-grade tubing and peelable heat shrink tubing (PHST) open new revenue streams. Offerings range from thin-wall tubing for electronics to adhesive-lined tubing for robust environmental sealing and strain relief in telecom cable joints and smart grid infrastructure.
  • The focus on dielectric strength, shrink ratio, and chemical resistance remains paramount, while the adoption of bio-based polymers and halogen-free formulations addresses sustainability mandates.

What are the Key Data Covered in this Heat Shrink Tubing Market Research and Growth Report?

  • What is the expected growth of the Heat Shrink Tubing Market between 2026 and 2030?

    • USD 926.4 million, at a CAGR of 7.1%

  • What segmentation does the market report cover?

    • The report is segmented by Type (OEM, and Aftermarket), End-user (Utilities, Automotive, Food and beverage, Chemical, and Others), Material (Polyolefin, PVC, Fluoropolymers, Elastomers, and Polyetheretherketone) and Geography (APAC, North America, Europe, South America, Middle East and Africa)

  • Which regions are analyzed in the report?

    • APAC, North America, Europe, South America and Middle East and Africa

  • What are the key growth drivers and market challenges?

    • Rapid expansion of electric vehicle architectures and high-voltage systems, Supply chain instability and raw material price volatility

  • Who are the major players in the Heat Shrink Tubing Market?

    • 3M Co., ABB Ltd., Alpha Wire Inc., BuyHeatShrink, Dasheng Group, DSG Canusa, Dunbar Products, LLC., GH Material, HellermannTyton GmbH, Molex LLC, National Plastics Group, Nexans SA, NSPA, Panduit Corp., PEXCO, Qualtek Electronics Corp., Sumitomo Electric Industries, Techflex Inc., Woer Heat Shrinkable Material and Zeus Co. Inc.

Market Research Insights

  • The market for industrial insulation materials is driven by evolving tubing material properties and diverse heat shrink tubing applications. Adopting advanced cable management solutions can reduce installation time by up to 25%. In critical sectors, the use of military specification tubing ensures performance, where component failure is not an option.
  • For instance, manufacturers utilizing flexible tubing solutions have reported a 15% improvement in production line agility. The demand for harsh environment protection is met with products offering superior corrosion protection sleeves and moisture-proof sealing. Specialized products, such as tubing for medical devices and tubing for sensor protection, are also gaining traction.
  • The shift towards higher-performing electrical component covering is clear, with suppliers focusing on custom shrink tubing and high shrink ratio tubing to meet specific OEM tubing requirements, resulting in a 10% reduction in material waste for certain applications.

We can help! Our analysts can customize this heat shrink tubing market research report to meet your requirements.

Get in touch

1. Executive Summary

1.1 Market overview

Executive Summary - Chart on Market Overview
Executive Summary - Data Table on Market Overview
Executive Summary - Chart on Global Market Characteristics
Executive Summary - Chart on Market by Geography
Executive Summary - Chart on Market Segmentation by Type
Executive Summary - Chart on Market Segmentation by End-user
Executive Summary - Chart on Market Segmentation by Material
Executive Summary - Chart on Incremental Growth
Executive Summary - Data Table on Incremental Growth
Executive Summary - Chart on Company Market Positioning

2. Technavio Analysis

2.1 Analysis of price sensitivity, lifecycle, customer purchase basket, adoption rates, and purchase criteria

2.2 Criticality of inputs and Factors of differentiation

Chart on Overview on criticality of inputs and factors of differentiation

2.3 Factors of disruption

Chart on Overview on factors of disruption

2.4 Impact of drivers and challenges

Chart on Impact of drivers and challenges in 2025 and 2030

3. Market Landscape

3.1 Market ecosystem

Chart on Parent Market
Data Table on - Parent Market

3.2 Market characteristics

Chart on Market characteristics analysis

3.3 Value chain analysis

Chart on Value chain analysis

4. Market Sizing

4.1 Market definition

Data Table on Offerings of companies included in the market definition

4.2 Market segment analysis

Market segments

4.3 Market size 2025

4.4 Market outlook: Forecast for 2025-2030

Chart on Global - Market size and forecast 2025-2030 ($ million)
Data Table on Global - Market size and forecast 2025-2030 ($ million)
Chart on Global Market: Year-over-year growth 2025-2030 (%)
Data Table on Global Market: Year-over-year growth 2025-2030 (%)

5. Historic Market Size

5.1 Global Heat Shrink Tubing Market 2020 - 2024

Historic Market Size - Data Table on Global Heat Shrink Tubing Market 2020 - 2024 ($ million)

5.2 Type segment analysis 2020 - 2024

Historic Market Size - Type Segment 2020 - 2024 ($ million)

5.3 End-user segment analysis 2020 - 2024

Historic Market Size - End-user Segment 2020 - 2024 ($ million)

5.4 Material segment analysis 2020 - 2024

Historic Market Size - Material Segment 2020 - 2024 ($ million)

5.5 Geography segment analysis 2020 - 2024

Historic Market Size - Geography Segment 2020 - 2024 ($ million)

5.6 Country segment analysis 2020 - 2024

Historic Market Size - Country Segment 2020 - 2024 ($ million)

6. Qualitative Analysis

6.1 Impact of AI on Global Heat Shrink Tubing Market

6.2 Impact of Geopolitical Conflict on Global Heat Shrink Tubing Market

7. Five Forces Analysis

7.1 Five forces summary

Five forces analysis - Comparison between 2025 and 2030

7.2 Bargaining power of buyers

Bargaining power of buyers - Impact of key factors 2025 and 2030

7.3 Bargaining power of suppliers

Bargaining power of suppliers - Impact of key factors in 2025 and 2030

7.4 Threat of new entrants

Threat of new entrants - Impact of key factors in 2025 and 2030

7.5 Threat of substitutes

Threat of substitutes - Impact of key factors in 2025 and 2030

7.6 Threat of rivalry

Threat of rivalry - Impact of key factors in 2025 and 2030

7.7 Market condition

Chart on Market condition - Five forces 2025 and 2030

8. Market Segmentation by Type

8.1 Market segments

Chart on Type - Market share 2025-2030 (%)
Data Table on Type - Market share 2025-2030 (%)

8.2 Comparison by Type

Chart on Comparison by Type
Data Table on Comparison by Type

8.3 OEM - Market size and forecast 2025-2030

Chart on OEM - Market size and forecast 2025-2030 ($ million)
Data Table on OEM - Market size and forecast 2025-2030 ($ million)
Chart on OEM - Year-over-year growth 2025-2030 (%)
Data Table on OEM - Year-over-year growth 2025-2030 (%)

8.4 Aftermarket - Market size and forecast 2025-2030

Chart on Aftermarket - Market size and forecast 2025-2030 ($ million)
Data Table on Aftermarket - Market size and forecast 2025-2030 ($ million)
Chart on Aftermarket - Year-over-year growth 2025-2030 (%)
Data Table on Aftermarket - Year-over-year growth 2025-2030 (%)

8.5 Market opportunity by Type

Market opportunity by Type ($ million)
Data Table on Market opportunity by Type ($ million)

9. Market Segmentation by End-user

9.1 Market segments

Chart on End-user - Market share 2025-2030 (%)
Data Table on End-user - Market share 2025-2030 (%)

9.2 Comparison by End-user

Chart on Comparison by End-user
Data Table on Comparison by End-user

9.3 Utilities - Market size and forecast 2025-2030

Chart on Utilities - Market size and forecast 2025-2030 ($ million)
Data Table on Utilities - Market size and forecast 2025-2030 ($ million)
Chart on Utilities - Year-over-year growth 2025-2030 (%)
Data Table on Utilities - Year-over-year growth 2025-2030 (%)

9.4 Automotive - Market size and forecast 2025-2030

Chart on Automotive - Market size and forecast 2025-2030 ($ million)
Data Table on Automotive - Market size and forecast 2025-2030 ($ million)
Chart on Automotive - Year-over-year growth 2025-2030 (%)
Data Table on Automotive - Year-over-year growth 2025-2030 (%)

9.5 Food and beverage - Market size and forecast 2025-2030

Chart on Food and beverage - Market size and forecast 2025-2030 ($ million)
Data Table on Food and beverage - Market size and forecast 2025-2030 ($ million)
Chart on Food and beverage - Year-over-year growth 2025-2030 (%)
Data Table on Food and beverage - Year-over-year growth 2025-2030 (%)

9.6 Chemical - Market size and forecast 2025-2030

Chart on Chemical - Market size and forecast 2025-2030 ($ million)
Data Table on Chemical - Market size and forecast 2025-2030 ($ million)
Chart on Chemical - Year-over-year growth 2025-2030 (%)
Data Table on Chemical - Year-over-year growth 2025-2030 (%)

9.7 Others - Market size and forecast 2025-2030

Chart on Others - Market size and forecast 2025-2030 ($ million)
Data Table on Others - Market size and forecast 2025-2030 ($ million)
Chart on Others - Year-over-year growth 2025-2030 (%)
Data Table on Others - Year-over-year growth 2025-2030 (%)

9.8 Market opportunity by End-user

Market opportunity by End-user ($ million)
Data Table on Market opportunity by End-user ($ million)

10. Market Segmentation by Material

10.1 Market segments

Chart on Material - Market share 2025-2030 (%)
Data Table on Material - Market share 2025-2030 (%)

10.2 Comparison by Material

Chart on Comparison by Material
Data Table on Comparison by Material

10.3 Polyolefin - Market size and forecast 2025-2030

Chart on Polyolefin - Market size and forecast 2025-2030 ($ million)
Data Table on Polyolefin - Market size and forecast 2025-2030 ($ million)
Chart on Polyolefin - Year-over-year growth 2025-2030 (%)
Data Table on Polyolefin - Year-over-year growth 2025-2030 (%)

10.4 PVC - Market size and forecast 2025-2030

Chart on PVC - Market size and forecast 2025-2030 ($ million)
Data Table on PVC - Market size and forecast 2025-2030 ($ million)
Chart on PVC - Year-over-year growth 2025-2030 (%)
Data Table on PVC - Year-over-year growth 2025-2030 (%)

10.5 Fluoropolymers - Market size and forecast 2025-2030

Chart on Fluoropolymers - Market size and forecast 2025-2030 ($ million)
Data Table on Fluoropolymers - Market size and forecast 2025-2030 ($ million)
Chart on Fluoropolymers - Year-over-year growth 2025-2030 (%)
Data Table on Fluoropolymers - Year-over-year growth 2025-2030 (%)

10.6 Elastomers - Market size and forecast 2025-2030

Chart on Elastomers - Market size and forecast 2025-2030 ($ million)
Data Table on Elastomers - Market size and forecast 2025-2030 ($ million)
Chart on Elastomers - Year-over-year growth 2025-2030 (%)
Data Table on Elastomers - Year-over-year growth 2025-2030 (%)

10.7 Polyetheretherketone - Market size and forecast 2025-2030

Chart on Polyetheretherketone - Market size and forecast 2025-2030 ($ million)
Data Table on Polyetheretherketone - Market size and forecast 2025-2030 ($ million)
Chart on Polyetheretherketone - Year-over-year growth 2025-2030 (%)
Data Table on Polyetheretherketone - Year-over-year growth 2025-2030 (%)

10.8 Market opportunity by Material

Market opportunity by Material ($ million)
Data Table on Market opportunity by Material ($ million)

11. Customer Landscape

11.1 Customer landscape overview

Analysis of price sensitivity, lifecycle, customer purchase basket, adoption rates, and purchase criteria

12. Geographic Landscape

12.1 Geographic segmentation

Chart on Market share by geography 2025-2030 (%)
Data Table on Market share by geography 2025-2030 (%)

12.2 Geographic comparison

Chart on Geographic comparison
Data Table on Geographic comparison

12.3 APAC - Market size and forecast 2025-2030

Chart on APAC - Market size and forecast 2025-2030 ($ million)
Data Table on APAC - Market size and forecast 2025-2030 ($ million)
Chart on APAC - Year-over-year growth 2025-2030 (%)
Data Table on APAC - Year-over-year growth 2025-2030 (%)
Chart on Regional Comparison - APAC
Data Table on Regional Comparison - APAC

12.3.1 China - Market size and forecast 2025-2030

Chart on China - Market size and forecast 2025-2030 ($ million)
Data Table on China - Market size and forecast 2025-2030 ($ million)
Chart on China - Year-over-year growth 2025-2030 (%)
Data Table on China - Year-over-year growth 2025-2030 (%)

12.3.2 Japan - Market size and forecast 2025-2030

Chart on Japan - Market size and forecast 2025-2030 ($ million)
Data Table on Japan - Market size and forecast 2025-2030 ($ million)
Chart on Japan - Year-over-year growth 2025-2030 (%)
Data Table on Japan - Year-over-year growth 2025-2030 (%)

12.3.3 India - Market size and forecast 2025-2030

Chart on India - Market size and forecast 2025-2030 ($ million)
Data Table on India - Market size and forecast 2025-2030 ($ million)
Chart on India - Year-over-year growth 2025-2030 (%)
Data Table on India - Year-over-year growth 2025-2030 (%)

12.3.4 South Korea - Market size and forecast 2025-2030

Chart on South Korea - Market size and forecast 2025-2030 ($ million)
Data Table on South Korea - Market size and forecast 2025-2030 ($ million)
Chart on South Korea - Year-over-year growth 2025-2030 (%)
Data Table on South Korea - Year-over-year growth 2025-2030 (%)

12.3.5 Australia - Market size and forecast 2025-2030

Chart on Australia - Market size and forecast 2025-2030 ($ million)
Data Table on Australia - Market size and forecast 2025-2030 ($ million)
Chart on Australia - Year-over-year growth 2025-2030 (%)
Data Table on Australia - Year-over-year growth 2025-2030 (%)

12.3.6 Indonesia - Market size and forecast 2025-2030

Chart on Indonesia - Market size and forecast 2025-2030 ($ million)
Data Table on Indonesia - Market size and forecast 2025-2030 ($ million)
Chart on Indonesia - Year-over-year growth 2025-2030 (%)
Data Table on Indonesia - Year-over-year growth 2025-2030 (%)

12.4 North America - Market size and forecast 2025-2030

Chart on North America - Market size and forecast 2025-2030 ($ million)
Data Table on North America - Market size and forecast 2025-2030 ($ million)
Chart on North America - Year-over-year growth 2025-2030 (%)
Data Table on North America - Year-over-year growth 2025-2030 (%)
Chart on Regional Comparison - North America
Data Table on Regional Comparison - North America

12.4.1 US - Market size and forecast 2025-2030

Chart on US - Market size and forecast 2025-2030 ($ million)
Data Table on US - Market size and forecast 2025-2030 ($ million)
Chart on US - Year-over-year growth 2025-2030 (%)
Data Table on US - Year-over-year growth 2025-2030 (%)

12.4.2 Canada - Market size and forecast 2025-2030

Chart on Canada - Market size and forecast 2025-2030 ($ million)
Data Table on Canada - Market size and forecast 2025-2030 ($ million)
Chart on Canada - Year-over-year growth 2025-2030 (%)
Data Table on Canada - Year-over-year growth 2025-2030 (%)

12.4.3 Mexico - Market size and forecast 2025-2030

Chart on Mexico - Market size and forecast 2025-2030 ($ million)
Data Table on Mexico - Market size and forecast 2025-2030 ($ million)
Chart on Mexico - Year-over-year growth 2025-2030 (%)
Data Table on Mexico - Year-over-year growth 2025-2030 (%)

12.5 Europe - Market size and forecast 2025-2030

Chart on Europe - Market size and forecast 2025-2030 ($ million)
Data Table on Europe - Market size and forecast 2025-2030 ($ million)
Chart on Europe - Year-over-year growth 2025-2030 (%)
Data Table on Europe - Year-over-year growth 2025-2030 (%)
Chart on Regional Comparison - Europe
Data Table on Regional Comparison - Europe

12.5.1 Germany - Market size and forecast 2025-2030

Chart on Germany - Market size and forecast 2025-2030 ($ million)
Data Table on Germany - Market size and forecast 2025-2030 ($ million)
Chart on Germany - Year-over-year growth 2025-2030 (%)
Data Table on Germany - Year-over-year growth 2025-2030 (%)

12.5.2 France - Market size and forecast 2025-2030

Chart on France - Market size and forecast 2025-2030 ($ million)
Data Table on France - Market size and forecast 2025-2030 ($ million)
Chart on France - Year-over-year growth 2025-2030 (%)
Data Table on France - Year-over-year growth 2025-2030 (%)

12.5.3 UK - Market size and forecast 2025-2030

Chart on UK - Market size and forecast 2025-2030 ($ million)
Data Table on UK - Market size and forecast 2025-2030 ($ million)
Chart on UK - Year-over-year growth 2025-2030 (%)
Data Table on UK - Year-over-year growth 2025-2030 (%)

12.5.4 Italy - Market size and forecast 2025-2030

Chart on Italy - Market size and forecast 2025-2030 ($ million)
Data Table on Italy - Market size and forecast 2025-2030 ($ million)
Chart on Italy - Year-over-year growth 2025-2030 (%)
Data Table on Italy - Year-over-year growth 2025-2030 (%)

12.5.5 Spain - Market size and forecast 2025-2030

Chart on Spain - Market size and forecast 2025-2030 ($ million)
Data Table on Spain - Market size and forecast 2025-2030 ($ million)
Chart on Spain - Year-over-year growth 2025-2030 (%)
Data Table on Spain - Year-over-year growth 2025-2030 (%)

12.5.6 The Netherlands - Market size and forecast 2025-2030

Chart on The Netherlands - Market size and forecast 2025-2030 ($ million)
Data Table on The Netherlands - Market size and forecast 2025-2030 ($ million)
Chart on The Netherlands - Year-over-year growth 2025-2030 (%)
Data Table on The Netherlands - Year-over-year growth 2025-2030 (%)

12.6 South America - Market size and forecast 2025-2030

Chart on South America - Market size and forecast 2025-2030 ($ million)
Data Table on South America - Market size and forecast 2025-2030 ($ million)
Chart on South America - Year-over-year growth 2025-2030 (%)
Data Table on South America - Year-over-year growth 2025-2030 (%)
Chart on Regional Comparison - South America
Data Table on Regional Comparison - South America

12.6.1 Brazil - Market size and forecast 2025-2030

Chart on Brazil - Market size and forecast 2025-2030 ($ million)
Data Table on Brazil - Market size and forecast 2025-2030 ($ million)
Chart on Brazil - Year-over-year growth 2025-2030 (%)
Data Table on Brazil - Year-over-year growth 2025-2030 (%)

12.6.2 Argentina - Market size and forecast 2025-2030

Chart on Argentina - Market size and forecast 2025-2030 ($ million)
Data Table on Argentina - Market size and forecast 2025-2030 ($ million)
Chart on Argentina - Year-over-year growth 2025-2030 (%)
Data Table on Argentina - Year-over-year growth 2025-2030 (%)

12.6.3 Colombia - Market size and forecast 2025-2030

Chart on Colombia - Market size and forecast 2025-2030 ($ million)
Data Table on Colombia - Market size and forecast 2025-2030 ($ million)
Chart on Colombia - Year-over-year growth 2025-2030 (%)
Data Table on Colombia - Year-over-year growth 2025-2030 (%)

12.7 Middle East and Africa - Market size and forecast 2025-2030

Chart on Middle East and Africa - Market size and forecast 2025-2030 ($ million)
Data Table on Middle East and Africa - Market size and forecast 2025-2030 ($ million)
Chart on Middle East and Africa - Year-over-year growth 2025-2030 (%)
Data Table on Middle East and Africa - Year-over-year growth 2025-2030 (%)
Chart on Regional Comparison - Middle East and Africa
Data Table on Regional Comparison - Middle East and Africa

12.7.1 South Africa - Market size and forecast 2025-2030

Chart on South Africa - Market size and forecast 2025-2030 ($ million)
Data Table on South Africa - Market size and forecast 2025-2030 ($ million)
Chart on South Africa - Year-over-year growth 2025-2030 (%)
Data Table on South Africa - Year-over-year growth 2025-2030 (%)

12.7.2 UAE - Market size and forecast 2025-2030

Chart on UAE - Market size and forecast 2025-2030 ($ million)
Data Table on UAE - Market size and forecast 2025-2030 ($ million)
Chart on UAE - Year-over-year growth 2025-2030 (%)
Data Table on UAE - Year-over-year growth 2025-2030 (%)

12.7.3 Saudi Arabia - Market size and forecast 2025-2030

Chart on Saudi Arabia - Market size and forecast 2025-2030 ($ million)
Data Table on Saudi Arabia - Market size and forecast 2025-2030 ($ million)
Chart on Saudi Arabia - Year-over-year growth 2025-2030 (%)
Data Table on Saudi Arabia - Year-over-year growth 2025-2030 (%)

12.7.4 Egypt - Market size and forecast 2025-2030

Chart on Egypt - Market size and forecast 2025-2030 ($ million)
Data Table on Egypt - Market size and forecast 2025-2030 ($ million)
Chart on Egypt - Year-over-year growth 2025-2030 (%)
Data Table on Egypt - Year-over-year growth 2025-2030 (%)

12.7.5 Israel - Market size and forecast 2025-2030

Chart on Israel - Market size and forecast 2025-2030 ($ million)
Data Table on Israel - Market size and forecast 2025-2030 ($ million)
Chart on Israel - Year-over-year growth 2025-2030 (%)
Data Table on Israel - Year-over-year growth 2025-2030 (%)

12.8 Market opportunity by geography

Market opportunity by geography ($ million)
Data Tables on Market opportunity by geography ($ million)

13. Drivers, Challenges, and Opportunity

13.1 Market drivers

Rapid expansion of electric vehicle architectures and high-voltage systems
Massive investments in telecommunications and 5G infrastructure rollouts
Global energy transition and smart grid modernization projects

13.2 Market challenges

Supply chain instability and raw material price volatility
Stringent environmental regulations and sustainability mandates
Technical complexity in high-voltage electrification

13.3 Impact of drivers and challenges

Impact of drivers and challenges in 2025 and 2030

13.4 Market opportunities

Integration of sustainable and bio-based polymer formulations
Advancements in medical-grade peelable and ultra-thin tubing
Proliferation of smart manufacturing and precision automation

14. Competitive Landscape

14.1 Overview

14.2

Overview on criticality of inputs and factors of differentiation

14.3 Landscape disruption

Overview on factors of disruption

14.4 Industry risks

Impact of key risks on business

15. Competitive Analysis

15.1 Companies profiled

Companies covered

15.2 Company ranking index

15.3 Market positioning of companies

Matrix on companies position and classification

15.4 3M Co.

3M Co. - Overview
3M Co. - Business segments
3M Co. - Key offerings
3M Co. - Segment focus
SWOT

15.5 ABB Ltd.

ABB Ltd. - Overview
ABB Ltd. - Business segments
ABB Ltd. - Key news
ABB Ltd. - Key offerings
ABB Ltd. - Segment focus
SWOT

15.6 Alpha Wire Inc.

Alpha Wire Inc. - Overview
Alpha Wire Inc. - Product / Service
Alpha Wire Inc. - Key offerings
SWOT

15.7 Dunbar Products, LLC.

Dunbar Products, LLC. - Overview
Dunbar Products, LLC. - Product / Service
Dunbar Products, LLC. - Key offerings
SWOT

15.8 GH Material

GH Material - Overview
GH Material - Product / Service
GH Material - Key offerings
SWOT

15.9 HellermannTyton GmbH

HellermannTyton GmbH - Overview
HellermannTyton GmbH - Product / Service
HellermannTyton GmbH - Key offerings
SWOT

15.10 Molex LLC

Molex LLC - Overview
Molex LLC - Product / Service
Molex LLC - Key offerings
SWOT

15.11 Nexans SA

Nexans SA - Overview
Nexans SA - Business segments
Nexans SA - Key offerings
Nexans SA - Segment focus
SWOT

15.12 Panduit Corp.

Panduit Corp. - Overview
Panduit Corp. - Product / Service
Panduit Corp. - Key offerings
SWOT

15.13 PEXCO

PEXCO - Overview
PEXCO - Product / Service
PEXCO - Key offerings
SWOT

15.14 Qualtek Electronics Corp.

Qualtek Electronics Corp. - Overview
Qualtek Electronics Corp. - Product / Service
Qualtek Electronics Corp. - Key offerings
SWOT

15.15 Sumitomo Electric Industries

Sumitomo Electric Industries - Overview
Sumitomo Electric Industries - Business segments
Sumitomo Electric Industries - Key news
Sumitomo Electric Industries - Key offerings
Sumitomo Electric Industries - Segment focus
SWOT

15.16 Techflex Inc.

Techflex Inc. - Overview
Techflex Inc. - Product / Service
Techflex Inc. - Key offerings
SWOT

15.17 Woer Heat Shrinkable Material

Woer Heat Shrinkable Material - Overview
Woer Heat Shrinkable Material - Product / Service
Woer Heat Shrinkable Material - Key offerings
SWOT

15.18 Zeus Co. Inc.

Zeus Co. Inc. - Overview
Zeus Co. Inc. - Product / Service
Zeus Co. Inc. - Key offerings
SWOT

16. Appendix

16.1 Scope of the report

Market definition
Objectives
Notes and caveats

16.2 Inclusions and exclusions checklist

Inclusions checklist
Exclusions checklist

16.3 Currency conversion rates for US$

16.4 Research methodology

16.5 Data procurement

Information sources

16.6 Data validation

16.7 Validation techniques employed for market sizing

16.8 Data synthesis

16.9 360 degree market analysis

16.10 List of abbreviations

Research Methodology

Technavio presents a detailed picture of the market by way of study, synthesis, and summation of data from multiple sources. The analysts have presented the various facets of the market with a particular focus on identifying the key industry influencers. The data thus presented is comprehensive, reliable, and the result of extensive research, both primary and secondary.

INFORMATION SOURCES

Primary sources

  • Manufacturers and suppliers
  • Channel partners
  • Industry experts
  • Strategic decision makers

Secondary sources

  • Industry journals and periodicals
  • Government data
  • Financial reports of key industry players
  • Historical data
  • Press releases

DATA ANALYSIS

Data Synthesis

  • Collation of data
  • Estimation of key figures
  • Analysis of derived insights

Data Validation

  • Triangulation with data models
  • Reference against proprietary databases
  • Corroboration with industry experts

REPORT WRITING

Qualitative

  • Market drivers
  • Market challenges
  • Market trends
  • Five forces analysis

Quantitative

  • Market size and forecast
  • Market segmentation
  • Geographical insights
  • Competitive landscape

Interested in this report?

Get your sample now to see our research methodology and insights!

Download Now

Frequently Asked Questions

Heat Shrink Tubing market growth will increase by USD 926.4 million during 2026-2030.

The Heat Shrink Tubing market is expected to grow at a CAGR of 7.1% during 2026-2030.

Heat Shrink Tubing market is segmented by Type (OEM, Aftermarket) End-user (Utilities, Automotive, Food and beverage, Chemical, Others) Material (Polyolefin, PVC, Fluoropolymers, Elastomers, Polyetheretherketone)

3M Co., ABB Ltd., Alpha Wire Inc., BuyHeatShrink, Dasheng Group, DSG Canusa, Dunbar Products, LLC., GH Material, HellermannTyton GmbH, Molex LLC, National Plastics Group, Nexans SA, NSPA, Panduit Corp., PEXCO, Qualtek Electronics Corp., Sumitomo Electric Industries, Techflex Inc., Woer Heat Shrinkable Material, Zeus Co. Inc. are a few of the key vendors in the Heat Shrink Tubing market.

APAC will register the highest growth rate of 37.1% among the other regions. Therefore, the Heat Shrink Tubing market in APAC is expected to garner significant business opportunities for the vendors during the forecast period.

China, Japan, India, South Korea, Australia, Indonesia, US, Canada, Mexico, Germany, France, UK, Italy, Spain, The Netherlands, Brazil, Argentina, Colombia, South Africa, UAE, Saudi Arabia, Egypt, Israel

  • Rapid expansion of electric vehicle architectures and high-voltage systems is the driving factor this market.

The Heat Shrink Tubing market vendors should focus on grabbing business opportunities from the Type segment as it accounted for the largest market share in the base year.
RIA - Research AI Assistant
Ask RIA