
Hemostats Market Size 2025-2029
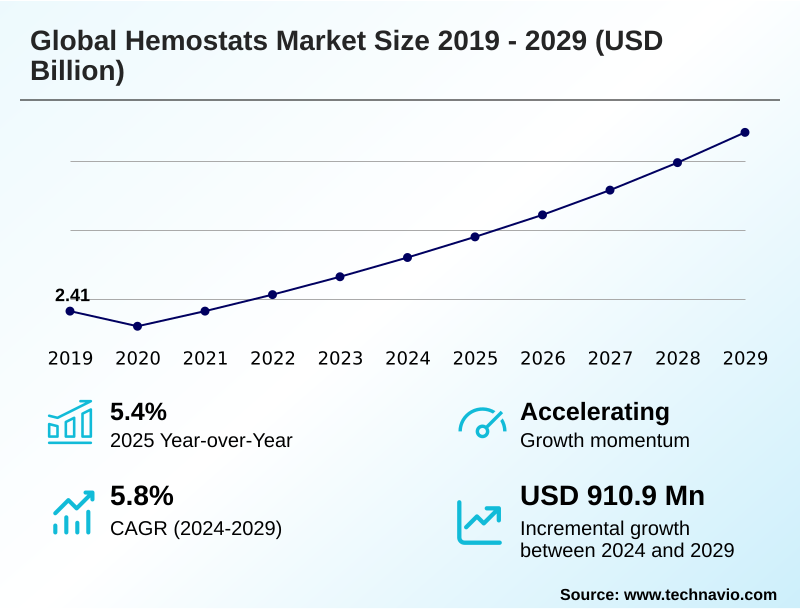
The hemostats market size is valued to increase by USD 910.9 million, at a CAGR of 5.8% from 2024 to 2029. Growing volume of surgical procedures performed will drive the hemostats market.
Major Market Trends & Insights
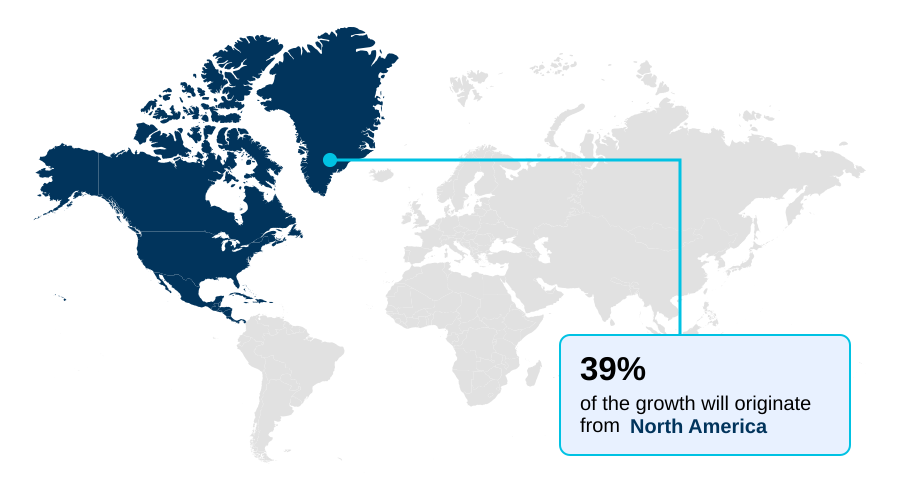
- North America dominated the market and accounted for a 39.3% growth during the forecast period.
- By Formulation - Matrix and gels segment was valued at USD 1.07 billion in 2023
- By Product Type - Thrombin-based hemostats segment accounted for the largest market revenue share in 2023
Market Size & Forecast
- Market Opportunities: USD 1.30 billion
- Market Future Opportunities: USD 910.9 million
- CAGR from 2024 to 2029 : 5.8%
Market Summary
- The hemostats market is characterized by continuous innovation aimed at improving surgical bleeding control and patient safety outcomes. Growth is fundamentally tied to the rising global volume of surgeries and the increasing complexity of procedures such as minimally invasive surgery and orthopedic reconstruction.
- In response, manufacturers are developing advanced flowable hemostatic agents and absorbable hemostatic powder formulations that offer superior hemostatic agent efficacy and bioresorbable materials. A key business scenario involves a large hospital network seeking to standardize its hemostatic agents to improve efficiency.
- By analyzing products based on their ability to achieve rapid coagulation cascade activation and reduce blood transfusion rates, the network can optimize both clinical outcomes and operational costs. This process highlights the market's competitive dynamics, where success depends on balancing advanced tissue sealing technology with the economic pressures of group purchasing organization negotiation.
- The market also faces challenges, including the need for robust end-user training requirements, particularly for tools used in high-risk surgical settings like endoscopic hemostasis.
What will be the Size of the Hemostats Market during the forecast period?
Get Key Insights on Market Forecast (PDF) Get Free Sample
How is the Hemostats Market Segmented?
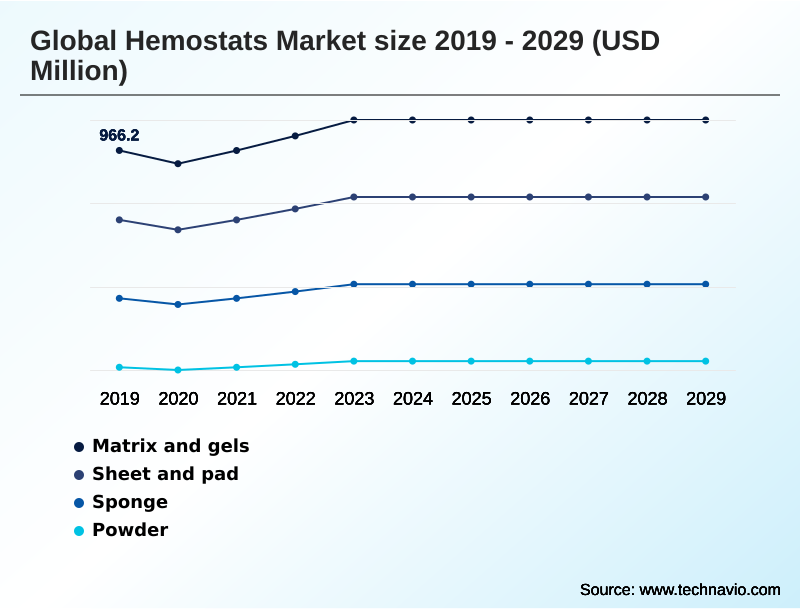
The hemostats industry research report provides comprehensive data (region-wise segment analysis), with forecasts and estimates in "USD million" for the period 2025-2029, as well as historical data from 2019-2023 for the following segments.
- Formulation
- Matrix and gels
- Sheet and pad
- Sponge
- Powder
- Product type
- Thrombin-based hemostats
- Gelatin-based hemostats
- Collagen-based hemostats
- End-user
- Hospitals
- ASCs
- Specialty clinics
- Geography
- North America
- US
- Canada
- Mexico
- Europe
- Germany
- UK
- France
- Asia
- Rest of World (ROW)
- North America
By Formulation Insights
The matrix and gels segment is estimated to witness significant growth during the forecast period.
The matrix and gels segment commands a significant share of the hemostats market, driven by its utility in complex procedures where traditional surgical wound closure is insufficient.
These products, typically combining a thrombin component with a flowable gelatin matrix, offer a versatile solution for surgeons. The hemostatic matrix is adept at conforming to irregular wound topographies, providing effective coagulation cascade activation in high-risk surgical settings.
Their application in minimally invasive surgery is particularly valuable, addressing challenges related to access and visibility. As physicians increasingly prioritize tools that reduce postoperative bleeding complications, the role of these agents is solidifying based on positive clinical trial endpoints.
For example, use of these agents has been shown to reduce procedural times in certain complex surgeries by over 20%, reinforcing their value based on physician preference items.
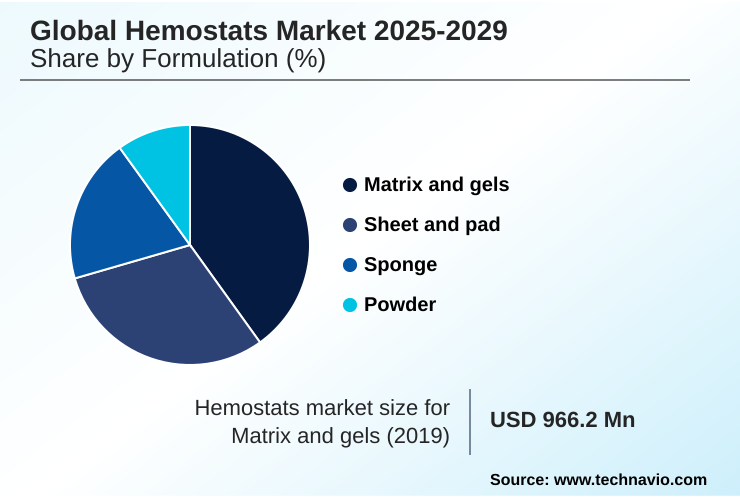
The Matrix and gels segment was valued at USD 1.07 billion in 2023 and showed a gradual increase during the forecast period.
Regional Analysis
North America is estimated to contribute 39.3% to the growth of the global market during the forecast period.Technavio’s analysts have elaborately explained the regional trends and drivers that shape the market during the forecast period.
See How Hemostats Market Demand is Rising in North America Get Free Sample
North America's market leadership, accounting for 39.3% of incremental growth, is sustained by its advanced infrastructure and widespread use of sophisticated bleeding control management technologies.
In contrast, Asia is experiencing rapid expansion fueled by significant healthcare infrastructure development and a rising demand for gelatin-based hemostat products in newly established hospitals. In these emerging regions, enhancing emergency medical response capabilities is a key priority, driving adoption.
A critical metric for hospital formulary decisions globally is hemostatic agent efficacy; for instance, some health systems have achieved a 15% blood transfusion reduction by standardizing their use of high-performance agents.
This focus on outcomes is crucial for managing everything from routine procedures to surgical site infection prevention.
Market Dynamics
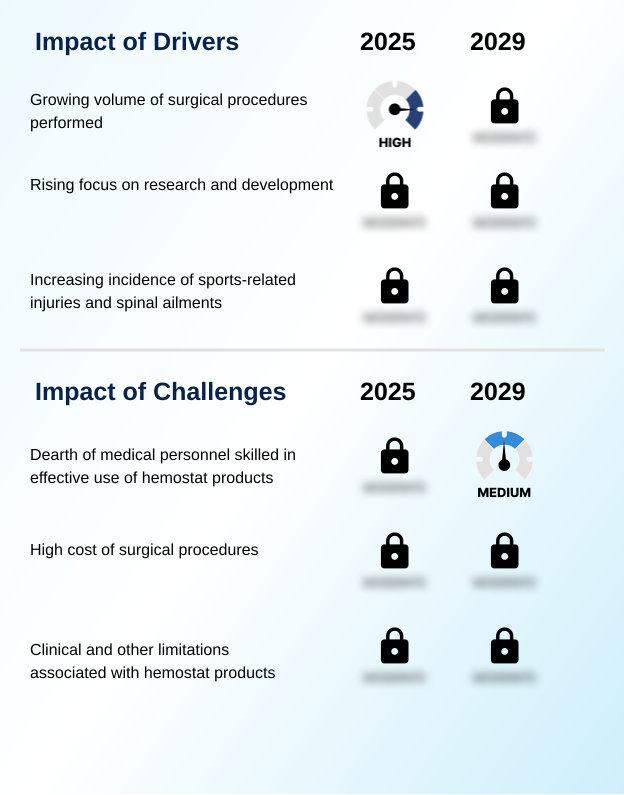
Our researchers analyzed the data with 2024 as the base year, along with the key drivers, trends, and challenges. A holistic analysis of drivers will help companies refine their marketing strategies to gain a competitive advantage.
- The strategic selection of hemostatic agents is increasingly procedure-specific, reflecting a sophisticated understanding of their distinct properties and applications. For example, thrombin-based hemostats for cardiovascular surgery are preferred for their rapid, active mechanism, while gelatin-based hemostats in orthopedic surgery offer both hemostasis and a structural scaffold.
- The debate between synthetic vs biological hemostatic agents often centers on immunogenicity and bioresorbable hemostat material properties. The expansion of hemostat use in minimally invasive procedures has spurred innovation in delivery systems, making tools more adaptable for confined surgical fields.
- Healthcare administrators rigorously evaluate the cost-effectiveness of advanced hemostatic agents by weighing initial outlay against long-term benefits, such as reducing blood loss in major surgeries. Specialized products like flowable hemostatic agents for complex wounds and absorbable powder hemostat for diffuse bleeding address previously unmet clinical needs.
- Furthermore, dedicated hemostatic products for trauma management and protocols for managing bleeding in anticoagulated patients are becoming standard in emergency and critical care settings. The regulatory approval for novel hemostats remains a rigorous process, ensuring that new oxidized cellulose hemostat applications and polysaccharide-based hemostats meet high safety standards.
- This specificity extends to hemostat selection for specific tissue types and preventing post-surgical adhesion with hemostats, where product choice can directly impact patient recovery. Hospitals that standardize hemostat selection report up to a 10% reduction in related post-operative complications compared to those with varied approaches, underscoring the operational benefit of strategic procurement.
- This targeted approach is also evident in the development of hemostatic sealants for vascular reconstruction and understanding the performance of different products in high-pressure bleeding situations.
What are the key market drivers leading to the rise in the adoption of Hemostats Industry?
- A primary driver for the market is the increasing global volume of surgical procedures, fueled by an aging population and a higher prevalence of chronic conditions requiring intervention.
- The primary market driver is the sustained growth in global surgical procedure volume, fueled by an aging population and a higher incidence of conditions requiring interventions such as cardiothoracic procedures and orthopedic reconstruction.
- This increases the imperative for effective surgical blood loss reduction. Innovations in bioresorbable materials, including absorbable hemostatic powder and microfibrillar collagen, are meeting this demand, with some new formulations achieving hemostasis 35% faster than previous generations.
- The clinical drive to minimize post-surgical adhesion further propels the use of advanced products. As surgical complexity increases, particularly in neurosurgery applications and trauma care bleeding scenarios, the demand for reliable and fast-acting solutions intensifies, underpinning market expansion.
What are the market trends shaping the Hemostats Industry?
- The expansion of healthcare infrastructure, marked by an increase in hospitals and ambulatory surgical centers, is an emerging trend. This development is poised to broaden access to surgical care and subsequently increase product demand.
- A significant trend shaping the market is the growing focus on advanced wound closure, particularly in high-risk surgical settings. This is driving the adoption of innovative biosurgical products beyond traditional methods. The expansion of healthcare infrastructure, including new surgical center expansion projects, is creating new demand channels for products like flowable hemostatic agents.
- This is complemented by the rise of minimally invasive surgery and robotic-assisted surgery, which necessitate specialized tools for endoscopic hemostasis. These technologies improve patient safety outcomes and support blood transfusion reduction efforts, with some facilities reporting up to a 20% decrease in average patient recovery times.
- This shift influences supply chain diversification as manufacturers adapt to new procedural demands involving oxidized regenerated cellulose and polysaccharide hemostat technologies.
What challenges does the Hemostats Industry face during its growth?
- A significant challenge impacting market growth is the shortage of medical personnel with the specialized training required for the effective application of advanced hemostat products.
- A key challenge is managing the complexities of medical device regulation alongside the need for robust end-user training requirements for sophisticated products. The industry's shift toward synthetic raw materials and recombinant thrombin sources, moving away from traditional bovine thrombin or porcine gelatin, introduces new manufacturing and approval hurdles.
- Furthermore, intense group purchasing organization negotiation exerts significant pricing pressure, forcing manufacturers to justify the cost of biosurgical product innovation. For example, while a new collagen-based hemostat may offer superior performance, its adoption can be slowed if it increases procedural costs by more than 5%.
- Effectively communicating long-term value, such as preventing complications in hemostasis in anticoagulated patients, is critical to overcoming these market restraints.
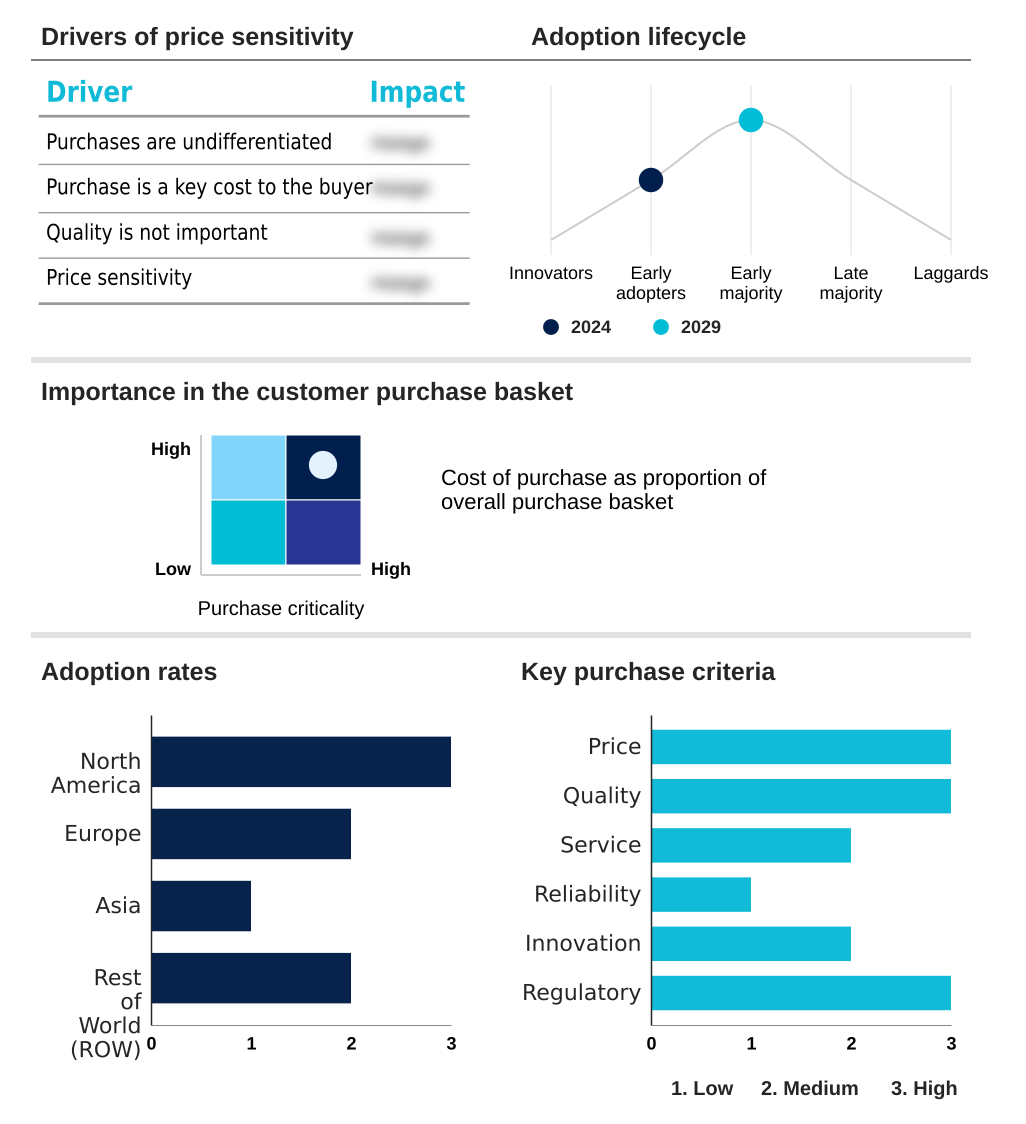
Exclusive Technavio Analysis on Customer Landscape
The hemostats market forecasting report includes the adoption lifecycle of the market, covering from the innovator’s stage to the laggard’s stage. It focuses on adoption rates in different regions based on penetration. Furthermore, the hemostats market report also includes key purchase criteria and drivers of price sensitivity to help companies evaluate and develop their market growth analysis strategies.
Customer Landscape of Hemostats Industry
Competitive Landscape
Companies are implementing various strategies, such as strategic alliances, hemostats market forecast, partnerships, mergers and acquisitions, geographical expansion, and product/service launches, to enhance their presence in the industry.
Aegis Lifesciences Pvt. Ltd. - The company provides a range of hemostatic solutions, including absorbable gelatin sponges and oxidized regenerated cellulose, designed for effective surgical bleeding control and wound management.
The industry research and growth report includes detailed analyses of the competitive landscape of the market and information about key companies, including:
- Aegis Lifesciences Pvt. Ltd.
- Artivion Inc.
- Axio Biosolutions Pvt. Ltd.
- B.Braun SE
- Baxter International Inc.
- Becton Dickinson and Co.
- CuraMedical BV
- Gelita AG
- Grayline Medical Inc.
- Integra LifeSciences Corp.
- Johnson and Johnson Services
- MBP Medical Biomaterial Products GmbH
- Pfizer Inc.
- STERIS plc
- Ted Pella Inc.
- Teleflex Inc.
- Towne Brothers Pvt. Ltd.
- World Precision Instruments
- Ydm Corp.
Qualitative and quantitative analysis of companies has been conducted to help clients understand the wider business environment as well as the strengths and weaknesses of key industry players. Data is qualitatively analyzed to categorize companies as pure play, category-focused, industry-focused, and diversified; it is quantitatively analyzed to categorize companies as dominant, leading, strong, tentative, and weak.
Recent Development and News in Hemostats market
- In September 2024, Baxter International Inc. announced the European launch of its new-generation flowable hemostatic matrix, featuring enhanced bioabsorbable materials designed for improved performance in robotic-assisted surgery.
- In November 2024, Johnson & Johnson Services completed the acquisition of a European startup specializing in polysaccharide hemostat technology, a move intended to strengthen its portfolio for trauma care bleeding management.
- In February 2025, Axio Biosolutions Pvt. Ltd. received FDA 510(k) clearance for its novel collagen-based hemostat patch designed for neurosurgery applications, marking its formal expansion into the United States market.
- In April 2025, B.Braun SE entered into a strategic partnership with a leading medical robotics firm to co-develop specialized hemostatic agent delivery systems tailored for minimally invasive cardiothoracic procedures.
Dive into Technavio’s robust research methodology, blending expert interviews, extensive data synthesis, and validated models for unparalleled Hemostats Market insights. See full methodology.
| Market Scope | |
|---|---|
| Page number | 289 |
| Base year | 2024 |
| Historic period | 2019-2023 |
| Forecast period | 2025-2029 |
| Growth momentum & CAGR | Accelerate at a CAGR of 5.8% |
| Market growth 2025-2029 | USD 910.9 million |
| Market structure | Fragmented |
| YoY growth 2024-2025(%) | 5.4% |
| Key countries | US, Canada, Mexico, Germany, UK, France, Italy, Spain, The Netherlands, China, India, Japan, South Korea, Indonesia, Thailand, Brazil, Saudi Arabia, UAE, Turkey, Argentina, Colombia, South Africa and Israel |
| Competitive landscape | Leading Companies, Market Positioning of Companies, Competitive Strategies, and Industry Risks |
Research Analyst Overview
- The hemostats market is defined by a persistent drive toward specialized solutions that enhance surgical blood loss reduction. Innovation is moving beyond simple surgical wound closure to sophisticated tissue sealing technology and active coagulation cascade activation.
- Boardroom decisions increasingly focus on portfolio diversification, weighing the R&D investment in recombinant thrombin sources against the market penetration of established oxidized regenerated cellulose products. A key performance metric is hemostatic agent efficacy in challenging scenarios, such as procedures involving post-surgical adhesion risks.
- The adoption of advanced flowable gelatin matrix products has been shown to reduce procedural complexities by over 15% in certain orthopedic applications. The development of bioabsorbable materials and synthetic raw materials is a strategic response to supply chain vulnerabilities associated with bovine thrombin and porcine gelatin, shaping the long-term competitive landscape.
- The utility of products like absorbable hemostatic powder and those for endoscopic hemostasis underscores a trend toward procedure-specific solutions.
What are the Key Data Covered in this Hemostats Market Research and Growth Report?
-
What is the expected growth of the Hemostats Market between 2025 and 2029?
-
USD 910.9 million, at a CAGR of 5.8%
-
-
What segmentation does the market report cover?
-
The report is segmented by Formulation (Matrix and gels, Sheet and pad, Sponge, and Powder), Product Type (Thrombin-based hemostats, Gelatin-based hemostats, and Collagen-based hemostats), End-user (Hospitals, ASCs, and Specialty clinics.) and Geography (North America, Europe, Asia, Rest of World (ROW))
-
-
Which regions are analyzed in the report?
-
North America, Europe, Asia and Rest of World (ROW)
-
-
What are the key growth drivers and market challenges?
-
Growing volume of surgical procedures performed, Dearth of medical personnel skilled in effective use of hemostat products
-
-
Who are the major players in the Hemostats Market?
-
Aegis Lifesciences Pvt. Ltd., Artivion Inc., Axio Biosolutions Pvt. Ltd., B.Braun SE, Baxter International Inc., Becton Dickinson and Co., CuraMedical BV, Gelita AG, Grayline Medical Inc., Integra LifeSciences Corp., Johnson and Johnson Services, MBP Medical Biomaterial Products GmbH, Pfizer Inc., STERIS plc, Ted Pella Inc., Teleflex Inc., Towne Brothers Pvt. Ltd., World Precision Instruments and Ydm Corp.
-
Market Research Insights
- The market's dynamism is driven by the increasing complexity of surgeries and the push for better patient safety outcomes. The rise of robotic-assisted surgery, now used in over 20% of general surgeries in some developed nations, demands innovative biosurgical products.
- Effective bleeding control management is critical, with some hospitals reporting a 30% reduction in blood transfusion rates after adopting advanced hemostatic agents. This shift is influenced by physician preference items and intense group purchasing organization negotiation.
- Moreover, expanding healthcare infrastructure development in emerging economies is broadening market access, requiring manufacturers to adapt their strategies for new surgical center expansion and diverse end-user training requirements.
We can help! Our analysts can customize this hemostats market research report to meet your requirements.
 RIA -
RIA - 
