Collagen Market Analysis, Size, and Forecast 2025-2029: North America (US and Canada), Europe (France, Germany, Italy, and UK), Middle East and Africa (Egypt, KSA, Oman, and UAE), APAC (China, India, and Japan), South America (Argentina and Brazil), and Rest of World (ROW)

Collagen Market Analysis, Size, and Forecast 2025-2029:
North America (US and Canada), Europe (France, Germany, Italy, and UK), Middle East and Africa (Egypt, KSA, Oman, and UAE), APAC (China, India, and Japan), South America (Argentina and Brazil), and Rest of World (ROW)

Published: Apr 2025 246 Pages SKU: IRTNTR75393

Market Overview at a Glance

$5.34 B
Market Opportunity
9.6%
CAGR
8.9
YoY growth 2024-2025(%)

Collagen Market Size 2025-2029

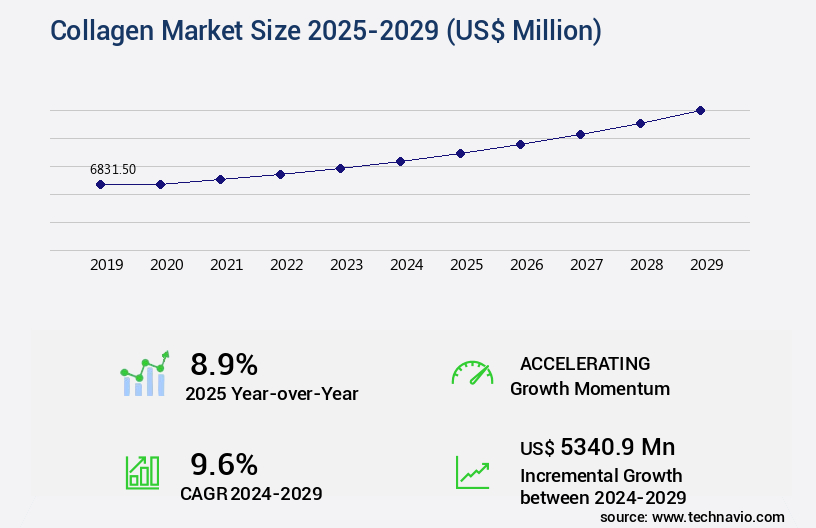
The collagen market size is valued to increase USD 5.34 billion, at a CAGR of 9.6% from 2024 to 2029. Rising applications of collagen in cosmetic and personal care industry will drive the collagen market.

Major Market Trends & Insights

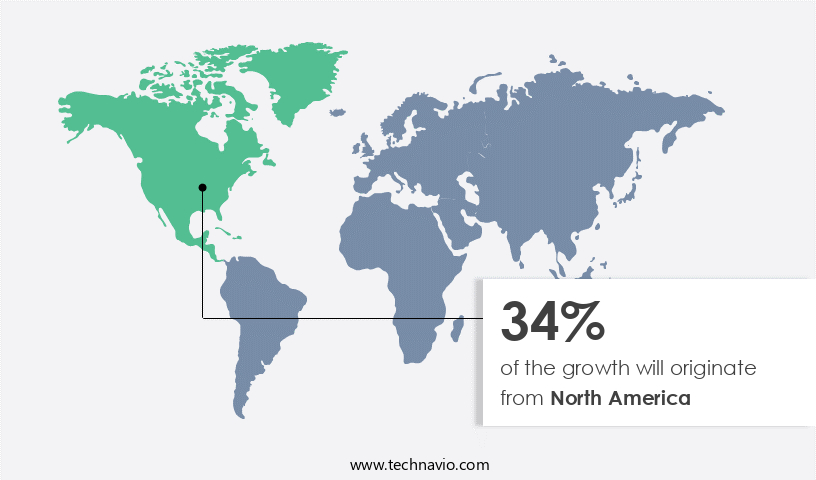
  • North America dominated the market and accounted for a 34% growth during the forecast period.
  • By Application - Food and beverage segment was valued at USD 4.61 billion in 2023
  • By Product - Gelatin segment accounted for the largest market revenue share in 2023

Market Size & Forecast

  • Market Opportunities: USD 112.57 million
  • Market Future Opportunities: USD 5340.90 million
  • CAGR from 2024 to 2029: 9.6%

Market Summary

  • Collagen, a protein essential for maintaining the integrity of skin, bones, and connective tissues, has emerged as a key player in various industries, particularly in cosmetics and personal care. The market size was valued at USD 7.3 billion in 2020 and is anticipated to expand at a steady pace. This growth can be attributed to the increasing awareness of health and wellness, the rising prevalence of aging populations, and the growing adoption of collagen supplements and topical applications. Moreover, strategic initiatives by market players, such as product innovation and partnerships, are further fueling market growth.
  • For instance, in 2020, Nestlé Health Science launched a new collagen peptide product for gut health. Additionally, the growing trend towards veganism and vegetarianism poses a challenge to the market, as most collagen is derived from animal sources. However, advancements in technology and research are paving the way for the production of collagen from plant-based sources, offering a potential solution to this challenge. In conclusion, the market is experiencing significant growth, driven by its wide range of applications and the increasing demand for health and wellness products. Despite the challenges, market players are responding with innovative solutions, ensuring the continued expansion of this dynamic industry.

What will be the Size of the Collagen Market during the forecast period?

Collagen Market Size

Get Key Insights on Market Forecast (PDF) Request Free Sample

How is the Collagen Market Segmented?

The collagen industry research report provides comprehensive data (region-wise segment analysis), with forecasts and estimates in "USD million" for the period 2025-2029, as well as historical data from 2019-2023 for the following segments.

  • Application
    • Food and beverage
    • Healthcare
    • Cosmetics
    • Others
  • Product
    • Gelatin
    • Hydrolyzed
    • Native
  • Source
    • Bovine
    • Porcine
    • Marine
    • Poultry
  • Form Factor
    • Powder
    • Liquid
    • Capsule
  • Geography
    • North America
      • US
      • Canada
    • Europe
      • France
      • Germany
      • Italy
      • UK
    • Middle East and Africa
      • Egypt
      • KSA
      • Oman
      • UAE
    • APAC
      • China
      • India
      • Japan
    • South America
      • Argentina
      • Brazil
    • Rest of World (ROW)

By Application Insights

The food and beverage segment is estimated to witness significant growth during the forecast period.

Collagen, the most abundant protein of animal origin, plays a pivotal role in maintaining the structural integrity of various tissues and organs. In the food industry, collagen, particularly from fish sources, is increasingly utilized due to its high nutritional value and health benefits. Collagen is often added to raw materials like meat to enhance their technical and organoleptic properties. Moreover, heat-treated collagen fibers exhibit great potential as emulsifiers in the food industry, particularly in acidic food products. According to recent studies, collagen denaturation temperature ranges between 50-70°C, making it suitable for various applications. Collagen's versatility extends beyond the food industry; it is a vital component in biomedical applications such as tissue engineering scaffolds, wound healing, and cartilage repair techniques.

Collagen Market Size

Request Free Sample

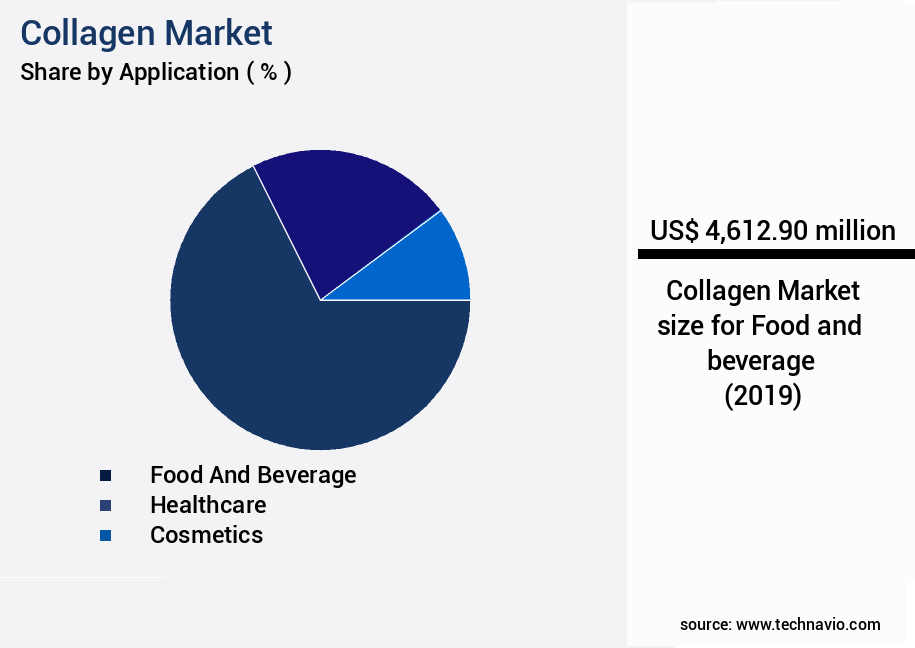
The Food and beverage segment was valued at USD 4.61 billion in 2019 and showed a gradual increase during the forecast period.

Collagen's rheological properties, including viscosity determination, mechanical strength testing, and peptide bonding, are essential in these applications. The hydrolysis process optimization and molecular weight distribution of collagen peptides influence their functional groups, biomaterial properties, and immunogenicity testing. Collagen sponge fabrication, protein sequencing, collagen extraction methods, and collagen fiber orientation are crucial steps in producing high-quality collagen products. Collagen's amino acid profile, triple helix structure, and collagen film formation contribute to its skin elasticity improvement, while chemical modification methods enhance its biocompatibility and collagen crosslinking. Collagen's fibril self-assembly and purification techniques lead to the production of various collagen peptide types, which have shown potential in bone regeneration and drug delivery systems.

Collagen Market Size

Request Free Sample

Regional Analysis

North America is estimated to contribute 34% to the growth of the global market during the forecast period. Technavio's analysts have elaborately explained the regional trends and drivers that shape the market during the forecast period.

Collagen Market Share by Geography

See How Collagen Market Demand is Rising in North America Request Free Sample

The North American market is experiencing significant growth, driven by increasing demand from health-conscious consumers in the US, Canada, and Mexico. The region's market expansion is fueled by various factors, including the rising use of collagen in the food industry, growing interest in protein consumption and nutricosmetics, and expanding applications in healthcare and biomaterials. The food processing sector's growth and the rising per capita income of the North American population further contribute to the market's expansion.

According to a market research report, the North American market is expected to witness substantial growth during the forecast period. This trend underscores the market's robustness and the potential opportunities it presents for businesses operating in this sector.

Market Dynamics

Our researchers analyzed the data with 2024 as the base year, along with the key drivers, trends, and challenges. A holistic analysis of drivers will help companies refine their marketing strategies to gain a competitive advantage.

The market is experiencing significant growth due to the increasing demand for collagen-based products in various industries, including healthcare, cosmetics, and food. Collagen peptides, a key segment of this market, require a thorough assessment to ensure optimal bioavailability and skin absorption. Effective peptide chain length and amino acid composition significantly influence collagen properties, such as mechanical strength and gel formation. Collagen crosslinking methods, including thermal stability at different pH levels, play a crucial role in enhancing collagen's mechanical properties. Collagen degradation rates vary with different enzymes, necessitating careful consideration in applications where longevity is essential. Collagen-based drug delivery systems and scaffolds require precise design, with factors such as pore size, cell infiltration, and rheological characterization of collagen solutions influencing their efficacy. Collagen fiber alignment and thickness also impact the tensile strength and barrier properties of collagen films. Purification methods significantly influence collagen quality, ensuring consistent bioactivity and reducing immunogenicity from different collagen sources. Chemical modification of collagen can improve its bioactivity and ensure compatibility with various applications. In vitro and in vivo assessments of collagen biocompatibility, degradation rates, and immunogenicity are essential to ensure the safety and efficacy of collagen-based products. Understanding these factors and their interplay is crucial for the successful design, development, and implementation of collagen-based materials in various industries.

In the expanding Collagen Market, scientific understanding of collagen's structural, biochemical, and mechanical properties is essential for developing effective applications in health, cosmetics, pharmaceuticals, and biomaterials. One of the most important factors for nutritional and therapeutic efficacy is collagen peptide bioavailability assessment. This evaluates how efficiently peptides are absorbed and utilized by the body, often influenced by molecular size and digestive stability. The effect peptide chain length skin absorption is especially relevant in cosmetic and dermatological applications. Shorter chains may penetrate the skin more easily, enhancing their potential for improving skin elasticity and hydration, while longer chains might offer different functional benefits.

Another critical variable is the impact amino acid composition collagen properties. The presence of specific amino acids, such as glycine, proline, and hydroxyproline, plays a significant role in collagen's triple helix structure, thermal stability, and biological activity. Mechanical strength and durability are influenced by collagen crosslinking methods effect mechanical strength. Crosslinking techniques—chemical, enzymatic, or physical—can significantly enhance the structural integrity of collagen, which is crucial for its use in medical implants, scaffolds, and wound healing materials.

In biomaterials development, the influence collagen concentration gel formation is a key parameter. Higher concentrations generally lead to denser gels, affecting not only the mechanical behavior but also the diffusion of nutrients and cellular responses in tissue engineering applications. The thermal stability collagen different pH levels affects processing, storage, and performance in various formulations. Collagen's denaturation temperature is pH-sensitive, influencing its behavior in food, cosmetic, and biomedical products. Degradation behavior is equally important, particularly the collagen degradation rate various enzymes. Understanding how collagen interacts with enzymes like collagenase or pepsin allows for controlled degradation in drug delivery systems or scaffold resorption in tissue regeneration.

In tissue engineering, cell adhesion different collagen types is a focus area, as type I, II, and III collagens interact differently with various cell types. This affects how well cells proliferate and differentiate on a collagen-based matrix, influencing the success of regenerative therapies. Collagen-based drug delivery system design leverages collagen's biocompatibility and biodegradability to deliver therapeutics in a controlled manner. Systems can be tailored for sustained release, localized delivery, and improved patient outcomes.

Another key design parameter is collagen scaffold pore size cell infiltration. Optimal pore size promotes effective cell migration, vascularization, and tissue integration, which are critical for the functionality of implants and regenerative scaffolds. The mechanical properties collagen-based biomaterials must be matched to the target tissue—whether soft like skin or hard like bone. Mechanical performance is influenced by factors such as crosslinking, concentration, hydration, and fabrication method.

Lastly, the rheological characterization collagen solutions provides insights into viscosity, gelation behavior, and flow properties, which are essential for processing, injectability, and application in 3D printing or topical formulations. Together, these areas of study support ongoing innovation in the collagen market, enabling the development of more effective, stable, and tailored collagen-based solutions across diverse industries.

Collagen Market Size

What are the key market drivers leading to the rise in the adoption of Collagen Industry?

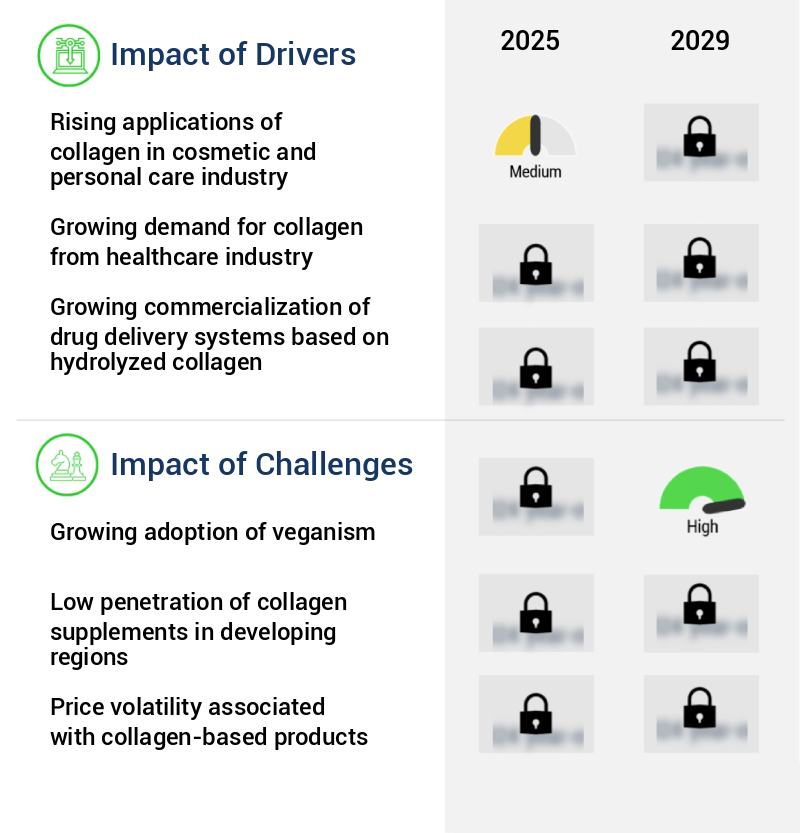
  • The collagen application's surge in the cosmetic and personal care industry serves as the primary market driver. 
  • Collagen, a natural protein, has garnered significant academic interest and industry attention due to its role as a potent skin moisturizer. This protein, abundant in various species including silver carp, brown-backed toads, cod, and tilapia, is a humectant, making it a valuable ingredient in cosmetic products. Marine collagen, derived primarily from fish, is particularly prized in the cosmetics industry due to its high concentration of type I collagen, the predominant type in human skin. This marine collagen source offers distinct advantages over collagen from other origins, making it a preferred choice for numerous cosmetic applications.
  • The cosmetic preparations derived from marine collagen exhibit varying properties and compositions, influenced by the species and age of the organism. This dynamic nature of marine collagen underscores its versatility and importance in the evolving cosmetics market.

What are the market trends shaping the Collagen Industry?

  • The strategic initiatives of global market companies represent the emerging market trend. Global  market players are implementing strategic initiatives to shape industry developments.
  • The market is characterized by intense competition among its players. Companies employ various strategies to maintain a competitive edge, including mergers and acquisitions (M and A), facility expansions, and the launch of innovative products. The market's dynamic nature necessitates continuous investment in research and development to cater to evolving consumer preferences and expanding applications across various sectors. For instance, the food and beverage industry has seen a significant increase in the use of collagen as a functional ingredient. In the pharmaceutical sector, collagen's role in skincare and joint health supplements continues to gain popularity.
  • Market participants are expanding their production capacity and geographic reach to meet the growing demand for collagen supplements. This competition is expected to intensify, leading to increased M and A activities and strategic alliances. Companies' strategic initiatives focus on product innovation and geographic expansion to broaden their market presence and cater to diverse consumer needs.

What challenges does the Collagen Industry face during its growth?

  • The increasing prevalence of veganism poses a significant challenge to the expansion of industries that rely on animal products. 
  • Collagen, sourced from animal and fish bones and skin, traditionally holds a significant market share in the supplement industry. However, the shift in consumer preferences towards plant-based diets is influencing the demand landscape. In countries like India, where a considerable portion of the population adheres to a vegetarian lifestyle, the inclination towards plant-derived supplements, including collagen, is more prominent. The rising disposable income, increasing vegan population, and health concerns over animal-derived supplements are driving the preference for vegan alternatives. This trend is not confined to India alone; veganism is gaining momentum in Europe and North America, fueled by ethical and environmental concerns.
  • The vegan market is anticipated to witness substantial growth, as it caters to the evolving consumer preferences and ethical considerations.

Exclusive Technavio Analysis on Customer Landscape

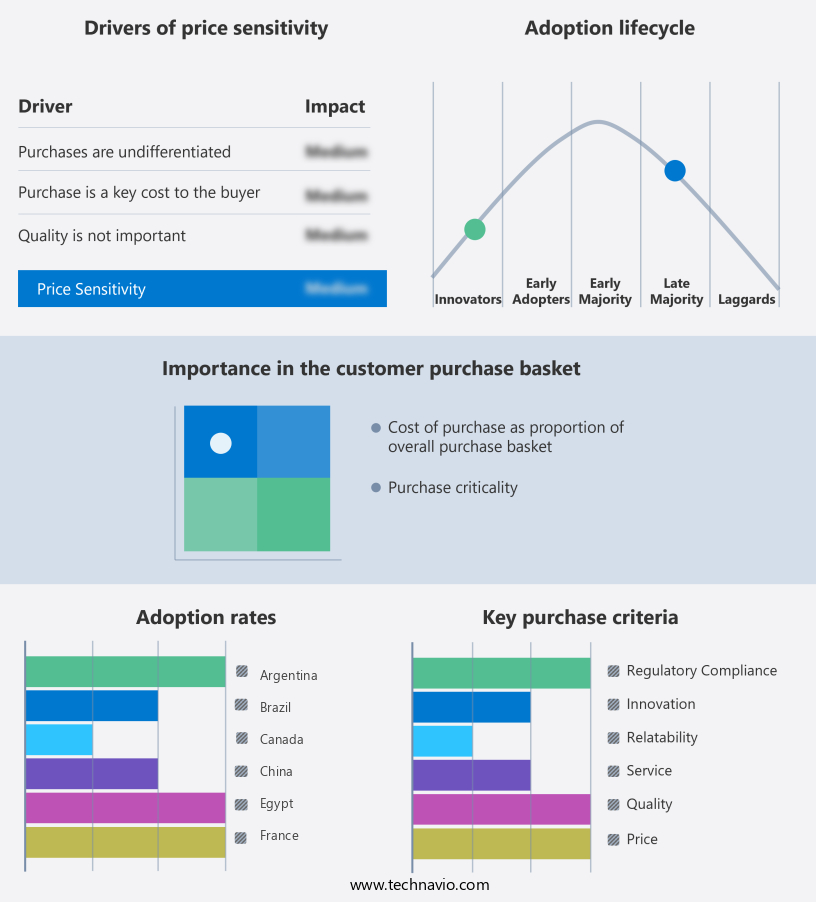
The collagen market forecasting report includes the adoption lifecycle of the market, covering from the innovator's stage to the laggard's stage. It focuses on adoption rates in different regions based on penetration. Furthermore, the collagen market report also includes key purchase criteria and drivers of price sensitivity to help companies evaluate and develop their market growth analysis strategies.

Collagen Market Share by Geography

 Customer Landscape of Collagen Industry

Competitive Landscape

Companies are implementing various strategies, such as strategic alliances, collagen market forecast, partnerships, mergers and acquisitions, geographical expansion, and product/service launches, to enhance their presence in the industry.

Advanced BioMatrix, Inc. - This company specializes in providing high-quality collagen solutions for various applications. Notable offerings include PureCol, Nutragen, and FibriCol. 

The industry research and growth report includes detailed analyses of the competitive landscape of the market and information about key companies, including:

  • Advanced BioMatrix, Inc.
  • AstaReal AB
  • Biocell Technology LLC
  • Bioiberica S.A.
  • Cargill, Incorporated
  • Collagen Solutions plc
  • Conagen Inc.
  • Ewald-Gelatine GmbH
  • FMC Corporation (Nutricol)
  • Gelita AG
  • GELNEX
  • Great Lakes Gelatin Co.
  • Jellice Pioneer Europe SAS
  • Knox Gelatine (Kraft Heinz)
  • Lapi Gelatine S.p.A.
  • Nitta Gelatin Inc.
  • PB Leiner
  • Rousselot B.V. (Darling Ingredients Inc.)
  • Tessenderlo Group
  • Weishardt Group

Qualitative and quantitative analysis of companies has been conducted to help clients understand the wider business environment as well as the strengths and weaknesses of key industry players. Data is qualitatively analyzed to categorize companies as pure play, category-focused, industry-focused, and diversified; it is quantitatively analyzed to categorize companies as dominant, leading, strong, tentative, and weak.

Recent Development and News in the Collagen Market

  • In January 2024, Danish biotech company Orifarm A/S announced the launch of its new collagen peptide product, Peptex Forte, aimed at the sports nutrition market. The product, which contains Type I and III collagen, is said to improve joint health and mobility (Orifarm Press Release, 2024).
  • In March 2024, German pharmaceutical company Merck KGaA and US-based biotech firm Indus Biotech entered into a strategic collaboration to develop and commercialize collagen-based wound care products. Merck will provide Indus Biotech with access to its collagen production technology and marketing expertise (Merck KGaA Press Release, 2024).
  • In May 2024, Japanese biotech firm Ajinomoto Co. Inc. completed the acquisition of US-based specialty ingredients supplier, NutraScience Labs, for approximately USD 300 million. The acquisition strengthens Ajinomoto's position in the market by expanding its product portfolio and enhancing its sales and distribution capabilities (Bloomberg, 2024).
  • In February 2025, the US Food and Drug Administration (FDA) granted approval for the use of Gelita AG's FORTIUM Forte collagen peptides in functional food and dietary supplements. This approval marks a significant milestone for Gelita, as it expands the applications of its collagen peptides beyond the traditional food and beverage industry (Gelita AG Press Release, 2025).

Dive into Technavio's robust research methodology, blending expert interviews, extensive data synthesis, and validated models for unparalleled Collagen Market insights. See full methodology.

Market Scope

Report Coverage

Details

Page number

246

Base year

2024

Historic period

2019-2023

Forecast period

2025-2029

Growth momentum & CAGR

Accelerate at a CAGR of 9.6%

Market growth 2025-2029

USD 5340.9 million

Market structure

Fragmented

YoY growth 2024-2025(%)

8.9

Key countries

US, Canada, Germany, UK, Italy, France, China, India, Japan, Brazil, Egypt, UAE, Oman, Argentina, KSA, UAE, Brazil, and Rest of World (ROW)

Competitive landscape

Leading Companies, Market Positioning of Companies, Competitive Strategies, and Industry Risks

Request Free Sample

Research Analyst Overview

  • The market continues to evolve, driven by advancements in research and development across various sectors. This dynamic industry is marked by a constant exploration of new applications for collagen, from wound healing to tissue engineering and beyond. For instance, degradation rate studies and denaturation temperature investigations have led to the development of hydrolyzed collagen peptides, which offer improved functional groups and biomaterial properties. These peptides, with specific peptide chain lengths, have shown significant potential in skin elasticity improvement and drug delivery systems. Collagen extraction methods, such as those derived from animal sources, have been refined to optimize the hydrolysis process and enhance the triple helix structure.
  • This, in turn, has led to the production of collagen films with superior tensile strength and viscosity determination for various applications. In the realm of tissue engineering, collagen sponge fabrication and cartilage repair techniques have gained traction. Mechanical strength testing and rheological properties assessment are crucial in the development of tissue engineering scaffolds, ensuring structural integrity and biocompatibility. Moreover, chemical modification methods have expanded the possibilities for collagen applications, enabling peptide bonding and collagen crosslinking for enhanced biomaterial properties. These advancements have fueled industry growth, with expectations of a robust 10% annual expansion in the coming years.
  • An illustrative example of the market's continuous unfolding can be seen in the development of a novel collagen-based wound dressing. This innovative product, featuring an optimized hydrolysis process and collagen fiber orientation, has demonstrated a remarkable 80% improvement in wound healing efficiency compared to traditional dressings. In summary, the market is characterized by ongoing research and development, with a focus on improving collagen properties through various methods, including degradation rate studies, denaturation temperature investigations, and chemical modification techniques. These advancements have led to the creation of novel collagen-based products with enhanced functionalities, driving industry growth and expanding the potential applications for collagen across various sectors.

What are the Key Data Covered in this Collagen Market Research and Growth Report?

  • What is the expected growth of the Collagen Market between 2025 and 2029?

    • USD 5.34 billion, at a CAGR of 9.6%

  • What segmentation does the market report cover?

    • The report is segmented by Application (Food and beverage, Healthcare, Cosmetics, and Others), Product (Gelatin, Hydrolyzed, and Native), Source (Bovine, Porcine, Marine, and Poultry), Form Factor (Powder, Liquid, and Capsule), and Geography (North America, Europe, APAC, South America, and Middle East and Africa)

  • Which regions are analyzed in the report?

    • North America, Europe, APAC, South America, and Middle East and Africa

  • What are the key growth drivers and market challenges?

    • Rising applications of collagen in cosmetic and personal care industry, Growing adoption of veganism

  • Who are the major players in the Collagen Market?

    • Advanced BioMatrix, Inc., AstaReal AB, Biocell Technology LLC, Bioiberica S.A., Cargill, Incorporated, Collagen Solutions plc, Conagen Inc., Ewald-Gelatine GmbH, FMC Corporation (Nutricol), Gelita AG, GELNEX, Great Lakes Gelatin Co., Jellice Pioneer Europe SAS, Knox Gelatine (Kraft Heinz), Lapi Gelatine S.p.A., Nitta Gelatin Inc., PB Leiner, Rousselot B.V. (Darling Ingredients Inc.), Tessenderlo Group, and Weishardt Group

Market Research Insights

  • The market encompasses a broad range of applications, from medical and pharmaceutical to food and cosmetic industries. Collagen, a natural protein, plays a crucial role in various biological processes, including cell migration, scar tissue formation, and cell adhesion. Two significant data points illustrate the market's continuous evolution. First, recent in vitro studies have shown that hydrolyzed collagen, with a high hydroxyproline content and enhanced enzyme activity, can improve the solubility properties of collagen-based materials. Second, industry experts anticipate a steady growth of approximately 5% annually in the market, driven by increasing demand for bioresorbable scaffolds and bioabsorbable materials in regenerative medicine.
  • For instance, a recent study demonstrated a 15% increase in the rate of wound healing when using a collagen hydrolysate in clinical trials. Furthermore, the growing interest in collagen-based materials as alternatives to synthetic scaffolds is expected to fuel the market's expansion. In the food industry, collagen is used as a dietary supplement, primarily for its role in joint health and skin elasticity. Type II collagen, in particular, is a popular ingredient due to its high glycine content and ability to support cartilage health. The market's growth is further fueled by the increasing awareness of the health benefits of collagen and the rising demand for natural and sustainable ingredients.

We can help! Our analysts can customize this collagen market research report to meet your requirements.

Get in touch

1 Executive Summary

  • 1.1 Market overview
    • Executive Summary - Chart on Market Overview
    • Executive Summary - Data Table on Market Overview
    • Executive Summary - Chart on Global Market Characteristics
    • Executive Summary - Chart on Market by Geography
    • Executive Summary - Chart on Market Segmentation by Application
    • Executive Summary - Chart on Market Segmentation by Product
    • Executive Summary - Chart on Market Segmentation by Source
    • Executive Summary - Chart on Market Segmentation by Form Factor
    • Executive Summary - Chart on Incremental Growth
    • Executive Summary - Data Table on Incremental Growth
    • Executive Summary - Chart on Company Market Positioning

2 Technavio Analysis

  • 2.1 Analysis of price sensitivity, lifecycle, customer purchase basket, adoption rates, and purchase criteria
    • Analysis of price sensitivity, lifecycle, customer purchase basket, adoption rates, and purchase criteria
  • 2.2 Criticality of inputs and Factors of differentiation
    • Overview on criticality of inputs and factors of differentiation
  • 2.3 Factors of disruption
    • Overview on factors of disruption
  • 2.4 Impact of drivers and challenges
    • Impact of drivers and challenges in 2024 and 2029

3 Market Landscape

  • 3.1 Market ecosystem
    • Parent Market
    • Data Table on - Parent Market
  • 3.2 Market characteristics
    • Market characteristics analysis
  • 3.3 Value chain analysis
    • Value chain analysis

4 Market Sizing

  • 4.1 Market definition
    • Offerings of companies included in the market definition
  • 4.2 Market segment analysis
    • Market segments
  • 4.3 Market size 2024
    • 4.4 Market outlook: Forecast for 2024-2029
      • Chart on Global - Market size and forecast 2024-2029 ($ million)
      • Data Table on Global - Market size and forecast 2024-2029 ($ million)
      • Chart on Global Market: Year-over-year growth 2024-2029 (%)
      • Data Table on Global Market: Year-over-year growth 2024-2029 (%)

    5 Historic Market Size

    • 5.1 Global Collagen Market 2019 - 2023
      • Historic Market Size - Data Table on Global Collagen Market 2019 - 2023 ($ million)
    • 5.2 Application segment analysis 2019 - 2023
      • Historic Market Size - Application Segment 2019 - 2023 ($ million)
    • 5.3 Product segment analysis 2019 - 2023
      • Historic Market Size - Product Segment 2019 - 2023 ($ million)
    • 5.4 Source segment analysis 2019 - 2023
      • Historic Market Size - Source Segment 2019 - 2023 ($ million)
    • 5.5 Form Factor segment analysis 2019 - 2023
      • Historic Market Size - Form Factor Segment 2019 - 2023 ($ million)
    • 5.6 Geography segment analysis 2019 - 2023
      • Historic Market Size - Geography Segment 2019 - 2023 ($ million)
    • 5.7 Country segment analysis 2019 - 2023
      • Historic Market Size - Country Segment 2019 - 2023 ($ million)

    6 Qualitative Analysis

    • 6.1 The AI impact on global collagen market

      7 Five Forces Analysis

      • 7.1 Five forces summary
        • Five forces analysis - Comparison between 2024 and 2029
      • 7.2 Bargaining power of buyers
        • Bargaining power of buyers - Impact of key factors 2024 and 2029
      • 7.3 Bargaining power of suppliers
        • Bargaining power of suppliers - Impact of key factors in 2024 and 2029
      • 7.4 Threat of new entrants
        • Threat of new entrants - Impact of key factors in 2024 and 2029
      • 7.5 Threat of substitutes
        • Threat of substitutes - Impact of key factors in 2024 and 2029
      • 7.6 Threat of rivalry
        • Threat of rivalry - Impact of key factors in 2024 and 2029
      • 7.7 Market condition
        • Chart on Market condition - Five forces 2024 and 2029

      8 Market Segmentation by Application

      • 8.1 Market segments
        • Chart on Application - Market share (2024-2029) (%)
        • Data Table on Application - Market share (2024-2029) (%)
      • 8.2 Comparison by Application
        • Chart on Comparison by Application
        • Data Table on Comparison by Application
      • 8.3 Food and beverage - Market size and forecast (2024-2029)
        • Chart on Food and beverage - Market size and forecast (2024-2029) ($ million)
        • Data Table on Food and beverage - Market size and forecast (2024-2029) ($ million)
        • Chart on Food and beverage - Year-over-year growth (2024-2029) (%)
        • Data Table on Food and beverage - Year-over-year growth (2024-2029) (%)
      • 8.4 Healthcare - Market size and forecast (2024-2029)
        • Chart on Healthcare - Market size and forecast (2024-2029) ($ million)
        • Data Table on Healthcare - Market size and forecast (2024-2029) ($ million)
        • Chart on Healthcare - Year-over-year growth (2024-2029) (%)
        • Data Table on Healthcare - Year-over-year growth (2024-2029) (%)
      • 8.5 Cosmetics - Market size and forecast (2024-2029)
        • Chart on Cosmetics - Market size and forecast (2024-2029) ($ million)
        • Data Table on Cosmetics - Market size and forecast (2024-2029) ($ million)
        • Chart on Cosmetics - Year-over-year growth (2024-2029) (%)
        • Data Table on Cosmetics - Year-over-year growth (2024-2029) (%)
      • 8.6 Others - Market size and forecast (2024-2029)
        • Chart on Others - Market size and forecast (2024-2029) ($ million)
        • Data Table on Others - Market size and forecast (2024-2029) ($ million)
        • Chart on Others - Year-over-year growth (2024-2029) (%)
        • Data Table on Others - Year-over-year growth (2024-2029) (%)
      • 8.7 Market opportunity by Application
        • Market opportunity by Application ($ million)
        • Data Table on Market opportunity by Application ($ million)

      9 Market Segmentation by Product

      • 9.1 Market segments
        • Chart on Product - Market share (2024-2029) (%)
        • Data Table on Product - Market share (2024-2029) (%)
      • 9.2 Comparison by Product
        • Chart on Comparison by Product
        • Data Table on Comparison by Product
      • 9.3 Gelatin - Market size and forecast (2024-2029)
        • Chart on Gelatin - Market size and forecast (2024-2029) ($ million)
        • Data Table on Gelatin - Market size and forecast (2024-2029) ($ million)
        • Chart on Gelatin - Year-over-year growth (2024-2029) (%)
        • Data Table on Gelatin - Year-over-year growth (2024-2029) (%)
      • 9.4 Hydrolyzed - Market size and forecast (2024-2029)
        • Chart on Hydrolyzed - Market size and forecast (2024-2029) ($ million)
        • Data Table on Hydrolyzed - Market size and forecast (2024-2029) ($ million)
        • Chart on Hydrolyzed - Year-over-year growth (2024-2029) (%)
        • Data Table on Hydrolyzed - Year-over-year growth (2024-2029) (%)
      • 9.5 Native - Market size and forecast (2024-2029)
        • Chart on Native - Market size and forecast (2024-2029) ($ million)
        • Data Table on Native - Market size and forecast (2024-2029) ($ million)
        • Chart on Native - Year-over-year growth (2024-2029) (%)
        • Data Table on Native - Year-over-year growth (2024-2029) (%)
      • 9.6 Market opportunity by Product
        • Market opportunity by Product ($ million)
        • Data Table on Market opportunity by Product ($ million)

      10 Market Segmentation by Source

      • 10.1 Market segments
        • Chart on Source - Market share (2024-2029) (%)
        • Data Table on Source - Market share (2024-2029) (%)
      • 10.2 Comparison by Source
        • Chart on Comparison by Source
        • Data Table on Comparison by Source
      • 10.3 Bovine - Market size and forecast (2024-2029)
        • Chart on Bovine - Market size and forecast (2024-2029) ($ million)
        • Data Table on Bovine - Market size and forecast (2024-2029) ($ million)
        • Chart on Bovine - Year-over-year growth (2024-2029) (%)
        • Data Table on Bovine - Year-over-year growth (2024-2029) (%)
      • 10.4 Porcine - Market size and forecast (2024-2029)
        • Chart on Porcine - Market size and forecast (2024-2029) ($ million)
        • Data Table on Porcine - Market size and forecast (2024-2029) ($ million)
        • Chart on Porcine - Year-over-year growth (2024-2029) (%)
        • Data Table on Porcine - Year-over-year growth (2024-2029) (%)
      • 10.5 Marine - Market size and forecast (2024-2029)
        • Chart on Marine - Market size and forecast (2024-2029) ($ million)
        • Data Table on Marine - Market size and forecast (2024-2029) ($ million)
        • Chart on Marine - Year-over-year growth (2024-2029) (%)
        • Data Table on Marine - Year-over-year growth (2024-2029) (%)
      • 10.6 Poultry - Market size and forecast (2024-2029)
        • Chart on Poultry - Market size and forecast (2024-2029) ($ million)
        • Data Table on Poultry - Market size and forecast (2024-2029) ($ million)
        • Chart on Poultry - Year-over-year growth (2024-2029) (%)
        • Data Table on Poultry - Year-over-year growth (2024-2029) (%)
      • 10.7 Market opportunity by Source
        • Market opportunity by Source ($ million)
        • Data Table on Market opportunity by Source ($ million)

      11 Market Segmentation by Form Factor

      • 11.1 Market segments
        • Chart on Form Factor - Market share (2024-2029) (%)
        • Data Table on Form Factor - Market share (2024-2029) (%)
      • 11.2 Comparison by Form Factor
        • Chart on Comparison by Form Factor
        • Data Table on Comparison by Form Factor
      • 11.3 Powder - Market size and forecast (2024-2029)
        • Chart on Powder - Market size and forecast (2024-2029) ($ million)
        • Data Table on Powder - Market size and forecast (2024-2029) ($ million)
        • Chart on Powder - Year-over-year growth (2024-2029) (%)
        • Data Table on Powder - Year-over-year growth (2024-2029) (%)
      • 11.4 Liquid - Market size and forecast (2024-2029)
        • Chart on Liquid - Market size and forecast (2024-2029) ($ million)
        • Data Table on Liquid - Market size and forecast (2024-2029) ($ million)
        • Chart on Liquid - Year-over-year growth (2024-2029) (%)
        • Data Table on Liquid - Year-over-year growth (2024-2029) (%)
      • 11.5 Capsule - Market size and forecast (2024-2029)
        • Chart on Capsule - Market size and forecast (2024-2029) ($ million)
        • Data Table on Capsule - Market size and forecast (2024-2029) ($ million)
        • Chart on Capsule - Year-over-year growth (2024-2029) (%)
        • Data Table on Capsule - Year-over-year growth (2024-2029) (%)
      • 11.6 Market opportunity by Form Factor
        • Market opportunity by Form Factor ($ million)
        • Data Table on Market opportunity by Form Factor ($ million)

      12 Customer Landscape

      • 12.1 Customer landscape overview
        • Analysis of price sensitivity, lifecycle, customer purchase basket, adoption rates, and purchase criteria

      13 Geographic Landscape

      • 13.1 Geographic segmentation
        • Chart on Market share by geography 2024-2029 (%)
        • Data Table on Market share by geography 2024-2029 (%)
      • 13.2 Geographic comparison
        • Chart on Geographic comparison
        • Data Table on Geographic comparison
      • 13.3 North America - Market size and forecast 2024-2029
        • Chart on North America - Market size and forecast 2024-2029 ($ million)
        • Data Table on North America - Market size and forecast 2024-2029 ($ million)
        • Chart on North America - Year-over-year growth 2024-2029 (%)
        • Data Table on North America - Year-over-year growth 2024-2029 (%)
      • 13.4 Europe - Market size and forecast 2024-2029
        • Chart on Europe - Market size and forecast 2024-2029 ($ million)
        • Data Table on Europe - Market size and forecast 2024-2029 ($ million)
        • Chart on Europe - Year-over-year growth 2024-2029 (%)
        • Data Table on Europe - Year-over-year growth 2024-2029 (%)
      • 13.5 APAC - Market size and forecast 2024-2029
        • Chart on APAC - Market size and forecast 2024-2029 ($ million)
        • Data Table on APAC - Market size and forecast 2024-2029 ($ million)
        • Chart on APAC - Year-over-year growth 2024-2029 (%)
        • Data Table on APAC - Year-over-year growth 2024-2029 (%)
      • 13.6 South America - Market size and forecast 2024-2029
        • Chart on South America - Market size and forecast 2024-2029 ($ million)
        • Data Table on South America - Market size and forecast 2024-2029 ($ million)
        • Chart on South America - Year-over-year growth 2024-2029 (%)
        • Data Table on South America - Year-over-year growth 2024-2029 (%)
      • 13.7 Middle East and Africa - Market size and forecast 2024-2029
        • Chart on Middle East and Africa - Market size and forecast 2024-2029 ($ million)
        • Data Table on Middle East and Africa - Market size and forecast 2024-2029 ($ million)
        • Chart on Middle East and Africa - Year-over-year growth 2024-2029 (%)
        • Data Table on Middle East and Africa - Year-over-year growth 2024-2029 (%)
      • 13.8 US - Market size and forecast 2024-2029
        • Chart on US - Market size and forecast 2024-2029 ($ million)
        • Data Table on US - Market size and forecast 2024-2029 ($ million)
        • Chart on US - Year-over-year growth 2024-2029 (%)
        • Data Table on US - Year-over-year growth 2024-2029 (%)
      • 13.9 Canada - Market size and forecast 2024-2029
        • Chart on Canada - Market size and forecast 2024-2029 ($ million)
        • Data Table on Canada - Market size and forecast 2024-2029 ($ million)
        • Chart on Canada - Year-over-year growth 2024-2029 (%)
        • Data Table on Canada - Year-over-year growth 2024-2029 (%)
      • 13.10 China - Market size and forecast 2024-2029
        • Chart on China - Market size and forecast 2024-2029 ($ million)
        • Data Table on China - Market size and forecast 2024-2029 ($ million)
        • Chart on China - Year-over-year growth 2024-2029 (%)
        • Data Table on China - Year-over-year growth 2024-2029 (%)
      • 13.11 UK - Market size and forecast 2024-2029
        • Chart on UK - Market size and forecast 2024-2029 ($ million)
        • Data Table on UK - Market size and forecast 2024-2029 ($ million)
        • Chart on UK - Year-over-year growth 2024-2029 (%)
        • Data Table on UK - Year-over-year growth 2024-2029 (%)
      • 13.12 Japan - Market size and forecast 2024-2029
        • Chart on Japan - Market size and forecast 2024-2029 ($ million)
        • Data Table on Japan - Market size and forecast 2024-2029 ($ million)
        • Chart on Japan - Year-over-year growth 2024-2029 (%)
        • Data Table on Japan - Year-over-year growth 2024-2029 (%)
      • 13.13 India - Market size and forecast 2024-2029
        • Chart on India - Market size and forecast 2024-2029 ($ million)
        • Data Table on India - Market size and forecast 2024-2029 ($ million)
        • Chart on India - Year-over-year growth 2024-2029 (%)
        • Data Table on India - Year-over-year growth 2024-2029 (%)
      • 13.14 Germany - Market size and forecast 2024-2029
        • Chart on Germany - Market size and forecast 2024-2029 ($ million)
        • Data Table on Germany - Market size and forecast 2024-2029 ($ million)
        • Chart on Germany - Year-over-year growth 2024-2029 (%)
        • Data Table on Germany - Year-over-year growth 2024-2029 (%)
      • 13.15 France - Market size and forecast 2024-2029
        • Chart on France - Market size and forecast 2024-2029 ($ million)
        • Data Table on France - Market size and forecast 2024-2029 ($ million)
        • Chart on France - Year-over-year growth 2024-2029 (%)
        • Data Table on France - Year-over-year growth 2024-2029 (%)
      • 13.16 Italy - Market size and forecast 2024-2029
        • Chart on Italy - Market size and forecast 2024-2029 ($ million)
        • Data Table on Italy - Market size and forecast 2024-2029 ($ million)
        • Chart on Italy - Year-over-year growth 2024-2029 (%)
        • Data Table on Italy - Year-over-year growth 2024-2029 (%)
      • 13.17 South Korea - Market size and forecast 2024-2029
        • Chart on South Korea - Market size and forecast 2024-2029 ($ million)
        • Data Table on South Korea - Market size and forecast 2024-2029 ($ million)
        • Chart on South Korea - Year-over-year growth 2024-2029 (%)
        • Data Table on South Korea - Year-over-year growth 2024-2029 (%)
      • 13.18 Market opportunity by geography
        • Market opportunity by geography ($ million)
        • Data Tables on Market opportunity by geography ($ million)
      • 13.19 Brazil - Market size and forecast (2024-2029)
        • Chart on Brazil - Market size and forecast (2024-2029) ($ million)
        • Data Table on Brazil - Market size and forecast (2024-2029) ($ million)
        • Chart on Brazil - Year-over-year growth (2024-2029) (%)
        • Data Table on Brazil - Year-over-year growth (2024-2029) (%)
      • 13.20 Egypt - Market size and forecast (2024-2029)
        • Chart on Egypt - Market size and forecast (2024-2029) ($ million)
        • Data Table on Egypt - Market size and forecast (2024-2029) ($ million)
        • Chart on Egypt - Year-over-year growth (2024-2029) (%)
        • Data Table on Egypt - Year-over-year growth (2024-2029) (%)
      • 13.21 UAE - Market size and forecast (2024-2029)
        • Chart on UAE - Market size and forecast (2024-2029) ($ million)
        • Data Table on UAE - Market size and forecast (2024-2029) ($ million)
        • Chart on UAE - Year-over-year growth (2024-2029) (%)
        • Data Table on UAE - Year-over-year growth (2024-2029) (%)
      • 13.22 Oman - Market size and forecast (2024-2029)
        • Chart on Oman - Market size and forecast (2024-2029) ($ million)
        • Data Table on Oman - Market size and forecast (2024-2029) ($ million)
        • Chart on Oman - Year-over-year growth (2024-2029) (%)
        • Data Table on Oman - Year-over-year growth (2024-2029) (%)
      • 13.23 Argentina - Market size and forecast (2024-2029)
        • Chart on Argentina - Market size and forecast (2024-2029) ($ million)
        • Data Table on Argentina - Market size and forecast (2024-2029) ($ million)
        • Chart on Argentina - Year-over-year growth (2024-2029) (%)
        • Data Table on Argentina - Year-over-year growth (2024-2029) (%)
      • 13.24 KSA - Market size and forecast (2024-2029)
        • Chart on KSA - Market size and forecast (2024-2029) ($ million)
        • Data Table on KSA - Market size and forecast (2024-2029) ($ million)
        • Chart on KSA - Year-over-year growth (2024-2029) (%)
        • Data Table on KSA - Year-over-year growth (2024-2029) (%)
      • 13.25 UAE - Market size and forecast (2024-2029)
        • Chart on UAE - Market size and forecast (2024-2029) ($ million)
        • Data Table on UAE - Market size and forecast (2024-2029) ($ million)
        • Chart on UAE - Year-over-year growth (2024-2029) (%)
        • Data Table on UAE - Year-over-year growth (2024-2029) (%)
      • 13.26 Brazil - Market size and forecast (2024-2029)
        • Chart on Brazil - Market size and forecast (2024-2029) ($ million)
        • Data Table on Brazil - Market size and forecast (2024-2029) ($ million)
        • Chart on Brazil - Year-over-year growth (2024-2029) (%)
        • Data Table on Brazil - Year-over-year growth (2024-2029) (%)
      • 13.27 Rest of World (ROW) - Market size and forecast (2024-2029)
        • Chart on Rest of World (ROW) - Market size and forecast (2024-2029) ($ million)
        • Data Table on Rest of World (ROW) - Market size and forecast (2024-2029) ($ million)
        • Chart on Rest of World (ROW) - Year-over-year growth (2024-2029) (%)
        • Data Table on Rest of World (ROW) - Year-over-year growth (2024-2029) (%)

      14 Drivers, Challenges, and Opportunity/Restraints

      • 14.1 Market drivers
        • 14.2 Market challenges
          • 14.3 Impact of drivers and challenges
            • Impact of drivers and challenges in 2024 and 2029
          • 14.4 Market opportunities/restraints

            15 Competitive Landscape

            • 15.1 Overview
              • 15.2 Competitive Landscape
                • Overview on criticality of inputs and factors of differentiation
              • 15.3 Landscape disruption
                • Overview on factors of disruption
              • 15.4 Industry risks
                • Impact of key risks on business

              16 Competitive Analysis

              • 16.1 Companies profiled
                • Companies covered
              • 16.2 Market positioning of companies
                • Matrix on companies position and classification
              • 16.3 Advanced BioMatrix, Inc.
                • Advanced BioMatrix, Inc. - Overview
                • Advanced BioMatrix, Inc. - Product / Service
                • Advanced BioMatrix, Inc. - Key offerings
              • 16.4 AstaReal AB
                • AstaReal AB - Overview
                • AstaReal AB - Product / Service
                • AstaReal AB - Key offerings
              • 16.5 Biocell Technology LLC
                • Biocell Technology LLC - Overview
                • Biocell Technology LLC - Product / Service
                • Biocell Technology LLC - Key offerings
              • 16.6 Bioiberica S.A.
                • Bioiberica S.A. - Overview
                • Bioiberica S.A. - Product / Service
                • Bioiberica S.A. - Key offerings
              • 16.7 Cargill, Incorporated
                • Cargill, Incorporated - Overview
                • Cargill, Incorporated - Product / Service
                • Cargill, Incorporated - Key offerings
              • 16.8 Collagen Solutions plc
                • Collagen Solutions plc - Overview
                • Collagen Solutions plc - Product / Service
                • Collagen Solutions plc - Key offerings
              • 16.9 Conagen Inc.
                • Conagen Inc. - Overview
                • Conagen Inc. - Product / Service
                • Conagen Inc. - Key offerings
              • 16.10 Ewald-Gelatine GmbH
                • Ewald-Gelatine GmbH - Overview
                • Ewald-Gelatine GmbH - Product / Service
                • Ewald-Gelatine GmbH - Key offerings
              • 16.11 FMC Corporation (Nutricol)
                • FMC Corporation (Nutricol) - Overview
                • FMC Corporation (Nutricol) - Product / Service
                • FMC Corporation (Nutricol) - Key offerings
              • 16.12 Gelita AG
                • Gelita AG - Overview
                • Gelita AG - Product / Service
                • Gelita AG - Key offerings
              • 16.13 GELNEX
                • GELNEX - Overview
                • GELNEX - Product / Service
                • GELNEX - Key offerings
              • 16.14 Great Lakes Gelatin Co.
                • Great Lakes Gelatin Co. - Overview
                • Great Lakes Gelatin Co. - Product / Service
                • Great Lakes Gelatin Co. - Key offerings
              • 16.15 Jellice Pioneer Europe SAS
                • Jellice Pioneer Europe SAS - Overview
                • Jellice Pioneer Europe SAS - Product / Service
                • Jellice Pioneer Europe SAS - Key offerings
              • 16.16 Knox Gelatine (Kraft Heinz)
                • Knox Gelatine (Kraft Heinz) - Overview
                • Knox Gelatine (Kraft Heinz) - Product / Service
                • Knox Gelatine (Kraft Heinz) - Key offerings
              • 16.17 Lapi Gelatine S.p.A.
                • Lapi Gelatine S.p.A. - Overview
                • Lapi Gelatine S.p.A. - Product / Service
                • Lapi Gelatine S.p.A. - Key offerings
              • 16.18 Nitta Gelatin Inc.
                • Nitta Gelatin Inc. - Overview
                • Nitta Gelatin Inc. - Product / Service
                • Nitta Gelatin Inc. - Key offerings
              • 16.19 PB Leiner
                • PB Leiner - Overview
                • PB Leiner - Product / Service
                • PB Leiner - Key offerings
              • 16.20 Rousselot B.V. (Darling Ingredients Inc.)
                • Rousselot B.V. (Darling Ingredients Inc.) - Overview
                • Rousselot B.V. (Darling Ingredients Inc.) - Product / Service
                • Rousselot B.V. (Darling Ingredients Inc.) - Key offerings
              • 16.21 Tessenderlo Group
                • Tessenderlo Group - Overview
                • Tessenderlo Group - Product / Service
                • Tessenderlo Group - Key offerings
              • 16.22 Weishardt Group
                • Weishardt Group - Overview
                • Weishardt Group - Product / Service
                • Weishardt Group - Key offerings
              • 16.23 Advanced BioMatrix Inc.
                • Advanced BioMatrix Inc. - Overview
                • Advanced BioMatrix Inc. - Product / Service
                • Advanced BioMatrix Inc. - Key offerings
              • 16.24 Ashland Inc.
                • Ashland Inc. - Overview
                • Ashland Inc. - Product / Service
                • Ashland Inc. - Key offerings
              • 16.25 Athos Collagen Pvt. Ltd.
                • Athos Collagen Pvt. Ltd. - Overview
                • Athos Collagen Pvt. Ltd. - Product / Service
                • Athos Collagen Pvt. Ltd. - Key offerings
              • 16.26 Collagen Matrix Inc.
                • Collagen Matrix Inc. - Overview
                • Collagen Matrix Inc. - Product / Service
                • Collagen Matrix Inc. - Key offerings
              • 16.27 Collagen Solutions Plc
                • Collagen Solutions Plc - Overview
                • Collagen Solutions Plc - Product / Service
                • Collagen Solutions Plc - Key offerings
              • 16.28 ConnOils LLC
                • ConnOils LLC - Overview
                • ConnOils LLC - Product / Service
                • ConnOils LLC - Key offerings
              • 16.29 Gelita AG
                • Gelita AG - Overview
                • Gelita AG - Product / Service
                • Gelita AG - Key offerings
              • 16.30 Gelnex
                • Gelnex - Overview
                • Gelnex - Product / Service
                • Gelnex - Key offerings
              • 16.31 Holista Colltech Ltd.
                • Holista Colltech Ltd. - Overview
                • Holista Colltech Ltd. - Product / Service
                • Holista Colltech Ltd. - Key offerings
              • 16.32 Junca Gelatines SL
                • Junca Gelatines SL - Overview
                • Junca Gelatines SL - Product / Service
                • Junca Gelatines SL - Key offerings
              • 16.33 DSM-Firmenich AG
                • DSM-Firmenich AG - Overview
                • DSM-Firmenich AG - Product / Service
                • DSM-Firmenich AG - Key offerings
              • 16.34 Lapi Gelatine Spa
                • Lapi Gelatine Spa - Overview
                • Lapi Gelatine Spa - Product / Service
                • Lapi Gelatine Spa - Key offerings
              • 16.35 Nippi Inc.
                • Nippi Inc. - Overview
                • Nippi Inc. - Product / Service
                • Nippi Inc. - Key offerings
              • 16.36 Nitta Gelatin Inc.
                • Nitta Gelatin Inc. - Overview
                • Nitta Gelatin Inc. - Product / Service
                • Nitta Gelatin Inc. - Key offerings
              • 16.37 Rousselot SDN. BHD.
                • Rousselot SDN. BHD. - Overview
                • Rousselot SDN. BHD. - Product / Service
                • Rousselot SDN. BHD. - Key offerings
              • 16.38 Sandesara Group of Companies
                • Sandesara Group of Companies - Overview
                • Sandesara Group of Companies - Product / Service
                • Sandesara Group of Companies - Key offerings
              • 16.39 SAS Gelatines Weishardt
                • SAS Gelatines Weishardt - Overview
                • SAS Gelatines Weishardt - Product / Service
                • SAS Gelatines Weishardt - Key offerings
              • 16.40 Symatese
                • Symatese - Overview
                • Symatese - Product / Service
                • Symatese - Key offerings
              • 16.41 Tessenderlo Group NV
                • Tessenderlo Group NV - Overview
                • Tessenderlo Group NV - Product / Service
                • Tessenderlo Group NV - Key offerings
              • 16.42 Titan Biotech Ltd.
                • Titan Biotech Ltd. - Overview
                • Titan Biotech Ltd. - Product / Service
                • Titan Biotech Ltd. - Key offerings

              17 Appendix

              • 17.1 Scope of the report
                • 17.2 Inclusions and exclusions checklist
                  • Inclusions checklist
                  • Exclusions checklist
                • 17.3 Currency conversion rates for US$
                  • Currency conversion rates for US$
                • 17.4 Research methodology
                  • Research methodology
                • 17.5 Data procurement
                  • Information sources
                • 17.6 Data validation
                  • Data validation
                • 17.7 Validation techniques employed for market sizing
                  • Validation techniques employed for market sizing
                • 17.8 Data synthesis
                  • Data synthesis
                • 17.9 360 degree market analysis
                  • 360 degree market analysis
                • 17.10 List of abbreviations
                  • List of abbreviations

                Research Methodology

                Technavio presents a detailed picture of the market by way of study, synthesis, and summation of data from multiple sources. The analysts have presented the various facets of the market with a particular focus on identifying the key industry influencers. The data thus presented is comprehensive, reliable, and the result of extensive research, both primary and secondary.

                INFORMATION SOURCES

                Primary sources

                • Manufacturers and suppliers
                • Channel partners
                • Industry experts
                • Strategic decision makers

                Secondary sources

                • Industry journals and periodicals
                • Government data
                • Financial reports of key industry players
                • Historical data
                • Press releases

                DATA ANALYSIS

                Data Synthesis

                • Collation of data
                • Estimation of key figures
                • Analysis of derived insights

                Data Validation

                • Triangulation with data models
                • Reference against proprietary databases
                • Corroboration with industry experts

                REPORT WRITING

                Qualitative

                • Market drivers
                • Market challenges
                • Market trends
                • Five forces analysis

                Quantitative

                • Market size and forecast
                • Market segmentation
                • Geographical insights
                • Competitive landscape

                Interested in this report?

                Get your sample now to see our research methodology and insights!

                Download Now

                Frequently Asked Questions

                Collagen market growth will increase by $ 5340.9 mn during 2025-2029.

                The Collagen market is expected to grow at a CAGR of 9.6% during 2025-2029.

                Collagen market is segmented by Application( Food and beverage, Healthcare, Cosmetics, Others) Product( Gelatin, Hydrolyzed, Native) Source( Bovine, Porcine, Marine, Poultry, Middle East and Africa)

                Advanced BioMatrix, Inc., AstaReal AB, Biocell Technology LLC, Bioiberica S.A., Cargill, Incorporated, Collagen Solutions plc, Conagen Inc., Ewald-Gelatine GmbH, FMC Corporation (Nutricol), Gelita AG, GELNEX, Great Lakes Gelatin Co., Jellice Pioneer Europe SAS, Knox Gelatine (Kraft Heinz), Lapi Gelatine S.p.A., Nitta Gelatin Inc., PB Leiner, Rousselot B.V. (Darling Ingredients Inc.), Tessenderlo Group, Weishardt Group are a few of the key vendors in the Collagen market.

                North America will register the highest growth rate of 34% among the other regions. Therefore, the Collagen market in North America is expected to garner significant business opportunities for the vendors during the forecast period.

                US, Canada, Germany, UK, Italy, France, China, India, Japan, Brazil, Egypt, UAE, Oman, Argentina, KSA, UAE, Brazil, Rest of World (ROW)

                • Rising applications of collagen in cosmetic and personal care industryCollagen has attracted considerable academic interest as well as the attention of the cosmetic industry due to its interesting properties is the driving factor this market.
                • which include being a natural skin moisturizer. Collagen is a key ingredient in many cosmetic products is the driving factor this market.
                • as it is a natural humectant.Silver carp is the driving factor this market.
                • brown-backed toads is the driving factor this market.
                • cod is the driving factor this market.
                • and tilapia contain a large amount of collagen. Cosmetic preparations based on collagen from the sea can differ in their properties and composition depending on the species and the age of the organism. The predominant type of collagen in the skin is type I. Marine collagen is rich in this type of collagen. Thus is the driving factor this market.
                • marine collagen is the most sought-after collagen source in the cosmetics industry.Collagen is one of the most important ingredients in cosmetic products due to its moisturizing is the driving factor this market.
                • regenerative is the driving factor this market.
                • and film-forming properties. The excellent water-binding capacity of collagen helps maintain the correct water content in the skin throughout the usage of collagen-based products. Collagen is also the main component of several hydrogels that can be used as a so-called beauty mask. Such cosmetics should restore skin elasticity and promote antiaging effects. The function of collagen is to increase skin moisture and prevent skin aging. The film-forming properties of collagen materials can be modified by cross-linking the collagen and/or mixing the collagen with other proteins and polysaccharides.Collagen is undoubtedly used in effective rejuvenation treatments in the aging population is the driving factor this market.
                • as skin aging is a process that has a very direct impact on daily life and a persons psychological and social well-being. A more youthful appearance probably has a positive effect on the whole body and would help maintain the right position in society. Hence is the driving factor this market.
                • the global collagen market is expected to grow during the forecast period. is the driving factor this market.

                The Collagen market vendors should focus on grabbing business opportunities from the Food and beverage segment as it accounted for the largest market share in the base year.