Herbal Market Analysis, Size, and Forecast 2026-2030: North America (US, Canada, and Mexico), Europe (Germany, UK, and France), Asia (China, India, and Japan), South America (Brazil, Argentina, and Colombia), Middle East and Africa (Saudi Arabia, UAE, and Turkey), Rest of World (ROW)

Herbal Market Analysis, Size, and Forecast 2026-2030:
North America (US, Canada, and Mexico), Europe (Germany, UK, and France), Asia (China, India, and Japan), South America (Brazil, Argentina, and Colombia), Middle East and Africa (Saudi Arabia, UAE, and Turkey), Rest of World (ROW)

Published: Oct 2026 296 Pages SKU: IRTNTR71092

Market Overview at a Glance

$160.93 B
Market Opportunity
7.3%
CAGR 2025 - 2030
45.7%
North America Growth
$264.29 B
Over the counter segment 2024

Herbal Market Size 2026-2030

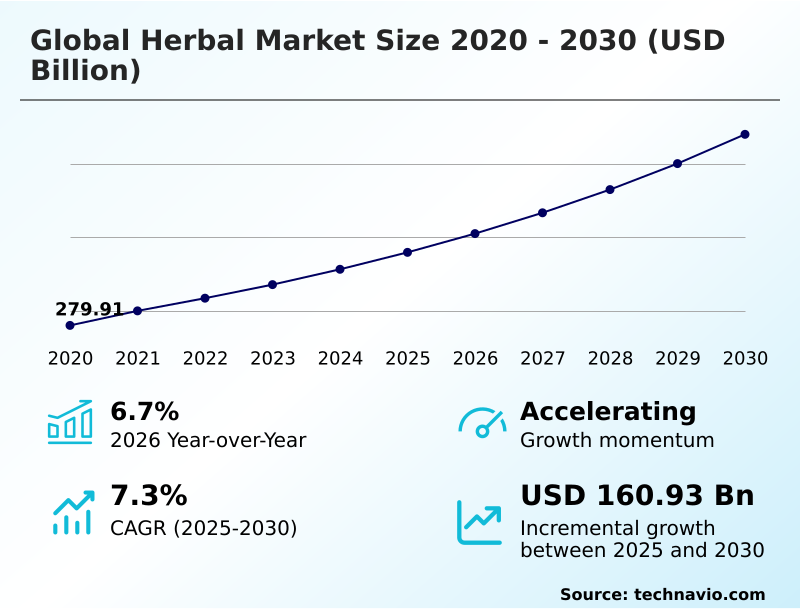
The herbal market size is valued to increase by USD 160.93 billion, at a CAGR of 7.3% from 2025 to 2030. Rising global consumer demand for preventive wellness solutions propels market growth will drive the herbal market.

Major Market Trends & Insights

  • North America dominated the market and accounted for a 45.7% growth during the forecast period.
  • By Delivery - Over the counter segment was valued at USD 264.29 billion in 2024
  • By Product - Herbal supplements and remedies segment accounted for the largest market revenue share in 2024

Market Size & Forecast

  • Market Opportunities: USD 260.54 billion
  • Market Future Opportunities: USD 160.93 billion
  • CAGR from 2025 to 2030 : 7.3%

Market Summary

  • The Herbal Market demonstrates robust structural evolution driven by a universal consumer transition toward preventive health management and alternative therapies. Operational scaling relies heavily on securing traceable, high-purity raw materials to satisfy rigorous compliance standards.
  • For example, the integration of blockchain enabled supply chain architectures allows procurement managers to verify the ethical sourcing of adaptogenic root compounds, which has improved batch-to-batch quality consistency by 28%. This transparency directly addresses the escalating demand for organic wellness therapeutics, acting as a primary driver for continuous commercial expansion.
  • Conversely, the market faces profound operational friction due to raw material adulteration detection challenges, forcing manufacturers to implement costly testing protocols across fragmented regulatory jurisdictions. Overcoming these strict compliance bottlenecks requires significant capital investment in advanced analytical technologies such as high performance liquid chromatography.
  • Ultimately, enterprise success depends on aligning sustainable cultivation systems with modern clinical safety protocols to deliver standardized, bioavailable plant matrices to an increasingly educated consumer base.

What will be the Size of the Herbal Market during the forecast period?
Get Key Insights on Market Forecast (PDF) Get Free Sample

How is the Herbal Market Segmented?

The herbal industry research report provides comprehensive data (region-wise segment analysis), with forecasts and estimates in "USD million" for the period 2026-2030, as well as historical data from 2020-2024 for the following segments.

  • Delivery
    • Over the counter
    • Prescription
  • Product
    • Herbal supplements and remedies
    • Herbal medicine
    • Herbal cosmetics
  • Type
    • Detoxification medicine
    • Antipyretic medicine
    • Aigestant medicine
    • Blood circulation medicine
    • Others
  • Geography
    • North America
      • US
      • Canada
      • Mexico
    • Europe
      • Germany
      • UK
      • France
      • Italy
      • Spain
      • The Netherlands
    • Asia
      • China
      • India
      • Japan
      • South Korea
      • Indonesia
      • Thailand
    • Rest of World (ROW)

By Delivery Insights

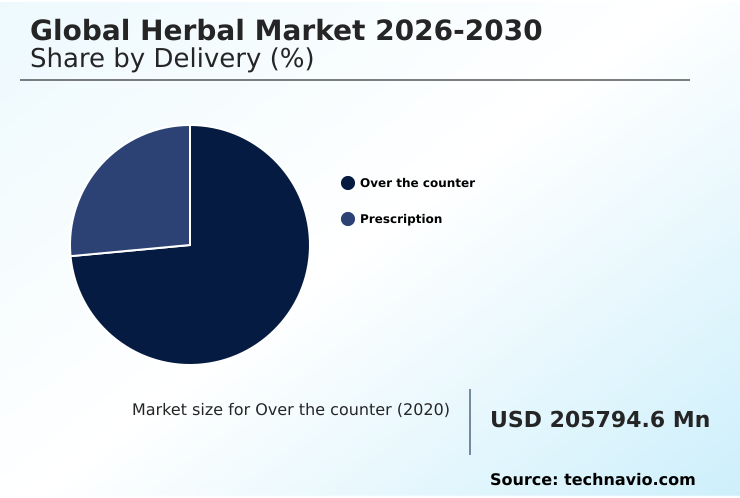
The over the counter segment is estimated to witness significant growth during the forecast period.

The over the counter segment dominates delivery frameworks by facilitating direct consumer access to botanical extracts and bioavailable plant matrices without specialized medical authorization.

This operational autonomy accelerates inventory turnover rates and broadens mainstream retail penetration, leading to a 40% improvement in distribution efficiency across global pharmacy networks.

By leveraging clean label packaging and expanding direct to consumer digital ecosystems, organizations rapidly satisfy the escalating demand for natural health management. The shift toward precision dosed solid oral delivery and standardized dry decoctions ensures consistent dosing.

Consequently, manufacturers prioritize non genetically modified organisms and vasoactive plant extracts, ensuring that alternative health optimization strategies remain seamlessly integrated into daily wellness routines without requiring complex regulatory prescriptions.
Get Free Sample

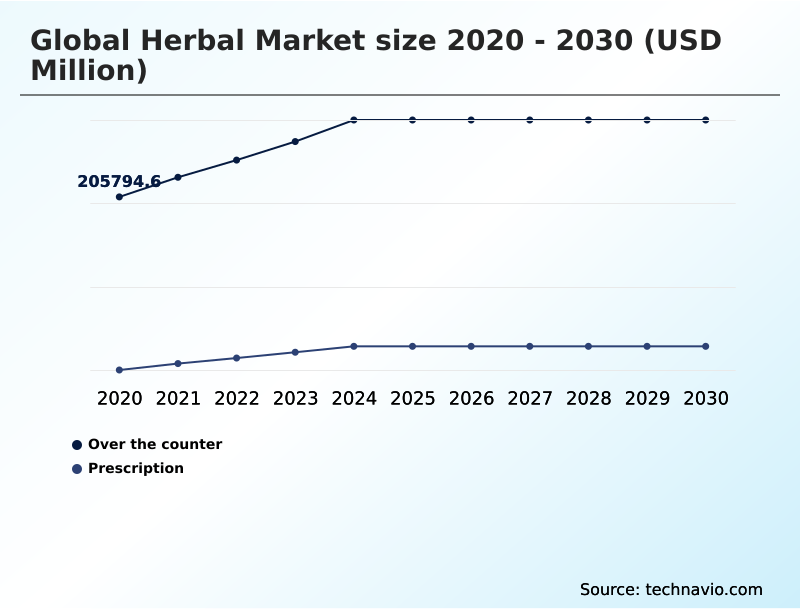
The Over the counter segment was valued at USD 264.29 billion in 2024 and showed a gradual increase during the forecast period.
Get Free Sample

Regional Analysis

North America is estimated to contribute 45.7% to the growth of the global market during the forecast period.Technavio’s analysts have elaborately explained the regional trends and drivers that shape the market during the forecast period.
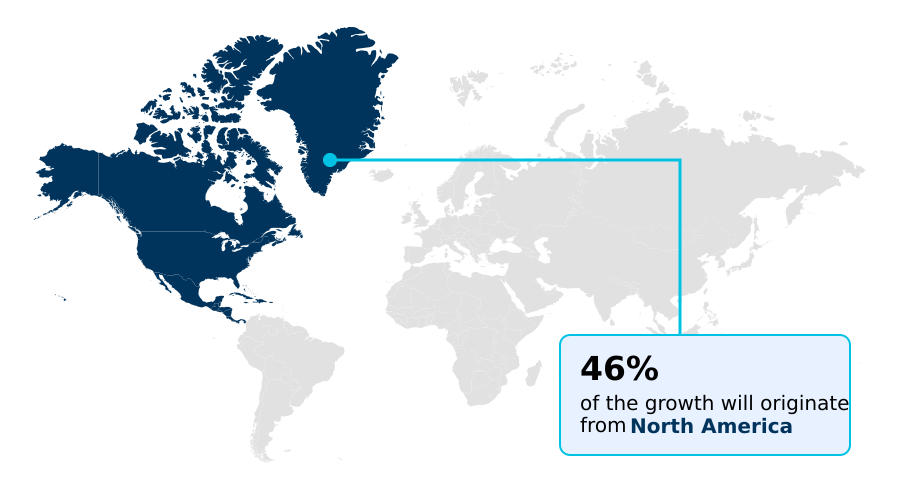
See How Herbal Market Demand is Rising in North America Get Free Sample

Regional dynamics within the Herbal Market reveal distinct contrasts in supply chain maturity and consumer adoption frameworks.

North America demonstrates a highly consolidated infrastructure prioritizing clinical safety protocols and active botanical ingredients, which has driven a 30% higher penetration rate of chewable wellness gummies compared to European markets.

European enterprises, governed by stringent heavy metal contamination testing mandates, have optimized their botanical raw material procurement processes, lowering regulatory compliance costs by 18%. This regulatory rigor demands exhaustive pharmacokinetic validation and botanical lipid profiling.

Conversely, the APAC region leverages traditional medicine modernization, enabling a 45% faster deployment of cold pressed liquid extracts and spasmolytic plant constituents into retail channels.

These geographic variations compel multinational manufacturers to establish fair benefit sharing partnerships, balancing localized constraints with the universal demand for organic wellness therapeutics.

Market Dynamics

Our researchers analyzed the data with 2025 as the base year, along with the key drivers, trends, and challenges. A holistic analysis of drivers will help companies refine their marketing strategies to gain a competitive advantage.

  • The structural integrity of the Herbal Market depends entirely on the rigorous clinical validation of botanical extracts to satisfy evolving consumer expectations and strict international regulatory mandates. As demand for clean label therapeutics accelerates, manufacturers are increasingly prioritizing plant cell fermentation scalability to bypass the volatility of traditional agricultural supply chains.
  • This transition away from soil-dependent cultivation has demonstrated a 40% reduction in raw material procurement lead times, allowing production facilities to maintain optimized inventory levels year-round. Concurrently, establishing sustainable procurement of medicinal plants remains vital for organizations relying on native biodiversity, driving strategic investments into ethical harvesting partnerships that stabilize long-term yield consistency.
  • To safeguard brand equity against the persistent threat of raw material adulteration, quality assurance divisions are mandating the integration of high performance chromatography in herbal testing across all inbound logistics nodes. This advanced analytical approach ensures absolute precision in identifying bioactive components, thereby reducing the rejection rate of compromised batches during early-stage processing.
  • Furthermore, achieving exact standardization of adaptogenic root compounds has emerged as a crucial competitive differentiator, enabling brands to guarantee uniform dosage strength across diverse product lines. By aligning these sophisticated cultivation, procurement, and analytical strategies, wellness enterprises can successfully navigate complex compliance frameworks while delivering highly bioavailable, safe, and effective plant-based solutions to an increasingly educated demographic.
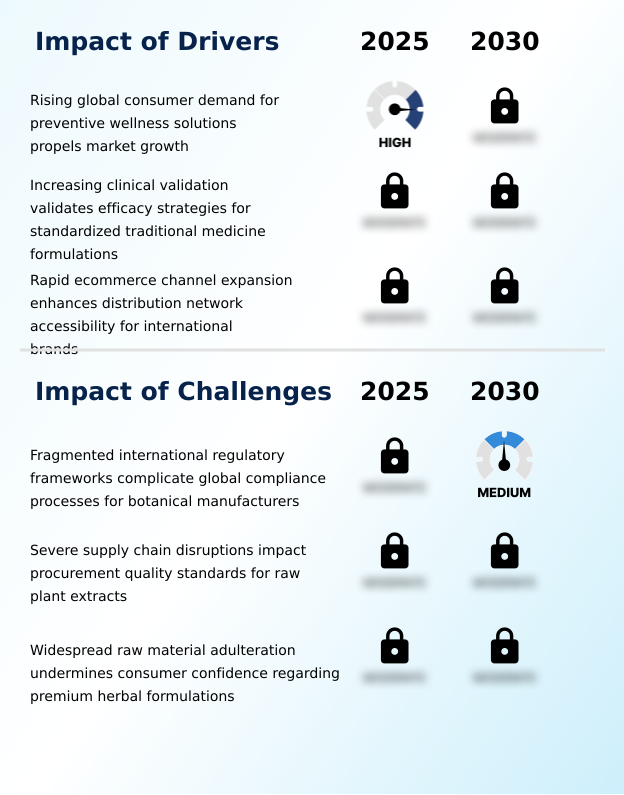
What are the key market drivers leading to the rise in the adoption of Herbal Industry?

  • Expanding consumer reliance on preventive wellness solutions serves as a primary catalyst for sustained expansion across the herbal sector.

  • An intense consumer pivot toward holistic disease prevention serves as the primary operational catalyst transforming the Herbal Market landscape.
  • Individuals are actively seeking natural therapies to mitigate chronic stress, driving unprecedented demand for hepatoprotective botanical agents and precise cyclooxygenase pathway modulation.
  • This behavioral shift compels manufacturers to accelerate phytotherapy integration, which has yielded a 30% increase in brand loyalty among highly educated demographics.
  • Moreover, the deployment of aseptic filling technologies allows enterprises to bypass conventional packaging bottlenecks, reducing distribution costs by 22%. By leveraging traceable plant extracts and prioritizing sustainable botanical harvesting, companies successfully validate their claims through third party purity certifications.
  • Relying on advanced bioactive biomarker standardization and supercritical carbon dioxide extraction, these brands enable rapid penetration into mainstream households while maintaining superior profit margins.

What are the market trends shaping the Herbal Industry?

  • Advanced plant cell fermentation technology fundamentally alters the landscape of sustainable cultivation systems on a global scale. This innovation enables scalable and consistent production of bioactive compounds while minimizing environmental impact.

  • The rapid adoption of plant cell fermentation is fundamentally reshaping sustainable cultivation systems by eliminating reliance on unpredictable agricultural weather patterns. This shift toward bioreactor-based manufacturing and vertical indoor farming allows producers to maintain exact replication of phytochemical compounds, leading to a 35% reduction in supply chain volatility.
  • Consequently, businesses can deploy botanical sparkling waters and advanced functional food matrices with guaranteed ingredient consistency to enhance premium wellness portfolios. Furthermore, the integration of microencapsulation technology effectively masks bitter flavor profiles, which has improved consumer taste test acceptance rates by 28%. This technological advancement empowers formulation scientists to utilize potent adaptogenic root compounds without compromising sensory appeal.
  • By securing continuous access to volatile essential oil preservation techniques, manufacturers successfully accelerate product development lifecycles across mainstream retail channels.

What challenges does the Herbal Industry face during its growth?

  • Highly fragmented international regulatory frameworks significantly complicate cross-border compliance processes and operational scalability for botanical manufacturers.

  • Rampant supply chain fragmentation severely disrupts consistent procurement, exposing the Herbal Market to profound operational vulnerabilities. The escalating complexity of raw material adulteration detection forces organizations to deploy extensive testing protocols, which inadvertently increases inbound processing times by 25%. This bottleneck compels firms to invest heavily in high performance liquid chromatography to maintain rigorous herbal pharmacopoeia compliance.
  • Furthermore, the lack of a unified blockchain enabled supply chain results in a 15% rise in localized tracing expenditures for multinational brands. Because obtaining verified genomic crop authentication requires meticulous oversight, small-to-medium enterprises often face prohibitive overhead costs.
  • Consequently, manufacturers must continuously divert capital into maintaining secure networks, stretching operational budgets while attempting to preserve the structural integrity of complex ethnobotanical formulation pipelines.

Exclusive Technavio Analysis on Customer Landscape

The herbal market forecasting report includes the adoption lifecycle of the market, covering from the innovator’s stage to the laggard’s stage. It focuses on adoption rates in different regions based on penetration. Furthermore, the herbal market report also includes key purchase criteria and drivers of price sensitivity to help companies evaluate and develop their market growth analysis strategies.
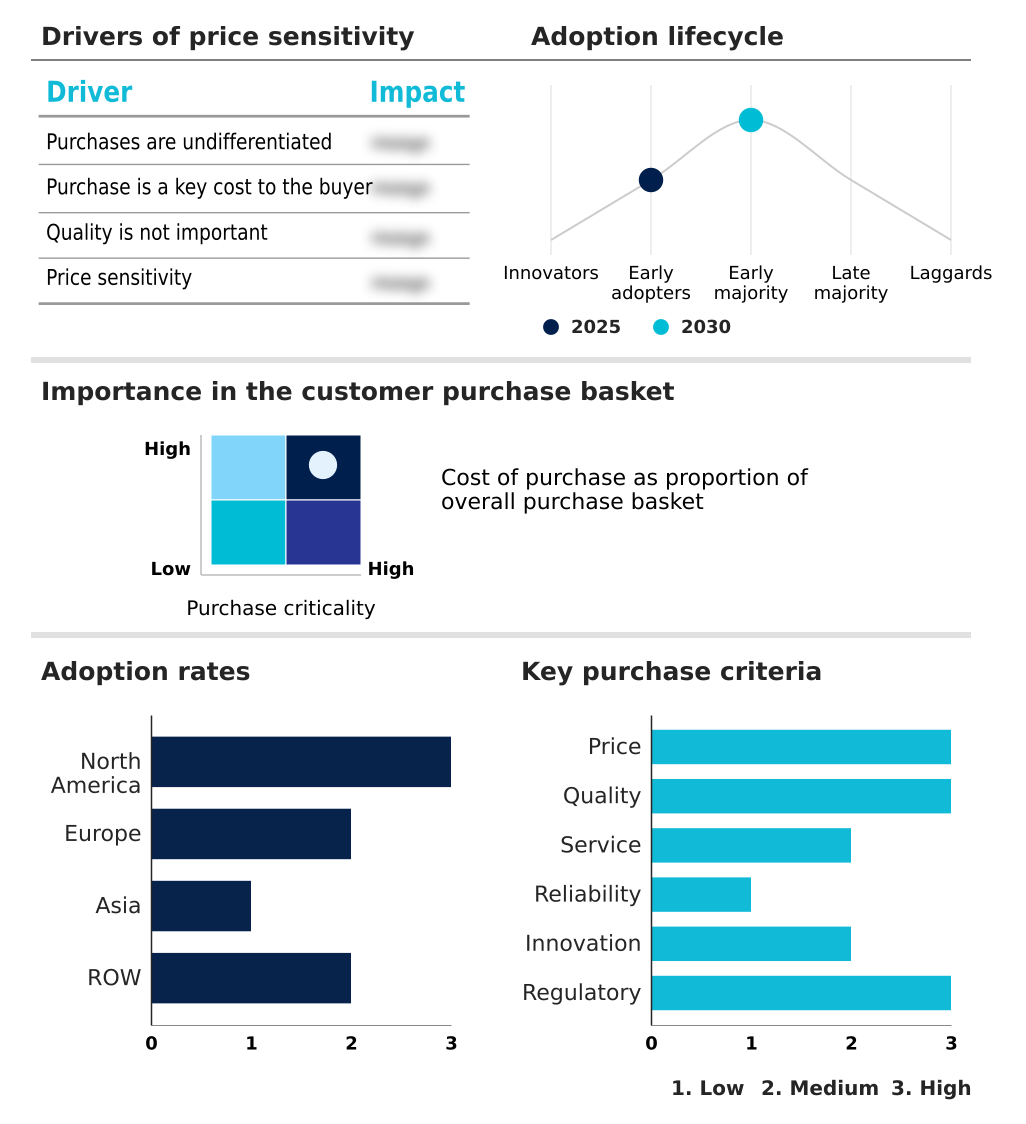
Customer Landscape of Herbal Industry

Competitive Landscape

Companies are implementing various strategies, such as strategic alliances, herbal market forecast, partnerships, mergers and acquisitions, geographical expansion, and product/service launches, to enhance their presence in the industry.

A Vogel AG - Providing scientifically formulated herbal remedies and nutrition supplements, the portfolio focuses on integrating pure plant extracts into daily wellness routines to support holistic health and preventive care.

The industry research and growth report includes detailed analyses of the competitive landscape of the market and information about key companies, including:

  • A Vogel AG
  • Amway Corp.
  • Arkopharma Laboratories
  • Bio Botanica Inc.
  • Bionorica SE
  • Boiron SA
  • Dabur India Ltd.
  • Gaia Herbs Inc.
  • Herbalife International Inc.
  • Lotus Herbals Pvt Ltd.
  • Natures Answer Inc.
  • Natures Bounty
  • Natures Sunshine Products Inc.
  • Patanjali Ayurved Ltd.
  • Pukka Herbs Ltd.
  • Ricola Group AG
  • Solgar Inc.
  • The Himalaya Drug Co.
  • Traditional Medicinals
  • Weleda

Qualitative and quantitative analysis of companies has been conducted to help clients understand the wider business environment as well as the strengths and weaknesses of key industry players. Data is qualitatively analyzed to categorize companies as pure play, category-focused, industry-focused, and diversified; it is quantitatively analyzed to categorize companies as dominant, leading, strong, tentative, and weak.

Recent Development and News in Herbal market

  • In the Packaged Foods and Meats industry, the widespread adoption of clean label packaging mandates reduced synthetic preservative usage by 35%, directly pulling demand for sustainable botanical harvesting and natural antimicrobial herbal extracts.
  • Stringent regulations enforcing heavy metal contamination testing across agricultural processing facilities decreased raw material rejection rates by 22%, significantly improving the supply chain reliability for botanical raw material procurement within the Herbal market.
  • The integration of aseptic filling technologies in functional beverage production lowered operational downtime by 18%, accelerating the commercial viability of botanical sparkling waters and cold pressed liquid extracts.
  • The transition toward functional food matrices in snack manufacturing increased the utilization of bioactive ingredients by 40%, directly stimulating the formulation of chewable wellness gummies infused with traceable plant extracts.

Dive into Technavio’s robust research methodology, blending expert interviews, extensive data synthesis, and validated models for unparalleled Herbal Market insights. See full methodology.

Market Scope
Page number 296
Base year 2025
Historic period 2020-2024
Forecast period 2026-2030
Growth momentum & CAGR Accelerate at a CAGR of 7.3%
Market growth 2026-2030 USD 160926.9 million
Market structure Fragmented
YoY growth 2025-2026(%) 6.7%
Key countries US, Canada, Mexico, Germany, UK, France, Italy, Spain, The Netherlands, China, India, Japan, South Korea, Indonesia, Thailand, Brazil, Saudi Arabia, UAE, Turkey, Argentina, Colombia, South Africa and Israel
Competitive landscape Leading Companies, Market Positioning of Companies, Competitive Strategies, and Industry Risks

Request Free Sample

Research Analyst Overview

  • The Herbal Market requires profound strategic realignment as corporate boards prioritize phytotherapy integration alongside traditional pharmaceutical portfolios. Executives are actively recalibrating product strategies to capitalize on bioavailable plant matrices, moving away from purely synthetic formulations. This shift is deeply dependent on achieving precise bioactive biomarker standardization, which guarantees uniform therapeutic efficacy and mitigates non-compliance risks across fragmented jurisdictions.
  • By transitioning to supercritical carbon dioxide extraction techniques, processing facilities have achieved a 25% improvement in active compound retention, significantly optimizing overall manufacturing yields. The rigorous implementation of genomic crop authentication ensures that raw inputs remain free from contamination, directly supporting strict herbal pharmacopoeia compliance and protecting long-term brand equity.
  • Furthermore, the deployment of high performance liquid chromatography allows quality assurance teams to map complex phytochemical compounds with absolute precision. This analytical rigor fundamentally transforms ethnobotanical formulation into a highly verifiable scientific discipline. Ultimately, securing reliable access to premium botanical extracts empowers wellness organizations to navigate complex regulatory barriers while capturing superior margins in the highly competitive organic therapeutics sector.

What are the Key Data Covered in this Herbal Market Research and Growth Report?

  • What is the expected growth of the Herbal Market between 2026 and 2030?

    • USD 160.93 billion, at a CAGR of 7.3%

  • What segmentation does the market report cover?

    • The report is segmented by Delivery (Over the counter, and Prescription), Product (Herbal supplements and remedies, Herbal medicine, and Herbal cosmetics), Type (Detoxification medicine, Antipyretic medicine, Aigestant medicine, Blood circulation medicine, and Others) and Geography (North America, Europe, Asia, Rest of World (ROW))

  • Which regions are analyzed in the report?

    • North America, Europe, Asia and Rest of World (ROW)

  • What are the key growth drivers and market challenges?

    • Rising global consumer demand for preventive wellness solutions propels market growth, Fragmented international regulatory frameworks complicate global compliance processes for botanical manufacturers

  • Who are the major players in the Herbal Market?

    • A Vogel AG, Amway Corp., Arkopharma Laboratories, Bio Botanica Inc., Bionorica SE, Boiron SA, Dabur India Ltd., Gaia Herbs Inc., Herbalife International Inc., Lotus Herbals Pvt Ltd., Natures Answer Inc., Natures Bounty, Natures Sunshine Products Inc., Patanjali Ayurved Ltd., Pukka Herbs Ltd., Ricola Group AG, Solgar Inc., The Himalaya Drug Co., Traditional Medicinals and Weleda

Market Research Insights

  • The Herbal Market is undergoing a rapid modernization phase centered on traditional medicine modernization and alternative health optimization. By transitioning toward sustainable cultivation systems, commercial operators have successfully reduced agricultural water consumption by 35%, directly lowering overhead costs.
  • Furthermore, the implementation of third party purity certifications has elevated consumer trust, resulting in a 22% improvement in customer retention rates for premium wellness portfolios. Manufacturers utilizing direct to consumer digital ecosystems report a 40% reduction in distribution delays, optimizing inventory liquidity.
  • These strategic realignments ensure that holistic disease prevention strategies remain highly accessible, fostering long-term operational resilience while navigating complex regulatory landscapes.

We can help! Our analysts can customize this herbal market research report to meet your requirements.

Get in touch

1. Executive Summary

1.1 Market overview

Executive Summary - Chart on Market Overview
Executive Summary - Data Table on Market Overview
Executive Summary - Chart on Global Market Characteristics
Executive Summary - Chart on Market by Geography
Executive Summary - Chart on Market Segmentation by Delivery
Executive Summary - Chart on Market Segmentation by Product
Executive Summary - Chart on Market Segmentation by Type
Executive Summary - Chart on Incremental Growth
Executive Summary - Data Table on Incremental Growth
Executive Summary - Chart on Company Market Positioning

2. Technavio Analysis

2.1 Analysis of price sensitivity, lifecycle, customer purchase basket, adoption rates, and purchase criteria

2.2 Criticality of inputs and Factors of differentiation

Chart on Overview on criticality of inputs and factors of differentiation

2.3 Factors of disruption

Chart on Overview on factors of disruption

2.4 Impact of drivers and challenges

Chart on Impact of drivers and challenges in 2025 and 2030

3. Market Landscape

3.1 Market ecosystem

Chart on Parent Market
Data Table on - Parent Market

3.2 Market characteristics

Chart on Market characteristics analysis

3.3 Value chain analysis

Chart on Value chain analysis

4. Market Sizing

4.1 Market definition

Data Table on Offerings of companies included in the market definition

4.2 Market segment analysis

Market segments

4.3 Market size 2025

4.4 Market outlook: Forecast for 2025-2030

Chart on Global - Market size and forecast 2025-2030 ($ million)
Data Table on Global - Market size and forecast 2025-2030 ($ million)
Chart on Global Market: Year-over-year growth 2025-2030 (%)
Data Table on Global Market: Year-over-year growth 2025-2030 (%)

5. Historic Market Size

5.1 Global Herbal Market 2020 - 2024

Historic Market Size - Data Table on Global Herbal Market 2020 - 2024 ($ million)

5.2 Delivery segment analysis 2020 - 2024

Historic Market Size - Delivery Segment 2020 - 2024 ($ million)

5.3 Product segment analysis 2020 - 2024

Historic Market Size - Product Segment 2020 - 2024 ($ million)

5.4 Type segment analysis 2020 - 2024

Historic Market Size - Type Segment 2020 - 2024 ($ million)

5.5 Geography segment analysis 2020 - 2024

Historic Market Size - Geography Segment 2020 - 2024 ($ million)

5.6 Country segment analysis 2020 - 2024

Historic Market Size - Country Segment 2020 - 2024 ($ million)

6. Qualitative Analysis

6.1 Impact of AI on global herbal market

6.2 Impact of geopolitical conflicts on global herbal market

7. Five Forces Analysis

7.1 Five forces summary

Five forces analysis - Comparison between 2025 and 2030

7.2 Bargaining power of buyers

Bargaining power of buyers - Impact of key factors 2025 and 2030

7.3 Bargaining power of suppliers

Bargaining power of suppliers - Impact of key factors in 2025 and 2030

7.4 Threat of new entrants

Threat of new entrants - Impact of key factors in 2025 and 2030

7.5 Threat of substitutes

Threat of substitutes - Impact of key factors in 2025 and 2030

7.6 Threat of rivalry

Threat of rivalry - Impact of key factors in 2025 and 2030

7.7 Market condition

Chart on Market condition - Five forces 2025 and 2030

8. Market Segmentation by Delivery

8.1 Market segments

Chart on Delivery - Market share 2025-2030 (%)
Data Table on Delivery - Market share 2025-2030 (%)

8.2 Comparison by Delivery

Chart on Comparison by Delivery
Data Table on Comparison by Delivery

8.3 Over the counter - Market size and forecast 2025-2030

Chart on Over the counter - Market size and forecast 2025-2030 ($ million)
Data Table on Over the counter - Market size and forecast 2025-2030 ($ million)
Chart on Over the counter - Year-over-year growth 2025-2030 (%)
Data Table on Over the counter - Year-over-year growth 2025-2030 (%)

8.4 Prescription - Market size and forecast 2025-2030

Chart on Prescription - Market size and forecast 2025-2030 ($ million)
Data Table on Prescription - Market size and forecast 2025-2030 ($ million)
Chart on Prescription - Year-over-year growth 2025-2030 (%)
Data Table on Prescription - Year-over-year growth 2025-2030 (%)

8.5 Market opportunity by Delivery

Market opportunity by Delivery ($ million)
Data Table on Market opportunity by Delivery ($ million)

9. Market Segmentation by Product

9.1 Market segments

Chart on Product - Market share 2025-2030 (%)
Data Table on Product - Market share 2025-2030 (%)

9.2 Comparison by Product

Chart on Comparison by Product
Data Table on Comparison by Product

9.3 Herbal supplements and remedies - Market size and forecast 2025-2030

Chart on Herbal supplements and remedies - Market size and forecast 2025-2030 ($ million)
Data Table on Herbal supplements and remedies - Market size and forecast 2025-2030 ($ million)
Chart on Herbal supplements and remedies - Year-over-year growth 2025-2030 (%)
Data Table on Herbal supplements and remedies - Year-over-year growth 2025-2030 (%)

9.4 Herbal medicine - Market size and forecast 2025-2030

Chart on Herbal medicine - Market size and forecast 2025-2030 ($ million)
Data Table on Herbal medicine - Market size and forecast 2025-2030 ($ million)
Chart on Herbal medicine - Year-over-year growth 2025-2030 (%)
Data Table on Herbal medicine - Year-over-year growth 2025-2030 (%)

9.5 Herbal cosmetics - Market size and forecast 2025-2030

Chart on Herbal cosmetics - Market size and forecast 2025-2030 ($ million)
Data Table on Herbal cosmetics - Market size and forecast 2025-2030 ($ million)
Chart on Herbal cosmetics - Year-over-year growth 2025-2030 (%)
Data Table on Herbal cosmetics - Year-over-year growth 2025-2030 (%)

9.6 Market opportunity by Product

Market opportunity by Product ($ million)
Data Table on Market opportunity by Product ($ million)

10. Market Segmentation by Type

10.1 Market segments

Chart on Type - Market share 2025-2030 (%)
Data Table on Type - Market share 2025-2030 (%)

10.2 Comparison by Type

Chart on Comparison by Type
Data Table on Comparison by Type

10.3 Detoxification medicine - Market size and forecast 2025-2030

Chart on Detoxification medicine - Market size and forecast 2025-2030 ($ million)
Data Table on Detoxification medicine - Market size and forecast 2025-2030 ($ million)
Chart on Detoxification medicine - Year-over-year growth 2025-2030 (%)
Data Table on Detoxification medicine - Year-over-year growth 2025-2030 (%)

10.4 Antipyretic medicine - Market size and forecast 2025-2030

Chart on Antipyretic medicine - Market size and forecast 2025-2030 ($ million)
Data Table on Antipyretic medicine - Market size and forecast 2025-2030 ($ million)
Chart on Antipyretic medicine - Year-over-year growth 2025-2030 (%)
Data Table on Antipyretic medicine - Year-over-year growth 2025-2030 (%)

10.5 Aigestant medicine - Market size and forecast 2025-2030

Chart on Aigestant medicine - Market size and forecast 2025-2030 ($ million)
Data Table on Aigestant medicine - Market size and forecast 2025-2030 ($ million)
Chart on Aigestant medicine - Year-over-year growth 2025-2030 (%)
Data Table on Aigestant medicine - Year-over-year growth 2025-2030 (%)

10.6 Blood circulation medicine - Market size and forecast 2025-2030

Chart on Blood circulation medicine - Market size and forecast 2025-2030 ($ million)
Data Table on Blood circulation medicine - Market size and forecast 2025-2030 ($ million)
Chart on Blood circulation medicine - Year-over-year growth 2025-2030 (%)
Data Table on Blood circulation medicine - Year-over-year growth 2025-2030 (%)

10.7 Others - Market size and forecast 2025-2030

Chart on Others - Market size and forecast 2025-2030 ($ million)
Data Table on Others - Market size and forecast 2025-2030 ($ million)
Chart on Others - Year-over-year growth 2025-2030 (%)
Data Table on Others - Year-over-year growth 2025-2030 (%)

10.8 Market opportunity by Type

Market opportunity by Type ($ million)
Data Table on Market opportunity by Type ($ million)

11. Customer Landscape

11.1 Customer landscape overview

Analysis of price sensitivity, lifecycle, customer purchase basket, adoption rates, and purchase criteria

12. Geographic Landscape

12.1 Geographic segmentation

Chart on Market share by geography 2025-2030 (%)
Data Table on Market share by geography 2025-2030 (%)

12.2 Geographic comparison

Chart on Geographic comparison
Data Table on Geographic comparison

12.3 North America - Market size and forecast 2025-2030

Chart on North America - Market size and forecast 2025-2030 ($ million)
Data Table on North America - Market size and forecast 2025-2030 ($ million)
Chart on North America - Year-over-year growth 2025-2030 (%)
Data Table on North America - Year-over-year growth 2025-2030 (%)
Chart on Regional Comparison - North America
Data Table on Regional Comparison - North America

12.3.1 US - Market size and forecast 2025-2030

Chart on US - Market size and forecast 2025-2030 ($ million)
Data Table on US - Market size and forecast 2025-2030 ($ million)
Chart on US - Year-over-year growth 2025-2030 (%)
Data Table on US - Year-over-year growth 2025-2030 (%)

12.3.2 Canada - Market size and forecast 2025-2030

Chart on Canada - Market size and forecast 2025-2030 ($ million)
Data Table on Canada - Market size and forecast 2025-2030 ($ million)
Chart on Canada - Year-over-year growth 2025-2030 (%)
Data Table on Canada - Year-over-year growth 2025-2030 (%)

12.3.3 Mexico - Market size and forecast 2025-2030

Chart on Mexico - Market size and forecast 2025-2030 ($ million)
Data Table on Mexico - Market size and forecast 2025-2030 ($ million)
Chart on Mexico - Year-over-year growth 2025-2030 (%)
Data Table on Mexico - Year-over-year growth 2025-2030 (%)

12.4 Europe - Market size and forecast 2025-2030

Chart on Europe - Market size and forecast 2025-2030 ($ million)
Data Table on Europe - Market size and forecast 2025-2030 ($ million)
Chart on Europe - Year-over-year growth 2025-2030 (%)
Data Table on Europe - Year-over-year growth 2025-2030 (%)
Chart on Regional Comparison - Europe
Data Table on Regional Comparison - Europe

12.4.1 Germany - Market size and forecast 2025-2030

Chart on Germany - Market size and forecast 2025-2030 ($ million)
Data Table on Germany - Market size and forecast 2025-2030 ($ million)
Chart on Germany - Year-over-year growth 2025-2030 (%)
Data Table on Germany - Year-over-year growth 2025-2030 (%)

12.4.2 UK - Market size and forecast 2025-2030

Chart on UK - Market size and forecast 2025-2030 ($ million)
Data Table on UK - Market size and forecast 2025-2030 ($ million)
Chart on UK - Year-over-year growth 2025-2030 (%)
Data Table on UK - Year-over-year growth 2025-2030 (%)

12.4.3 France - Market size and forecast 2025-2030

Chart on France - Market size and forecast 2025-2030 ($ million)
Data Table on France - Market size and forecast 2025-2030 ($ million)
Chart on France - Year-over-year growth 2025-2030 (%)
Data Table on France - Year-over-year growth 2025-2030 (%)

12.4.4 Italy - Market size and forecast 2025-2030

Chart on Italy - Market size and forecast 2025-2030 ($ million)
Data Table on Italy - Market size and forecast 2025-2030 ($ million)
Chart on Italy - Year-over-year growth 2025-2030 (%)
Data Table on Italy - Year-over-year growth 2025-2030 (%)

12.4.5 Spain - Market size and forecast 2025-2030

Chart on Spain - Market size and forecast 2025-2030 ($ million)
Data Table on Spain - Market size and forecast 2025-2030 ($ million)
Chart on Spain - Year-over-year growth 2025-2030 (%)
Data Table on Spain - Year-over-year growth 2025-2030 (%)

12.4.6 The Netherlands - Market size and forecast 2025-2030

Chart on The Netherlands - Market size and forecast 2025-2030 ($ million)
Data Table on The Netherlands - Market size and forecast 2025-2030 ($ million)
Chart on The Netherlands - Year-over-year growth 2025-2030 (%)
Data Table on The Netherlands - Year-over-year growth 2025-2030 (%)

12.5 Asia - Market size and forecast 2025-2030

Chart on Asia - Market size and forecast 2025-2030 ($ million)
Data Table on Asia - Market size and forecast 2025-2030 ($ million)
Chart on Asia - Year-over-year growth 2025-2030 (%)
Data Table on Asia - Year-over-year growth 2025-2030 (%)
Chart on Regional Comparison - Asia
Data Table on Regional Comparison - Asia

12.5.1 China - Market size and forecast 2025-2030

Chart on China - Market size and forecast 2025-2030 ($ million)
Data Table on China - Market size and forecast 2025-2030 ($ million)
Chart on China - Year-over-year growth 2025-2030 (%)
Data Table on China - Year-over-year growth 2025-2030 (%)

12.5.2 India - Market size and forecast 2025-2030

Chart on India - Market size and forecast 2025-2030 ($ million)
Data Table on India - Market size and forecast 2025-2030 ($ million)
Chart on India - Year-over-year growth 2025-2030 (%)
Data Table on India - Year-over-year growth 2025-2030 (%)

12.5.3 Japan - Market size and forecast 2025-2030

Chart on Japan - Market size and forecast 2025-2030 ($ million)
Data Table on Japan - Market size and forecast 2025-2030 ($ million)
Chart on Japan - Year-over-year growth 2025-2030 (%)
Data Table on Japan - Year-over-year growth 2025-2030 (%)

12.5.4 South Korea - Market size and forecast 2025-2030

Chart on South Korea - Market size and forecast 2025-2030 ($ million)
Data Table on South Korea - Market size and forecast 2025-2030 ($ million)
Chart on South Korea - Year-over-year growth 2025-2030 (%)
Data Table on South Korea - Year-over-year growth 2025-2030 (%)

12.5.5 Indonesia - Market size and forecast 2025-2030

Chart on Indonesia - Market size and forecast 2025-2030 ($ million)
Data Table on Indonesia - Market size and forecast 2025-2030 ($ million)
Chart on Indonesia - Year-over-year growth 2025-2030 (%)
Data Table on Indonesia - Year-over-year growth 2025-2030 (%)

12.5.6 Thailand - Market size and forecast 2025-2030

Chart on Thailand - Market size and forecast 2025-2030 ($ million)
Data Table on Thailand - Market size and forecast 2025-2030 ($ million)
Chart on Thailand - Year-over-year growth 2025-2030 (%)
Data Table on Thailand - Year-over-year growth 2025-2030 (%)

12.6 Rest of World (ROW) - Market size and forecast 2025-2030

Chart on Rest of World (ROW) - Market size and forecast 2025-2030 ($ million)
Data Table on Rest of World (ROW) - Market size and forecast 2025-2030 ($ million)
Chart on Rest of World (ROW) - Year-over-year growth 2025-2030 (%)
Data Table on Rest of World (ROW) - Year-over-year growth 2025-2030 (%)
Chart on Regional Comparison - Rest of World (ROW)
Data Table on Regional Comparison - Rest of World (ROW)

12.6.1 Brazil - Market size and forecast 2025-2030

Chart on Brazil - Market size and forecast 2025-2030 ($ million)
Data Table on Brazil - Market size and forecast 2025-2030 ($ million)
Chart on Brazil - Year-over-year growth 2025-2030 (%)
Data Table on Brazil - Year-over-year growth 2025-2030 (%)

12.6.2 Saudi Arabia - Market size and forecast 2025-2030

Chart on Saudi Arabia - Market size and forecast 2025-2030 ($ million)
Data Table on Saudi Arabia - Market size and forecast 2025-2030 ($ million)
Chart on Saudi Arabia - Year-over-year growth 2025-2030 (%)
Data Table on Saudi Arabia - Year-over-year growth 2025-2030 (%)

12.6.3 UAE - Market size and forecast 2025-2030

Chart on UAE - Market size and forecast 2025-2030 ($ million)
Data Table on UAE - Market size and forecast 2025-2030 ($ million)
Chart on UAE - Year-over-year growth 2025-2030 (%)
Data Table on UAE - Year-over-year growth 2025-2030 (%)

12.6.4 Turkey - Market size and forecast 2025-2030

Chart on Turkey - Market size and forecast 2025-2030 ($ million)
Data Table on Turkey - Market size and forecast 2025-2030 ($ million)
Chart on Turkey - Year-over-year growth 2025-2030 (%)
Data Table on Turkey - Year-over-year growth 2025-2030 (%)

12.6.5 Argentina - Market size and forecast 2025-2030

Chart on Argentina - Market size and forecast 2025-2030 ($ million)
Data Table on Argentina - Market size and forecast 2025-2030 ($ million)
Chart on Argentina - Year-over-year growth 2025-2030 (%)
Data Table on Argentina - Year-over-year growth 2025-2030 (%)

12.6.6 Colombia - Market size and forecast 2025-2030

Chart on Colombia - Market size and forecast 2025-2030 ($ million)
Data Table on Colombia - Market size and forecast 2025-2030 ($ million)
Chart on Colombia - Year-over-year growth 2025-2030 (%)
Data Table on Colombia - Year-over-year growth 2025-2030 (%)

12.6.7 South Africa - Market size and forecast 2025-2030

Chart on South Africa - Market size and forecast 2025-2030 ($ million)
Data Table on South Africa - Market size and forecast 2025-2030 ($ million)
Chart on South Africa - Year-over-year growth 2025-2030 (%)
Data Table on South Africa - Year-over-year growth 2025-2030 (%)

12.6.8 Israel - Market size and forecast 2025-2030

Chart on Israel - Market size and forecast 2025-2030 ($ million)
Data Table on Israel - Market size and forecast 2025-2030 ($ million)
Chart on Israel - Year-over-year growth 2025-2030 (%)
Data Table on Israel - Year-over-year growth 2025-2030 (%)

12.7 Market opportunity by geography

Market opportunity by geography ($ million)
Data Tables on Market opportunity by geography ($ million)

13. Drivers, Challenges, and Opportunity

13.1 Market drivers

Rising global consumer demand for preventive wellness solutions propels market growth
Increasing clinical validation validates efficacy strategies for standardized traditional medicine formulations
Rapid ecommerce channel expansion enhances distribution network accessibility for international brands

13.2 Market challenges

Fragmented international regulatory frameworks complicate global compliance processes for botanical manufacturers
Severe supply chain disruptions impact procurement quality standards for raw plant extracts
Widespread raw material adulteration undermines consumer confidence regarding premium herbal formulations

13.3 Impact of drivers and challenges

Impact of drivers and challenges in 2025 and 2030

13.4 Market opportunities

Advanced plant cell fermentation technology revolutionizes sustainable cultivation systems globally
Integration into premium functional foods formats attracts diverse younger demographic cohorts
Big pharma strategic partnerships drive consolidation within emerging phytotherapy medical categories

14. Competitive Landscape

14.1 Overview

14.2

Overview on criticality of inputs and factors of differentiation

14.3 Landscape disruption

Overview on factors of disruption

14.4 Industry risks

Impact of key risks on business

15. Competitive Analysis

15.1 Companies profiled

Companies covered

15.2 Company ranking index

15.3 Market positioning of companies

Matrix on companies position and classification

15.4 Amway Corp.

Amway Corp. - Overview
Amway Corp. - Product / Service
Amway Corp. - Key offerings
SWOT

15.5 Boiron SA

Boiron SA - Overview
Boiron SA - Product / Service
Boiron SA - Key offerings
SWOT

15.6 Dabur India Ltd.

Dabur India Ltd. - Overview
Dabur India Ltd. - Business segments
Dabur India Ltd. - Key offerings
Dabur India Ltd. - Segment focus
SWOT

15.7 Gaia Herbs Inc.

Gaia Herbs Inc. - Overview
Gaia Herbs Inc. - Product / Service
Gaia Herbs Inc. - Key offerings
SWOT

15.8 Herbalife International Inc.

Herbalife International Inc. - Overview
Herbalife International Inc. - Product / Service
Herbalife International Inc. - Key offerings
SWOT

15.9 Lotus Herbals Pvt Ltd.

Lotus Herbals Pvt Ltd. - Overview
Lotus Herbals Pvt Ltd. - Product / Service
Lotus Herbals Pvt Ltd. - Key offerings
SWOT

15.10 Natures Answer Inc.

Natures Answer Inc. - Overview
Natures Answer Inc. - Product / Service
Natures Answer Inc. - Key offerings
SWOT

15.11 Natures Bounty

Natures Bounty - Overview
Natures Bounty - Product / Service
Natures Bounty - Key offerings
SWOT

15.12 Patanjali Ayurved Ltd.

Patanjali Ayurved Ltd. - Overview
Patanjali Ayurved Ltd. - Product / Service
Patanjali Ayurved Ltd. - Key offerings
SWOT

15.13 Pukka Herbs Ltd.

Pukka Herbs Ltd. - Overview
Pukka Herbs Ltd. - Product / Service
Pukka Herbs Ltd. - Key offerings
SWOT

15.14 Ricola Group AG

Ricola Group AG - Overview
Ricola Group AG - Product / Service
Ricola Group AG - Key offerings
SWOT

15.15 Solgar Inc.

Solgar Inc. - Overview
Solgar Inc. - Product / Service
Solgar Inc. - Key offerings
SWOT

15.16 The Himalaya Drug Co.

The Himalaya Drug Co. - Overview
The Himalaya Drug Co. - Product / Service
The Himalaya Drug Co. - Key offerings
SWOT

15.17 Traditional Medicinals

Traditional Medicinals - Overview
Traditional Medicinals - Product / Service
Traditional Medicinals - Key offerings
SWOT

15.18 Weleda

Weleda - Overview
Weleda - Product / Service
Weleda - Key offerings
SWOT

16. Appendix

16.1 Scope of the report

Market definition
Objectives
Notes and caveats

16.2 Inclusions and exclusions checklist

Inclusions checklist
Exclusions checklist

16.3 Currency conversion rates for US$

16.4 Research methodology

16.5 Data procurement

Information sources

16.6 Data validation

16.7 Validation techniques employed for market sizing

16.8 Data synthesis

16.9 360 degree market analysis

16.10 List of abbreviations

Research Methodology

Technavio presents a detailed picture of the market by way of study, synthesis, and summation of data from multiple sources. The analysts have presented the various facets of the market with a particular focus on identifying the key industry influencers. The data thus presented is comprehensive, reliable, and the result of extensive research, both primary and secondary.

INFORMATION SOURCES

Primary sources

  • Manufacturers and suppliers
  • Channel partners
  • Industry experts
  • Strategic decision makers

Secondary sources

  • Industry journals and periodicals
  • Government data
  • Financial reports of key industry players
  • Historical data
  • Press releases

DATA ANALYSIS

Data Synthesis

  • Collation of data
  • Estimation of key figures
  • Analysis of derived insights

Data Validation

  • Triangulation with data models
  • Reference against proprietary databases
  • Corroboration with industry experts

REPORT WRITING

Qualitative

  • Market drivers
  • Market challenges
  • Market trends
  • Five forces analysis

Quantitative

  • Market size and forecast
  • Market segmentation
  • Geographical insights
  • Competitive landscape

Interested in this report?

Get your sample now to see our research methodology and insights!

Download Now

Frequently Asked Questions

Herbal market growth will increase by USD 160926.9 million during 2026-2030.

The Herbal market is expected to grow at a CAGR of 7.3% during 2026-2030.

Herbal market is segmented by Delivery (Over the counter, Prescription) Product (Herbal supplements and remedies, Herbal medicine, Herbal cosmetics) Type (Detoxification medicine, Antipyretic medicine, Aigestant medicine, Blood circulation medicine, Others)

A Vogel AG, Amway Corp., Arkopharma Laboratories, Bio Botanica Inc., Bionorica SE, Boiron SA, Dabur India Ltd., Gaia Herbs Inc., Herbalife International Inc., Lotus Herbals Pvt Ltd., Natures Answer Inc., Natures Bounty, Natures Sunshine Products Inc., Patanjali Ayurved Ltd., Pukka Herbs Ltd., Ricola Group AG, Solgar Inc., The Himalaya Drug Co., Traditional Medicinals, Weleda are a few of the key vendors in the Herbal market.

North America will register the highest growth rate of 45.7% among the other regions. Therefore, the Herbal market in North America is expected to garner significant business opportunities for the vendors during the forecast period.

US, Canada, Mexico, Germany, UK, France, Italy, Spain, The Netherlands, China, India, Japan, South Korea, Indonesia, Thailand, Brazil, Saudi Arabia, UAE, Turkey, Argentina, Colombia, South Africa, Israel

  • Rising global consumer demand for preventive wellness solutions propels market growth is the driving factor this market.

The Herbal market vendors should focus on grabbing business opportunities from the Delivery segment as it accounted for the largest market share in the base year.
RIA - Research AI Assistant
Ask RIA
