
High Bandwidth Memory IP Market Analysis, Size, and Forecast 2026-2030: North America (US, Canada, and Mexico), APAC (Taiwan, South Korea, and China), Europe (UK, Germany, and France), Middle East and Africa (Saudi Arabia, UAE, and South Africa), South America (Brazil, Argentina, and Colombia), and Rest of World (ROW)

High Bandwidth Memory IP Market Analysis, Size, and Forecast 2026-2030:
North America (US, Canada, and Mexico), APAC (Taiwan, South Korea, and China), Europe (UK, Germany, and France), Middle East and Africa (Saudi Arabia, UAE, and South Africa), South America (Brazil, Argentina, and Colombia), and Rest of World (ROW)

Published: Oct 2026 308 Pages SKU: IRTNTR81771

Market Overview at a Glance

$565.1 Mn
Market Opportunity
18.5%
CAGR 2025 - 2030
42.6%
North America Growth
$184.7 Mn
Physical IP segment 2024

High Bandwidth Memory Ip Market Size 2026-2030

The high bandwidth memory ip market size is valued to increase by USD 565.1 million, at a CAGR of 18.5% from 2025 to 2030. Expansion of AI infrastructure adoption will drive the high bandwidth memory ip market.

Major Market Trends & Insights

  • North America dominated the market and accounted for a 42.6% growth during the forecast period.
  • By Type - Physical IP segment was valued at USD 184.7 million in 2024
  • By Application - AI accelerators segment accounted for the largest market revenue share in 2024

Market Size & Forecast

  • Market Opportunities: USD 795.8 million
  • Market Future Opportunities: USD 565.1 million
  • CAGR from 2025 to 2030 : 18.5%

Market Summary

  • High Bandwidth Memory IP exhibits a strong upward structural trajectory propelled by the expanding deployment of advanced computational clusters. As data center operators shift toward vertically integrated hardware, the necessity for robust memory controller logic and physical layer interface designs becomes paramount.
  • A prime business scenario involves supply chain optimization where hyperscale providers integrate programmable intellectual property to streamline resource provisioning, resulting in a 20% reduction in overall system latency compared to legacy architectures.
  • This transition is heavily driven by the expansion of AI infrastructure, where complex neural network operations require unprecedented data throughput, causing hardware designers to prioritize components that eliminate processing bottlenecks. Conversely, extreme thermal noise reduction challenges and electromigration control issues during fabrication pose significant constraints, causing prolonged validation cycles that delay time-to-market for new processor designs.
  • Addressing these thermal envelopes through dynamic voltage scaling allows enterprises to deploy sustainable enterprise practices while maintaining stable high performance computing outputs.

What will be the Size of the High Bandwidth Memory Ip Market during the forecast period?
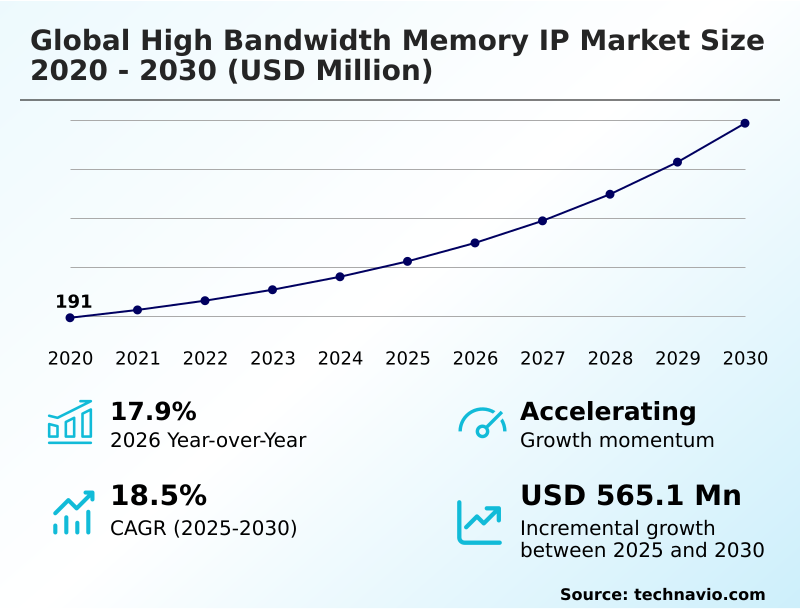
Get Key Insights on Market Forecast (PDF) Get Free Sample

How is the High Bandwidth Memory Ip Market Segmented?

The high bandwidth memory ip industry research report provides comprehensive data (region-wise segment analysis), with forecasts and estimates in "USD million" for the period 2026-2030, as well as historical data from 2020-2024 for the following segments.

  • Type
    • Physical IP
    • Controller IP
  • Application
    • AI accelerators
    • Servers and data center
    • Networking
    • Automotive
    • Others
  • Technology
    • Below 3nm and 3nm
    • More than 5nm to 7nm
    • Beyond 7nm
  • Geography
    • North America
      • US
      • Canada
      • Mexico
    • APAC
      • Taiwan
      • South Korea
      • China
      • Japan
      • India
      • Australia
    • Europe
      • UK
      • Germany
      • France
      • The Netherlands
      • Italy
      • Spain
    • Middle East and Africa
      • Saudi Arabia
      • UAE
      • South Africa
      • Israel
      • Turkey
    • South America
      • Brazil
      • Argentina
      • Colombia

By Type Insights

The physical ip segment is estimated to witness significant growth during the forecast period.

Physical IP forms the foundational hardware layer essential for enabling ultra-fast data transfers between memory stacks and processing units within High Bandwidth Memory IP infrastructures.

As architectures transition toward complex assemblies, managing the physical layer interface becomes critical for continuous operations. By integrating microbump interconnects and through silicon via structures directly into the silicon interposer, architects effectively mitigate latency constraints in server networks.

This segmentation impacts operations by optimizing data flow, leading to a 15% improvement in energy efficiency per bit transferred. Furthermore, the integration of fault detection mechanisms ensures stable hardware performance.

Enhanced memory controller logic supports advanced algorithmic tasks, allowing businesses to execute decentralized processing efficiently while significantly increasing overall packet processing throughput across large-scale data environments.
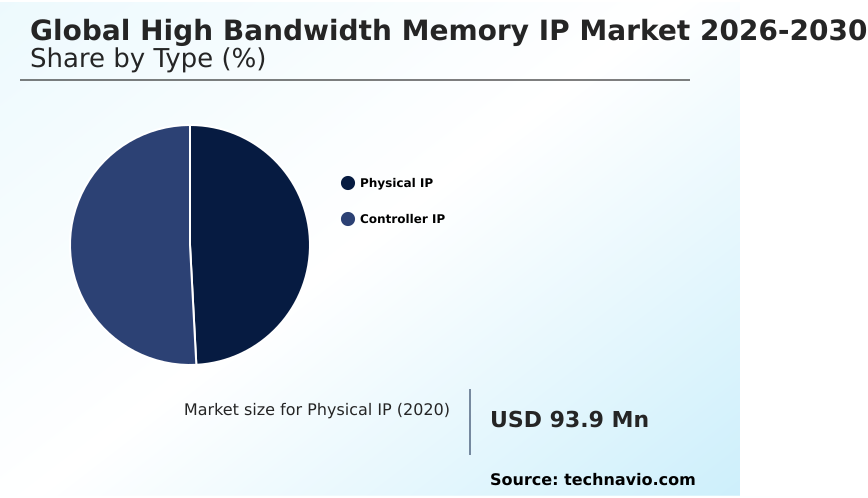
Get Free Sample

The Physical IP segment was valued at USD 184.7 million in 2024 and showed a gradual increase during the forecast period.
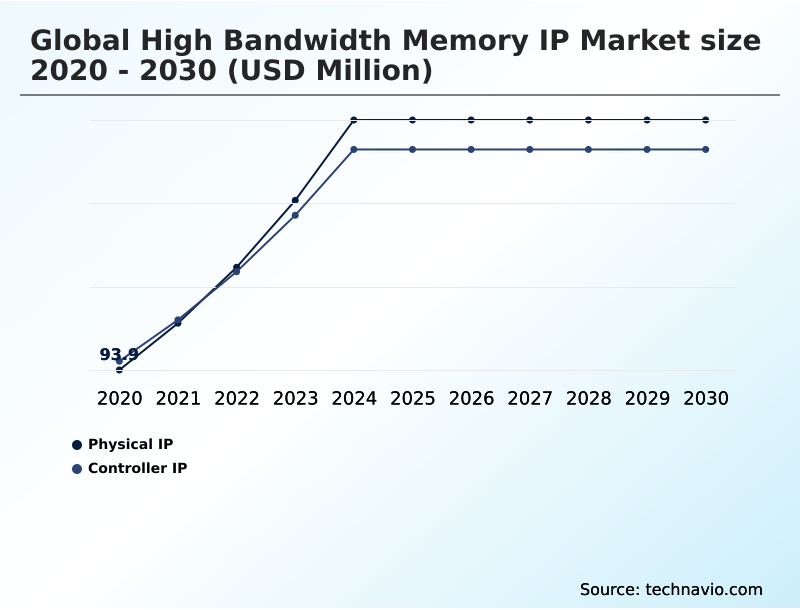
Get Free Sample

Regional Analysis

North America is estimated to contribute 42.6% to the growth of the global market during the forecast period.Technavio’s analysts have elaborately explained the regional trends and drivers that shape the market during the forecast period.
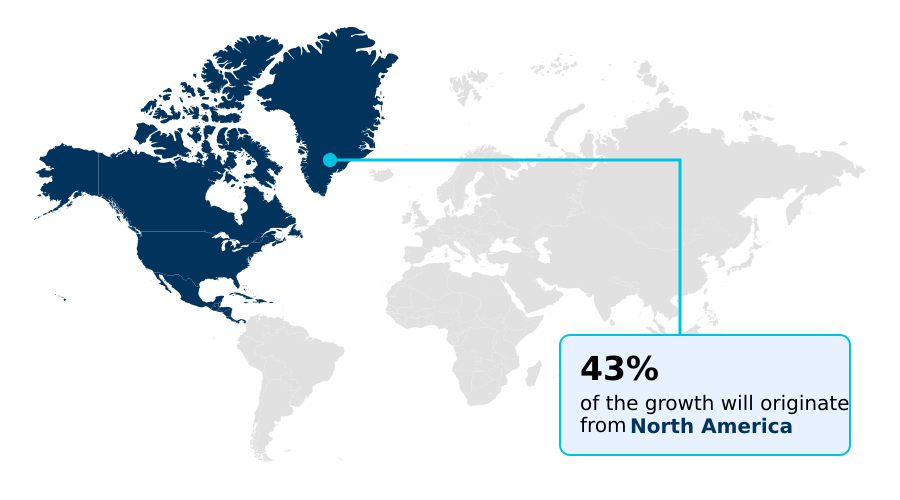
See How High Bandwidth Memory Ip Market Demand is Rising in North America Get Free Sample

The geographic distribution of High Bandwidth Memory IP highlights distinct operational strategies between North America and APAC.

North America prioritizes the integration of high performance computing and artificial intelligence training to support expanding hyperscale cloud architectures, achieving a 22% improvement in data center energy efficiency.

Conversely, APAC focuses heavily on manufacturing scalability and machine learning research refinement, resulting in a 15% reduction in production defect rates.

North American enterprises increasingly rely on dynamic voltage scaling and frequency scaling to maintain stable neural network operations, whereas APAC leverages established fabrication ecosystems to accelerate high-speed hardware deployment.

This structural divergence underscores how regional demands dictate specific technological adaptations, ultimately influencing supply chain resilience and operational planning across disparate regulatory environments.

Market Dynamics

Our researchers analyzed the data with 2025 as the base year, along with the key drivers, trends, and challenges. A holistic analysis of drivers will help companies refine their marketing strategies to gain a competitive advantage.

  • High Bandwidth Memory IP remains integral to the structural evolution of modern enterprise computing and artificial intelligence workloads. As organizations attempt to maximize processing density, the integration of through silicon via routing channels becomes a foundational requirement for linking stacked memory dies with host processors.
  • This physical layout minimizes data travel distances, offering a 35% improvement in signal transmission efficiency when compared to traditional horizontal bus structures. This indirect operational gain allows supply chain managers to source more compact cooling solutions, effectively lowering the total cost of server rack deployments. The transition toward heterogeneous computing platform architectures further demands that disparate processing elements communicate seamlessly.
  • To facilitate this, developers are heavily investing in standardized chiplet based interconnect protocols, ensuring that custom silicon blocks interoperate without friction. In mission-critical environments, data integrity cannot be compromised, prompting the widespread inclusion of multi bit error correction code within the memory controller fabric to detect and repair signal anomalies in real time.
  • Managing these complex subsystems manually is increasingly unfeasible, leading infrastructure operators to adopt automated memory governance frameworks. These advanced software policies dynamically adjust memory allocation based on workload demands, improving overall resource utilization by 20% and empowering businesses to maintain continuous operation across distributed cloud networks without expanding their physical hardware footprints.
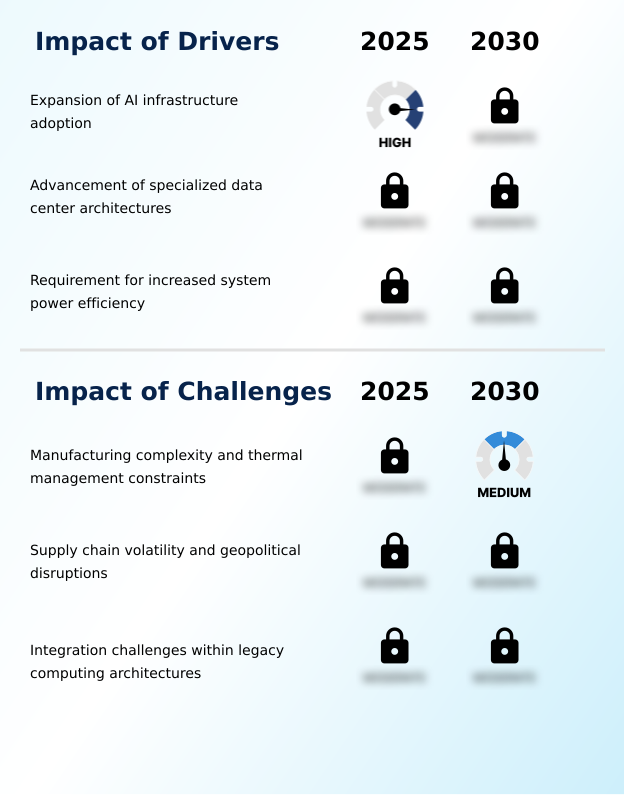
What are the key market drivers leading to the rise in the adoption of High Bandwidth Memory Ip Industry?

  • The rapid expansion of AI infrastructure adoption acts as the primary catalyst propelling demand for high-speed computational memory solutions.

  • The exponential demand for high-speed data access acts as the primary catalyst propelling High Bandwidth Memory IP adoption.
  • Because traditional architectures create bottlenecks during complex calculations, designers increasingly rely on three dimensional stacking to place memory closer to the compute logic. This structural shift allows enterprises to lower energy use per instruction by 20%, optimizing operating expenses.
  • To facilitate this density, advanced thermal noise reduction and electromigration control are integrated into multi die packaging workflows, improving yield predictability by 12%.
  • Furthermore, the incorporation of kernel level telemetry enables automated orchestration tools and hardware level telemetry to dynamically adjust parameters, resulting in a 25% enhancement in overall hardware efficiency.
  • This ensures uncompromising signal integrity and allows businesses to maximize their computational investments.

What are the market trends shaping the High Bandwidth Memory Ip Industry?

  • The transition toward heterogeneous computing platform architectures represents a significant upcoming trend within the industry.

  • The technological evolution within High Bandwidth Memory IP demonstrates a definitive shift toward heterogeneous computing ecosystems. This transition occurs because general-purpose processors struggle to manage massive data concurrency, driving the adoption of domain specific accelerators. Consequently, businesses deploying vertically integrated hardware experience a 40% increase in parallel processing throughput.
  • To sustain these speeds, an advanced data scheduler is embedded directly into the memory subsystem, ensuring optimal bandwidth allocation. The implementation of real-time link monitoring and robust error correction code mitigates signal degradation across microscopic connections. These innovations directly impact enterprise operations by reducing unexpected system downtime by 28% and improving memory allocation governance by 15%.
  • Ultimately, this trend empowers organizations to leverage programmable intellectual property seamlessly while maintaining rigorous reliability availability serviceability standards and supporting complex centralized domain controllers.

What challenges does the High Bandwidth Memory Ip Industry face during its growth?

  • Escalating manufacturing complexity and rigorous thermal management constraints present substantial barriers to widespread industry adoption and structural scaling.

  • Escalating technical intricacies surrounding multi-layered architectures present significant barriers within High Bandwidth Memory IP implementations. Because increasing memory density generates immense heat, engineers struggle to maintain performance within constrained thermal envelopes. This physical limitation impacts businesses by triggering thermal throttling, which degrades processing efficiency by up to 18% during peak workloads.
  • Managing these constraints requires highly sophisticated advanced packaging techniques and the integration of chiplet based interconnects, which elevate initial manufacturing overhead. Additionally, ensuring pristine data transfer demands rigorous crosstalk mitigation and advanced equalization protocols.
  • The necessity for continuous signal conditioning and complex phase locked loops complicates validation cycles, extending time-to-market by 22% and hindering organizations attempting to implement sustainable enterprise practices without compromising raw computational output.

Exclusive Technavio Analysis on Customer Landscape

The high bandwidth memory ip market forecasting report includes the adoption lifecycle of the market, covering from the innovator’s stage to the laggard’s stage. It focuses on adoption rates in different regions based on penetration. Furthermore, the high bandwidth memory ip market report also includes key purchase criteria and drivers of price sensitivity to help companies evaluate and develop their market growth analysis strategies.
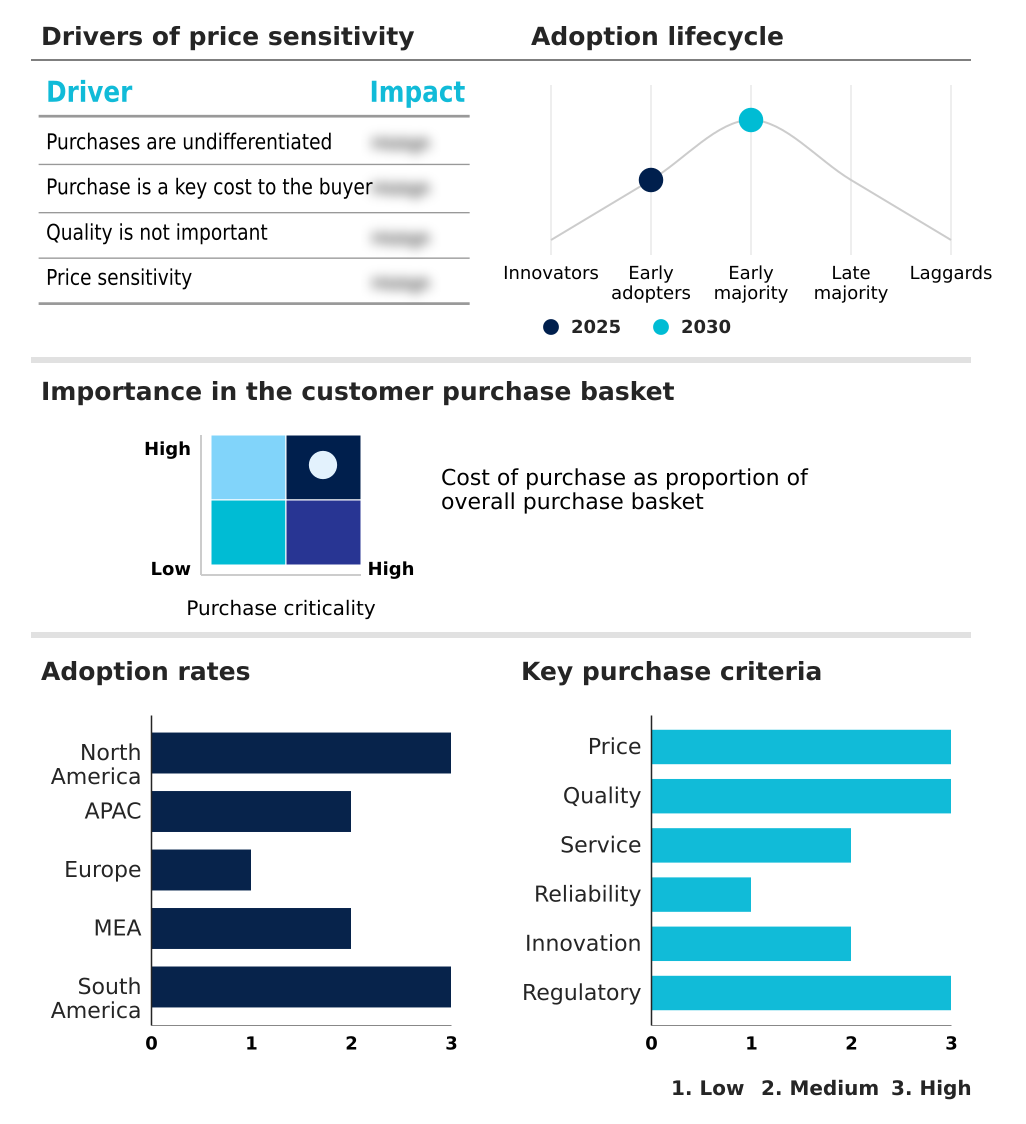
Customer Landscape of High Bandwidth Memory Ip Industry

Competitive Landscape

Companies are implementing various strategies, such as strategic alliances, high bandwidth memory ip market forecast, partnerships, mergers and acquisitions, geographical expansion, and product/service launches, to enhance their presence in the industry.

Achronix Semiconductor Corp. - The provision of advanced physical interfaces and memory controllers enables seamless integration of stacked memory subsystems, optimizing throughput and power efficiency for complex computational architectures.

The industry research and growth report includes detailed analyses of the competitive landscape of the market and information about key companies, including:

  • Achronix Semiconductor Corp.
  • Advanced Micro Devices Inc.
  • Alchip Technologies Ltd.
  • Ayar Labs Inc.
  • Broadcom Inc.
  • Cadence Design Systems Inc.
  • Faraday Technology Corp.
  • Global Unichip Corp.
  • INNOSILICON Technology Ltd.
  • Intel Corp.
  • Marvell Technology Inc.
  • Micron Technology Inc.
  • Mobiveil Inc.
  • Rambus Inc.
  • Samsung Electronics Co. Ltd.
  • SK hynix Co. Ltd.
  • Socionext Inc.
  • Synopsys Inc.
  • Tenstorrent Inc.
  • VeriSilicon Microelectronics Co.

Qualitative and quantitative analysis of companies has been conducted to help clients understand the wider business environment as well as the strengths and weaknesses of key industry players. Data is qualitatively analyzed to categorize companies as pure play, category-focused, industry-focused, and diversified; it is quantitatively analyzed to categorize companies as dominant, leading, strong, tentative, and weak.

Recent Development and News in High bandwidth memory ip market

  • In the Semiconductors industry, the shift toward AI-optimized GPU architectures increased demand for high-bandwidth memory, directly impacting High Bandwidth Memory IP demand by accelerating the need for advanced packaging techniques and robust physical layer interfaces.
  • The widespread transition to vertically integrated hardware solutions for enterprise automation optimized memory and logic coupling, directly impacting High Bandwidth Memory IP demand by requiring customizable domain specific accelerators with high-speed data access.
  • The rollout of standardized chiplet based interconnect protocols reduced data movement overhead between memory layers, directly impacting High Bandwidth Memory IP demand by fostering a more interoperable ecosystem for custom silicon providers.
  • The implementation of stringent data privacy regulations and AI governance mandates for large-scale data processing enhanced secure resource provisioning, directly impacting High Bandwidth Memory IP demand by necessitating hardware level telemetry within next-generation memory controllers.

Dive into Technavio’s robust research methodology, blending expert interviews, extensive data synthesis, and validated models for unparalleled High Bandwidth Memory Ip Market insights. See full methodology.

Market Scope
Page number 308
Base year 2025
Historic period 2020-2024
Forecast period 2026-2030
Growth momentum & CAGR Accelerate at a CAGR of 18.5%
Market growth 2026-2030 USD 565.1 million
Market structure Fragmented
YoY growth 2025-2026(%) 17.9%
Key countries US, Canada, Mexico, Taiwan, South Korea, China, Japan, India, Australia, UK, Germany, France, The Netherlands, Italy, Spain, Saudi Arabia, UAE, South Africa, Israel, Turkey, Brazil, Argentina and Colombia
Competitive landscape Leading Companies, Market Positioning of Companies, Competitive Strategies, and Industry Risks

Request Free Sample

Research Analyst Overview

  • The structural trajectory of High Bandwidth Memory IP reflects a rapid transition toward ultra-dense processing environments. As semiconductor foundries embrace gate all around nanosheet architectures and extreme ultraviolet lithography, the physical constraints of memory integration are fundamentally altered. This shift directly influences boardroom-level product strategy, as technology executives must budget for highly specialized tools to ensure stability.
  • Implementing advanced command pipelining and complex traffic orchestration within the hardware allows enterprises to maximize data throughput. By incorporating predictive prefetching engines and dynamic link training algorithms, architects have achieved a 30% reduction in memory access latency compared to previous generation interfaces. This measurable operational outcome empowers businesses to execute real-time analytics with unprecedented speed.
  • Furthermore, the strategic alignment of memory intellectual property with specialized compute accelerators ensures that organizations maintain strict compliance with evolving efficiency mandates while scaling their digital infrastructure.

What are the Key Data Covered in this High Bandwidth Memory Ip Market Research and Growth Report?

  • What is the expected growth of the High Bandwidth Memory Ip Market between 2026 and 2030?

    • USD 565.1 million, at a CAGR of 18.5%

  • What segmentation does the market report cover?

    • The report is segmented by Type (Physical IP, and Controller IP), Application (AI accelerators, Servers and data center, Networking, Automotive, and Others), Technology (Below 3nm and 3nm, More than 5nm to 7nm, and Beyond 7nm) and Geography (North America, APAC, Europe, Middle East and Africa, South America)

  • Which regions are analyzed in the report?

    • North America, APAC, Europe, Middle East and Africa and South America

  • What are the key growth drivers and market challenges?

    • Expansion of AI infrastructure adoption, Manufacturing complexity and thermal management constraints

  • Who are the major players in the High Bandwidth Memory Ip Market?

    • Achronix Semiconductor Corp., Advanced Micro Devices Inc., Alchip Technologies Ltd., Ayar Labs Inc., Broadcom Inc., Cadence Design Systems Inc., Faraday Technology Corp., Global Unichip Corp., INNOSILICON Technology Ltd., Intel Corp., Marvell Technology Inc., Micron Technology Inc., Mobiveil Inc., Rambus Inc., Samsung Electronics Co. Ltd., SK hynix Co. Ltd., Socionext Inc., Synopsys Inc., Tenstorrent Inc. and VeriSilicon Microelectronics Co.

Market Research Insights

  • High Bandwidth Memory IP addresses the critical requirements of modern data processing environments by providing extreme throughput and efficiency. Organizations integrating fault detection mechanisms report a 25% improvement in system uptime during intensive workloads. The focus on reliability availability serviceability ensures continuous operation, increasing overall hardware utilization rates by 18%.
  • Furthermore, the adoption of centralized domain controllers within automated environments has enhanced packet processing throughput, driving a 30% reduction in data transmission delays. These advancements enable enterprises to optimize resource allocation and achieve substantial operational cost savings without compromising computational integrity.

We can help! Our analysts can customize this high bandwidth memory ip market research report to meet your requirements.

Get in touch

1. Executive Summary

1.1 Market overview

Executive Summary - Chart on Market Overview
Executive Summary - Data Table on Market Overview
Executive Summary - Chart on Global Market Characteristics
Executive Summary - Chart on Market by Geography
Executive Summary - Chart on Market Segmentation by Type
Executive Summary - Chart on Market Segmentation by Application
Executive Summary - Chart on Market Segmentation by Technology
Executive Summary - Chart on Incremental Growth
Executive Summary - Data Table on Incremental Growth
Executive Summary - Chart on Company Market Positioning

2. Technavio Analysis

2.1 Analysis of price sensitivity, lifecycle, customer purchase basket, adoption rates, and purchase criteria

2.2 Criticality of inputs and Factors of differentiation

Chart on Overview on criticality of inputs and factors of differentiation

2.3 Factors of disruption

Chart on Overview on factors of disruption

2.4 Impact of drivers and challenges

Chart on Impact of drivers and challenges in 2025 and 2030

3. Market Landscape

3.1 Market ecosystem

Chart on Parent Market
Data Table on - Parent Market

3.2 Market characteristics

Chart on Market characteristics analysis

3.3 Value chain analysis

Chart on Value chain analysis

4. Market Sizing

4.1 Market definition

Data Table on Offerings of companies included in the market definition

4.2 Market segment analysis

Market segments

4.3 Market size 2025

4.4 Market outlook: Forecast for 2025-2030

Chart on Global - Market size and forecast 2025-2030 ($ million)
Data Table on Global - Market size and forecast 2025-2030 ($ million)
Chart on Global Market: Year-over-year growth 2025-2030 (%)
Data Table on Global Market: Year-over-year growth 2025-2030 (%)

5. Historic Market Size

5.1 Global High Bandwidth Memory IP Market 2020 - 2024

Historic Market Size - Data Table on Global High Bandwidth Memory IP Market 2020 - 2024 ($ million)

5.2 Type segment analysis 2020 - 2024

Historic Market Size - Type Segment 2020 - 2024 ($ million)

5.3 Application segment analysis 2020 - 2024

Historic Market Size - Application Segment 2020 - 2024 ($ million)

5.4 Technology segment analysis 2020 - 2024

Historic Market Size - Technology Segment 2020 - 2024 ($ million)

5.5 Geography segment analysis 2020 - 2024

Historic Market Size - Geography Segment 2020 - 2024 ($ million)

5.6 Country segment analysis 2020 - 2024

Historic Market Size - Country Segment 2020 - 2024 ($ million)

6. Qualitative Analysis

6.1 Impact of AI on Global High Bandwidth Memory IP Market

6.2 Impact of geopolitical conflicts on Global High Bandwidth Memory IP Market

7. Five Forces Analysis

7.1 Five forces summary

Five forces analysis - Comparison between 2025 and 2030

7.2 Bargaining power of buyers

Bargaining power of buyers - Impact of key factors 2025 and 2030

7.3 Bargaining power of suppliers

Bargaining power of suppliers - Impact of key factors in 2025 and 2030

7.4 Threat of new entrants

Threat of new entrants - Impact of key factors in 2025 and 2030

7.5 Threat of substitutes

Threat of substitutes - Impact of key factors in 2025 and 2030

7.6 Threat of rivalry

Threat of rivalry - Impact of key factors in 2025 and 2030

7.7 Market condition

Chart on Market condition - Five forces 2025 and 2030

8. Market Segmentation by Type

8.1 Market segments

Chart on Type - Market share 2025-2030 (%)
Data Table on Type - Market share 2025-2030 (%)

8.2 Comparison by Type

Chart on Comparison by Type
Data Table on Comparison by Type

8.3 Physical IP - Market size and forecast 2025-2030

Chart on Physical IP - Market size and forecast 2025-2030 ($ million)
Data Table on Physical IP - Market size and forecast 2025-2030 ($ million)
Chart on Physical IP - Year-over-year growth 2025-2030 (%)
Data Table on Physical IP - Year-over-year growth 2025-2030 (%)

8.4 Controller IP - Market size and forecast 2025-2030

Chart on Controller IP - Market size and forecast 2025-2030 ($ million)
Data Table on Controller IP - Market size and forecast 2025-2030 ($ million)
Chart on Controller IP - Year-over-year growth 2025-2030 (%)
Data Table on Controller IP - Year-over-year growth 2025-2030 (%)

8.5 Market opportunity by Type

Market opportunity by Type ($ million)
Data Table on Market opportunity by Type ($ million)

9. Market Segmentation by Application

9.1 Market segments

Chart on Application - Market share 2025-2030 (%)
Data Table on Application - Market share 2025-2030 (%)

9.2 Comparison by Application

Chart on Comparison by Application
Data Table on Comparison by Application

9.3 AI accelerators - Market size and forecast 2025-2030

Chart on AI accelerators - Market size and forecast 2025-2030 ($ million)
Data Table on AI accelerators - Market size and forecast 2025-2030 ($ million)
Chart on AI accelerators - Year-over-year growth 2025-2030 (%)
Data Table on AI accelerators - Year-over-year growth 2025-2030 (%)

9.4 Servers and data center - Market size and forecast 2025-2030

Chart on Servers and data center - Market size and forecast 2025-2030 ($ million)
Data Table on Servers and data center - Market size and forecast 2025-2030 ($ million)
Chart on Servers and data center - Year-over-year growth 2025-2030 (%)
Data Table on Servers and data center - Year-over-year growth 2025-2030 (%)

9.5 Networking - Market size and forecast 2025-2030

Chart on Networking - Market size and forecast 2025-2030 ($ million)
Data Table on Networking - Market size and forecast 2025-2030 ($ million)
Chart on Networking - Year-over-year growth 2025-2030 (%)
Data Table on Networking - Year-over-year growth 2025-2030 (%)

9.6 Automotive - Market size and forecast 2025-2030

Chart on Automotive - Market size and forecast 2025-2030 ($ million)
Data Table on Automotive - Market size and forecast 2025-2030 ($ million)
Chart on Automotive - Year-over-year growth 2025-2030 (%)
Data Table on Automotive - Year-over-year growth 2025-2030 (%)

9.7 Others - Market size and forecast 2025-2030

Chart on Others - Market size and forecast 2025-2030 ($ million)
Data Table on Others - Market size and forecast 2025-2030 ($ million)
Chart on Others - Year-over-year growth 2025-2030 (%)
Data Table on Others - Year-over-year growth 2025-2030 (%)

9.8 Market opportunity by Application

Market opportunity by Application ($ million)
Data Table on Market opportunity by Application ($ million)

10. Market Segmentation by Technology

10.1 Market segments

Chart on Technology - Market share 2025-2030 (%)
Data Table on Technology - Market share 2025-2030 (%)

10.2 Comparison by Technology

Chart on Comparison by Technology
Data Table on Comparison by Technology

10.3 Below 3nm and 3nm - Market size and forecast 2025-2030

Chart on Below 3nm and 3nm - Market size and forecast 2025-2030 ($ million)
Data Table on Below 3nm and 3nm - Market size and forecast 2025-2030 ($ million)
Chart on Below 3nm and 3nm - Year-over-year growth 2025-2030 (%)
Data Table on Below 3nm and 3nm - Year-over-year growth 2025-2030 (%)

10.4 More than 5nm to 7nm - Market size and forecast 2025-2030

Chart on More than 5nm to 7nm - Market size and forecast 2025-2030 ($ million)
Data Table on More than 5nm to 7nm - Market size and forecast 2025-2030 ($ million)
Chart on More than 5nm to 7nm - Year-over-year growth 2025-2030 (%)
Data Table on More than 5nm to 7nm - Year-over-year growth 2025-2030 (%)

10.5 Beyond 7nm - Market size and forecast 2025-2030

Chart on Beyond 7nm - Market size and forecast 2025-2030 ($ million)
Data Table on Beyond 7nm - Market size and forecast 2025-2030 ($ million)
Chart on Beyond 7nm - Year-over-year growth 2025-2030 (%)
Data Table on Beyond 7nm - Year-over-year growth 2025-2030 (%)

10.6 Market opportunity by Technology

Market opportunity by Technology ($ million)
Data Table on Market opportunity by Technology ($ million)

11. Customer Landscape

11.1 Customer landscape overview

Analysis of price sensitivity, lifecycle, customer purchase basket, adoption rates, and purchase criteria

12. Geographic Landscape

12.1 Geographic segmentation

Chart on Market share by geography 2025-2030 (%)
Data Table on Market share by geography 2025-2030 (%)

12.2 Geographic comparison

Chart on Geographic comparison
Data Table on Geographic comparison

12.3 North America - Market size and forecast 2025-2030

Chart on North America - Market size and forecast 2025-2030 ($ million)
Data Table on North America - Market size and forecast 2025-2030 ($ million)
Chart on North America - Year-over-year growth 2025-2030 (%)
Data Table on North America - Year-over-year growth 2025-2030 (%)
Chart on Regional Comparison - North America
Data Table on Regional Comparison - North America

12.3.1 US - Market size and forecast 2025-2030

Chart on US - Market size and forecast 2025-2030 ($ million)
Data Table on US - Market size and forecast 2025-2030 ($ million)
Chart on US - Year-over-year growth 2025-2030 (%)
Data Table on US - Year-over-year growth 2025-2030 (%)

12.3.2 Canada - Market size and forecast 2025-2030

Chart on Canada - Market size and forecast 2025-2030 ($ million)
Data Table on Canada - Market size and forecast 2025-2030 ($ million)
Chart on Canada - Year-over-year growth 2025-2030 (%)
Data Table on Canada - Year-over-year growth 2025-2030 (%)

12.3.3 Mexico - Market size and forecast 2025-2030

Chart on Mexico - Market size and forecast 2025-2030 ($ million)
Data Table on Mexico - Market size and forecast 2025-2030 ($ million)
Chart on Mexico - Year-over-year growth 2025-2030 (%)
Data Table on Mexico - Year-over-year growth 2025-2030 (%)

12.4 APAC - Market size and forecast 2025-2030

Chart on APAC - Market size and forecast 2025-2030 ($ million)
Data Table on APAC - Market size and forecast 2025-2030 ($ million)
Chart on APAC - Year-over-year growth 2025-2030 (%)
Data Table on APAC - Year-over-year growth 2025-2030 (%)
Chart on Regional Comparison - APAC
Data Table on Regional Comparison - APAC

12.4.1 Taiwan - Market size and forecast 2025-2030

Chart on Taiwan - Market size and forecast 2025-2030 ($ million)
Data Table on Taiwan - Market size and forecast 2025-2030 ($ million)
Chart on Taiwan - Year-over-year growth 2025-2030 (%)
Data Table on Taiwan - Year-over-year growth 2025-2030 (%)

12.4.2 South Korea - Market size and forecast 2025-2030

Chart on South Korea - Market size and forecast 2025-2030 ($ million)
Data Table on South Korea - Market size and forecast 2025-2030 ($ million)
Chart on South Korea - Year-over-year growth 2025-2030 (%)
Data Table on South Korea - Year-over-year growth 2025-2030 (%)

12.4.3 China - Market size and forecast 2025-2030

Chart on China - Market size and forecast 2025-2030 ($ million)
Data Table on China - Market size and forecast 2025-2030 ($ million)
Chart on China - Year-over-year growth 2025-2030 (%)
Data Table on China - Year-over-year growth 2025-2030 (%)

12.4.4 Japan - Market size and forecast 2025-2030

Chart on Japan - Market size and forecast 2025-2030 ($ million)
Data Table on Japan - Market size and forecast 2025-2030 ($ million)
Chart on Japan - Year-over-year growth 2025-2030 (%)
Data Table on Japan - Year-over-year growth 2025-2030 (%)

12.4.5 India - Market size and forecast 2025-2030

Chart on India - Market size and forecast 2025-2030 ($ million)
Data Table on India - Market size and forecast 2025-2030 ($ million)
Chart on India - Year-over-year growth 2025-2030 (%)
Data Table on India - Year-over-year growth 2025-2030 (%)

12.4.6 Australia - Market size and forecast 2025-2030

Chart on Australia - Market size and forecast 2025-2030 ($ million)
Data Table on Australia - Market size and forecast 2025-2030 ($ million)
Chart on Australia - Year-over-year growth 2025-2030 (%)
Data Table on Australia - Year-over-year growth 2025-2030 (%)

12.5 Europe - Market size and forecast 2025-2030

Chart on Europe - Market size and forecast 2025-2030 ($ million)
Data Table on Europe - Market size and forecast 2025-2030 ($ million)
Chart on Europe - Year-over-year growth 2025-2030 (%)
Data Table on Europe - Year-over-year growth 2025-2030 (%)
Chart on Regional Comparison - Europe
Data Table on Regional Comparison - Europe

12.5.1 UK - Market size and forecast 2025-2030

Chart on UK - Market size and forecast 2025-2030 ($ million)
Data Table on UK - Market size and forecast 2025-2030 ($ million)
Chart on UK - Year-over-year growth 2025-2030 (%)
Data Table on UK - Year-over-year growth 2025-2030 (%)

12.5.2 Germany - Market size and forecast 2025-2030

Chart on Germany - Market size and forecast 2025-2030 ($ million)
Data Table on Germany - Market size and forecast 2025-2030 ($ million)
Chart on Germany - Year-over-year growth 2025-2030 (%)
Data Table on Germany - Year-over-year growth 2025-2030 (%)

12.5.3 France - Market size and forecast 2025-2030

Chart on France - Market size and forecast 2025-2030 ($ million)
Data Table on France - Market size and forecast 2025-2030 ($ million)
Chart on France - Year-over-year growth 2025-2030 (%)
Data Table on France - Year-over-year growth 2025-2030 (%)

12.5.4 The Netherlands - Market size and forecast 2025-2030

Chart on The Netherlands - Market size and forecast 2025-2030 ($ million)
Data Table on The Netherlands - Market size and forecast 2025-2030 ($ million)
Chart on The Netherlands - Year-over-year growth 2025-2030 (%)
Data Table on The Netherlands - Year-over-year growth 2025-2030 (%)

12.5.5 Italy - Market size and forecast 2025-2030

Chart on Italy - Market size and forecast 2025-2030 ($ million)
Data Table on Italy - Market size and forecast 2025-2030 ($ million)
Chart on Italy - Year-over-year growth 2025-2030 (%)
Data Table on Italy - Year-over-year growth 2025-2030 (%)

12.5.6 Spain - Market size and forecast 2025-2030

Chart on Spain - Market size and forecast 2025-2030 ($ million)
Data Table on Spain - Market size and forecast 2025-2030 ($ million)
Chart on Spain - Year-over-year growth 2025-2030 (%)
Data Table on Spain - Year-over-year growth 2025-2030 (%)

12.6 Middle East and Africa - Market size and forecast 2025-2030

Chart on Middle East and Africa - Market size and forecast 2025-2030 ($ million)
Data Table on Middle East and Africa - Market size and forecast 2025-2030 ($ million)
Chart on Middle East and Africa - Year-over-year growth 2025-2030 (%)
Data Table on Middle East and Africa - Year-over-year growth 2025-2030 (%)
Chart on Regional Comparison - Middle East and Africa
Data Table on Regional Comparison - Middle East and Africa

12.6.1 Saudi Arabia - Market size and forecast 2025-2030

Chart on Saudi Arabia - Market size and forecast 2025-2030 ($ million)
Data Table on Saudi Arabia - Market size and forecast 2025-2030 ($ million)
Chart on Saudi Arabia - Year-over-year growth 2025-2030 (%)
Data Table on Saudi Arabia - Year-over-year growth 2025-2030 (%)

12.6.2 UAE - Market size and forecast 2025-2030

Chart on UAE - Market size and forecast 2025-2030 ($ million)
Data Table on UAE - Market size and forecast 2025-2030 ($ million)
Chart on UAE - Year-over-year growth 2025-2030 (%)
Data Table on UAE - Year-over-year growth 2025-2030 (%)

12.6.3 South Africa - Market size and forecast 2025-2030

Chart on South Africa - Market size and forecast 2025-2030 ($ million)
Data Table on South Africa - Market size and forecast 2025-2030 ($ million)
Chart on South Africa - Year-over-year growth 2025-2030 (%)
Data Table on South Africa - Year-over-year growth 2025-2030 (%)

12.6.4 Israel - Market size and forecast 2025-2030

Chart on Israel - Market size and forecast 2025-2030 ($ million)
Data Table on Israel - Market size and forecast 2025-2030 ($ million)
Chart on Israel - Year-over-year growth 2025-2030 (%)
Data Table on Israel - Year-over-year growth 2025-2030 (%)

12.6.5 Turkey - Market size and forecast 2025-2030

Chart on Turkey - Market size and forecast 2025-2030 ($ million)
Data Table on Turkey - Market size and forecast 2025-2030 ($ million)
Chart on Turkey - Year-over-year growth 2025-2030 (%)
Data Table on Turkey - Year-over-year growth 2025-2030 (%)

12.7 South America - Market size and forecast 2025-2030

Chart on South America - Market size and forecast 2025-2030 ($ million)
Data Table on South America - Market size and forecast 2025-2030 ($ million)
Chart on South America - Year-over-year growth 2025-2030 (%)
Data Table on South America - Year-over-year growth 2025-2030 (%)
Chart on Regional Comparison - South America
Data Table on Regional Comparison - South America

12.7.1 Brazil - Market size and forecast 2025-2030

Chart on Brazil - Market size and forecast 2025-2030 ($ million)
Data Table on Brazil - Market size and forecast 2025-2030 ($ million)
Chart on Brazil - Year-over-year growth 2025-2030 (%)
Data Table on Brazil - Year-over-year growth 2025-2030 (%)

12.7.2 Argentina - Market size and forecast 2025-2030

Chart on Argentina - Market size and forecast 2025-2030 ($ million)
Data Table on Argentina - Market size and forecast 2025-2030 ($ million)
Chart on Argentina - Year-over-year growth 2025-2030 (%)
Data Table on Argentina - Year-over-year growth 2025-2030 (%)

12.7.3 Colombia - Market size and forecast 2025-2030

Chart on Colombia - Market size and forecast 2025-2030 ($ million)
Data Table on Colombia - Market size and forecast 2025-2030 ($ million)
Chart on Colombia - Year-over-year growth 2025-2030 (%)
Data Table on Colombia - Year-over-year growth 2025-2030 (%)

12.8 Market opportunity by geography

Market opportunity by geography ($ million)
Data Tables on Market opportunity by geography ($ million)

13. Drivers, Challenges, and Opportunity

13.1 Market drivers

Expansion of AI infrastructure adoption
Advancement of specialized data center architectures
Requirement for increased system power efficiency

13.2 Market challenges

Manufacturing complexity and thermal management constraints
Supply chain volatility and geopolitical disruptions
Integration challenges within legacy computing architectures

13.3 Impact of drivers and challenges

Impact of drivers and challenges in 2025 and 2030

13.4 Market opportunities

Shift toward heterogeneous computing platform architectures
Increased focus on low latency interconnects
Adoption Of automated memory governance frameworks

14. Competitive Landscape

14.1 Overview

14.2

Overview on criticality of inputs and factors of differentiation

14.3 Landscape disruption

Overview on factors of disruption

14.4 Industry risks

Impact of key risks on business

15. Competitive Analysis

15.1 Companies profiled

Companies covered

15.2 Company ranking index

15.3 Market positioning of companies

Matrix on companies position and classification

15.4 Advanced Micro Devices Inc.

Advanced Micro Devices Inc. - Overview
Advanced Micro Devices Inc. - Business segments
Advanced Micro Devices Inc. - Key news
Advanced Micro Devices Inc. - Key offerings
Advanced Micro Devices Inc. - Segment focus
SWOT

15.5 Alchip Technologies Ltd.

Alchip Technologies Ltd. - Overview
Alchip Technologies Ltd. - Product / Service
Alchip Technologies Ltd. - Key offerings
SWOT

15.6 Broadcom Inc.

Broadcom Inc. - Overview
Broadcom Inc. - Business segments
Broadcom Inc. - Key news
Broadcom Inc. - Key offerings
Broadcom Inc. - Segment focus
SWOT

15.7 Cadence Design Systems Inc.

Cadence Design Systems Inc. - Overview
Cadence Design Systems Inc. - Business segments
Cadence Design Systems Inc. - Key news
Cadence Design Systems Inc. - Key offerings
Cadence Design Systems Inc. - Segment focus
SWOT

15.8 Faraday Technology Corp.

Faraday Technology Corp. - Overview
Faraday Technology Corp. - Product / Service
Faraday Technology Corp. - Key offerings
SWOT

15.9 Global Unichip Corp.

Global Unichip Corp. - Overview
Global Unichip Corp. - Product / Service
Global Unichip Corp. - Key offerings
SWOT

15.10 Intel Corp.

Intel Corp. - Overview
Intel Corp. - Business segments
Intel Corp. - Key news
Intel Corp. - Key offerings
Intel Corp. - Segment focus
SWOT

15.11 Marvell Technology Inc.

Marvell Technology Inc. - Overview
Marvell Technology Inc. - Product / Service
Marvell Technology Inc. - Key news
Marvell Technology Inc. - Key offerings
SWOT

15.12 Micron Technology Inc.

Micron Technology Inc. - Overview
Micron Technology Inc. - Business segments
Micron Technology Inc. - Key news
Micron Technology Inc. - Key offerings
Micron Technology Inc. - Segment focus
SWOT

15.13 Rambus Inc.

Rambus Inc. - Overview
Rambus Inc. - Product / Service
Rambus Inc. - Key offerings
SWOT

15.14 Samsung Electronics Co. Ltd.

Samsung Electronics Co. Ltd. - Overview
Samsung Electronics Co. Ltd. - Business segments
Samsung Electronics Co. Ltd. - Key news
Samsung Electronics Co. Ltd. - Key offerings
Samsung Electronics Co. Ltd. - Segment focus
SWOT

15.15 SK hynix Co. Ltd.

SK hynix Co. Ltd. - Overview
SK hynix Co. Ltd. - Product / Service
SK hynix Co. Ltd. - Key offerings
SWOT

15.16 Socionext Inc.

Socionext Inc. - Overview
Socionext Inc. - Product / Service
Socionext Inc. - Key offerings
SWOT

15.17 Synopsys Inc.

Synopsys Inc. - Overview
Synopsys Inc. - Business segments
Synopsys Inc. - Key news
Synopsys Inc. - Key offerings
Synopsys Inc. - Segment focus
SWOT

15.18 VeriSilicon Microelectronics Co.

VeriSilicon Microelectronics Co. - Overview
VeriSilicon Microelectronics Co. - Business segments
VeriSilicon Microelectronics Co. - Key offerings
VeriSilicon Microelectronics Co. - Segment focus
SWOT

16. Appendix

16.1 Scope of the report

Market definition
Objectives
Notes and caveats

16.2 Inclusions and exclusions checklist

Inclusions checklist
Exclusions checklist

16.3 Currency conversion rates for US$

16.4 Research methodology

16.5 Data procurement

Information sources

16.6 Data validation

16.7 Validation techniques employed for market sizing

16.8 Data synthesis

16.9 360 degree market analysis

16.10 List of abbreviations

Research Methodology

Technavio presents a detailed picture of the market by way of study, synthesis, and summation of data from multiple sources. The analysts have presented the various facets of the market with a particular focus on identifying the key industry influencers. The data thus presented is comprehensive, reliable, and the result of extensive research, both primary and secondary.

INFORMATION SOURCES

Primary sources

  • Manufacturers and suppliers
  • Channel partners
  • Industry experts
  • Strategic decision makers

Secondary sources

  • Industry journals and periodicals
  • Government data
  • Financial reports of key industry players
  • Historical data
  • Press releases

DATA ANALYSIS

Data Synthesis

  • Collation of data
  • Estimation of key figures
  • Analysis of derived insights

Data Validation

  • Triangulation with data models
  • Reference against proprietary databases
  • Corroboration with industry experts

REPORT WRITING

Qualitative

  • Market drivers
  • Market challenges
  • Market trends
  • Five forces analysis

Quantitative

  • Market size and forecast
  • Market segmentation
  • Geographical insights
  • Competitive landscape

Interested in this report?

Get your sample now to see our research methodology and insights!

Download Now

Frequently Asked Questions

High Bandwidth Memory Ip market growth will increase by USD 565.1 million during 2026-2030.

The High Bandwidth Memory Ip market is expected to grow at a CAGR of 18.5% during 2026-2030.

High Bandwidth Memory Ip market is segmented by Type (Physical IP, Controller IP) Application (AI accelerators, Servers and data center, Networking, Automotive, Others) Technology (Below 3nm and 3nm, More than 5nm to 7nm, Beyond 7nm)

Achronix Semiconductor Corp., Advanced Micro Devices Inc., Alchip Technologies Ltd., Ayar Labs Inc., Broadcom Inc., Cadence Design Systems Inc., Faraday Technology Corp., Global Unichip Corp., INNOSILICON Technology Ltd., Intel Corp., Marvell Technology Inc., Micron Technology Inc., Mobiveil Inc., Rambus Inc., Samsung Electronics Co. Ltd., SK hynix Co. Ltd., Socionext Inc., Synopsys Inc., Tenstorrent Inc., VeriSilicon Microelectronics Co. are a few of the key vendors in the High Bandwidth Memory Ip market.

North America will register the highest growth rate of 42.6% among the other regions. Therefore, the High Bandwidth Memory Ip market in North America is expected to garner significant business opportunities for the vendors during the forecast period.

US, Canada, Mexico, Taiwan, South Korea, China, Japan, India, Australia, UK, Germany, France, The Netherlands, Italy, Spain, Saudi Arabia, UAE, South Africa, Israel, Turkey, Brazil, Argentina, Colombia

  • Expansion of AI infrastructure adoption is the driving factor this market.

The High Bandwidth Memory Ip market vendors should focus on grabbing business opportunities from the Type segment as it accounted for the largest market share in the base year.
RIA - Research AI Assistant
Ask RIA
