High Power Charger For Electric Vehicle (Ev) Market Analysis APAC, North America, Europe, South America, Middle East and Africa - China, US, Germany, France, The Netherlands - Size and Forecast 2024-2028

High Power Charger For Electric Vehicle (Ev) Market Analysis APAC, North America, Europe, South America, Middle East and Africa - China, US, Germany, France, The Netherlands - Size and Forecast 2024-2028

Published: Jul 2024 163 Pages SKU: IRTNTR75050

Market Overview at a Glance

$117.49 B
Market Opportunity
58.37%
CAGR
41.79
YoY growth 2023-2024(%)

High Power Charger For Electric Vehicle Market Size 2024-2028

The High Power Charger For Electric Vehicle Market size is estimated to grow by USD 117.48 billion, at a CAGR of 58.37% between 2023 and 2028. The market is experiencing significant growth, driven by increasing consumer demand and favorable regulations. This trend is spurring the need for robust and reliable EV charging infrastructure. Key offerings in this space include fast-charging stations, smart charging systems, and wireless charging technology. Favorable standards for electrical connectors, such as the Combined Charging System (CCS) and the Combined Charging System Type 2 (CCS Type 2), ensure compatibility and interoperability between charging stations and EV models. As EV sales continue to rise, the importance of well-built and efficient charging infrastructure becomes increasingly crucial to support the growing number of electric vehicles on the road.

What will be the High Power Charger for Market Size During the Forecast Period?

High Power Charger For Electric Vehicle (Ev) Market Size

To learn more about this report, Request Free Sample

Market Dynamics

The market is pivotal in accelerating the adoption of Battery Electric Vehicles (BEVs) worldwide. As auto sales transition towards sustainable options, non-renewable energy giants are investing in infrastructure compatible with RFID technology and cloud-computing platforms to enhance electric car charging infrastructure under initiatives like the FAME India Scheme. High Power Chargers play a crucial role in supporting the electric mobility industry, enabling fast-charging systems alongside traditional charging stations to facilitate long-distance travel and ensure mainstream EV adoption. They cater to both the public and private segments, accommodating various connector types, including CHAdeMO, for efficient charging solutions in the sustainable transportation sector, reducing dependence on fossil fuel-dependent cars, and promoting environmental conservation.

Key Market Driver

The increasing EV sales are notably driving market growth. Incentives and subsidies from governments and regulators around the world are driving the growth of the electric vehicles market. Governments in various countries are giving financial incentives to buyers according to battery size. For example, the Sustainable Energy Authority of Ireland (SEAI) is offering buyers up to USD 5,500 to USD 6,000 subsidy, as well as exemption from vehicle registration tax.

In the US, the federal government is giving hefty tax credits for new battery and plug-in hybrid electric vehicles, ranging from USD 2,500 to USD 7,500, depending on the battery capacity. All battery EVs are eligible for the full USD 7,500, but some plug-in hybrid models with smaller batteries qualify for less. In addition, Italian buyers of fully electric or hybrid vehicles are exempt from annual registration tax for five years after vehicle purchase. Five years after that, they could benefit from a 75% reduction in the equivalent tax rate on most petrol cars. Such tax incentives will increase the demand and drive the growth of the market during the forecast period. 

Significant Market Trend

Recent developments in high power chargers for EVs are a key trend influencing the market. The market is seeing an increase in new product launches. The addition of new products will encourage more consumers to purchase a variety of high-power chargers according to their needs. Align with market trends and analysis, the increasing number of new product launches also increases competition in the market, leading to innovation and differentiation.

New product launches encourage consumers to try different products, and manufacturers are also focusing on developing new products such as a revolutionary all-in-one (EV) charger that offers end-users the fastest charging experience, the launch of a new Chinese-made V3 supercharger station by Tesla motors, the launch of latest EV charging infrastructure portfolio in New Zealand via a partnership between Siemens and YHI energy. Such developments are expected to boost the growth of the market during the forecast period. 

Major Market Challenge

The lack of charging infrastructure in potential markets is challenging the market. Infrastructure plays a key role in selling. Finding a suitable charging infrastructure remains the biggest challenge for owners. Unlike internal combustion engine (ICE) vehicle owners, EV owners do not benefit from standardized refueling facilities. Poor communication of needs and requirements for building easily accessible charging networks is a major concern in the market. For example, finding EV charging infrastructure is the biggest hurdle preventing the mass adoption of EVs in India. Charging infrastructure is either difficult to implement or non-existent in most cities where EVs are the most viable mode of transportation. However, Mahindra and Mahindra Ltd have been unable to grow EV sales in 2022, mainly due to insufficient urban charging infrastructure. Electric bikes could not be sold in India for the same reason. Public awareness campaigns on EV prevalence and required charging infrastructure are needed for public and private companies to better understand EVs in such countries.

Governments play a key role in the development of EV charging infrastructure. Governments around the world offer tax breaks and subsidies for the purchase. However, their focus on developing and deploying better-charging infrastructure is marginal. For example, Norway, the Netherlands, and Denmark are making rapid progress in subsidizing EV sales and developing EV charging infrastructure, while countries such as Germany and the United Kingdom have seen a significant increase in infrastructure investment compared to total EV sales per year. There are not yet enough subsidies to drive development. These factors will, therefore, challenge the growth of the market during the forecast period. 

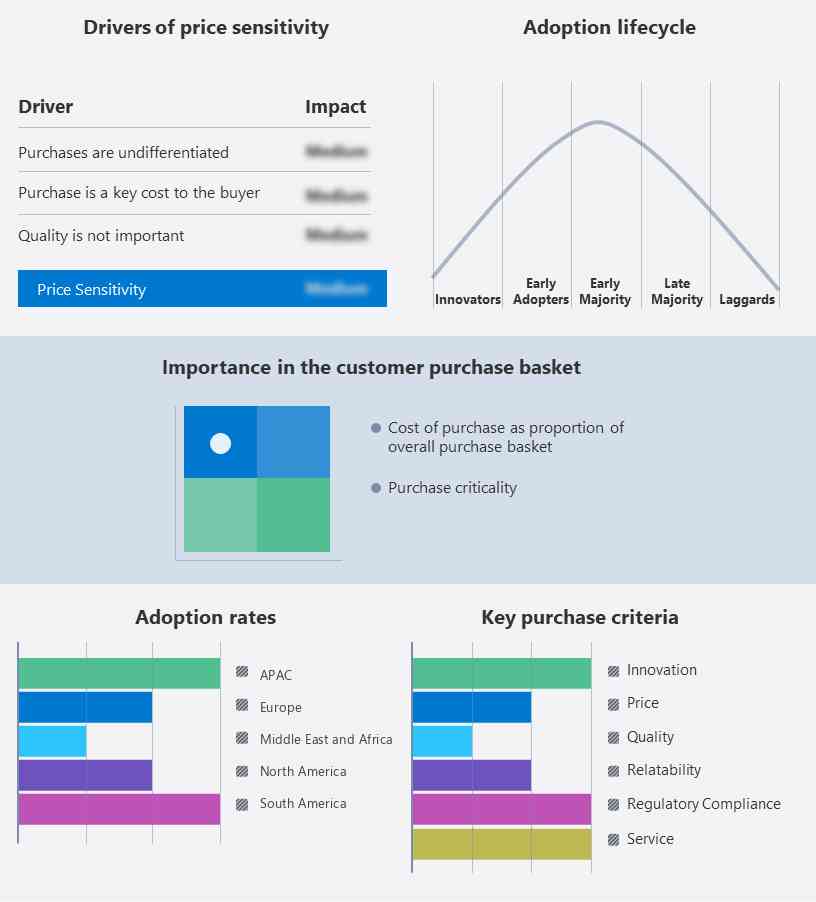
Key Market Customer Landscape

The market report includes the adoption lifecycle of the market, covering from the innovator’s stage to the laggard’s stage. It focuses on adoption rates in different regions based on penetration. Furthermore, the report also includes key purchase criteria and drivers of price sensitivity to help companies evaluate and develop their growth strategies.

High Power Charger For Electric Vehicle Market Share by Geography

Global Market Customer Landscape

Who are the Major Market companies?

Companies are implementing various strategies, such as strategic alliances, partnerships, mergers and acquisitions, geographical expansion, and product/service launches, to enhance their presence in the market.

ABB Ltd: The company provides a control room, charging infrastructure, and industrial software solutions along with that it also provides low-voltage products and systems.

The market analysis and report also includes detailed analyses of the competitive landscape of the market growth and forecasting and information about 15 market companies, including:

  • Blink Charging Co.
  • BorgWarner Inc.
  • Chargemaster NZ
  • ChargePoint Inc.
  • ClipperCreek Inc.
  • EV Safe Charge Inc.
  • EVBox BV
  • FLO Services USA Inc.
  • Hyundai Motor Co.
  • Infineon Technologies AG
  • Leviton Manufacturing Co. Inc.
  • Robert Bosch GmbH
  • Shenzhen Shenghong Electric Co. Ltd.
  • Siemens AG
  • Tesla Inc.
  • VOLTERIO GmbH
  • WiTricity Corp.
  • Zhejiang Benyi Electrical Co. Ltd.
  • Tata Motors Ltd.

Qualitative and quantitative analysis of vendors has been conducted to help clients understand the wider business environment as well as the strengths and weaknesses of key market players. Data is qualitatively analyzed to categorize vendors as pure play, category-focused, industry-focused, and diversified; it is quantitatively analyzed to categorize vendors as dominant, leading, strong, tentative, and weak.

Market Segmentation

By Type

The market share growth by the 50 KW-less than 150 KW segment will be significant during the forecast period. Vendors mainly use high-power chargers for their PHEV or BEV electric vehicles to ensure higher performance. High-power chargers are used in these vehicles to provide fast charging capabilities. Popular PHEVs or BEVs with high-performance engines include the BMW i3 (125 KW), BMW i8 (98 KW), GM Spark EV (105 KW), GM Bolt EV (150 KW), Mercedes-Benz E- B-class drive (132 KW). As the demand increases, so does the need for high-performance chargers. These chargers can provide more than 50kW of charge to EVs and are typically used to charge EVs with a range of 150km or less. High-power chargers are typically found at public charging stations and can charge in minutes.

High Power Charger For Electric Vehicle (Ev) Market Size

Get a glance at the market contribution of various segments Request a PDF Sample

The 50 KW-less than 150 KW segment was valued at USD 1.75 billion in 2018. Using a high-capacity charger has several advantages. First, drivers can quickly charge their car batteries. This is especially useful while traveling long distances. Second, high-power chargers can significantly reduce the time required to charge. And third, it can extend the range by providing higher charging rates. These factors will drive the segment of the High Power Charger For EV Market to grow from HE 50KW to below 150KW during the forecast period. 

By Region

High Power Charger For Electric Vehicle (Ev) Market Share by Geography

For more insights on the market share of various regions Request PDF Sample now!

APAC is estimated to contribute 43% to the growth of the market during the forecast period. Technavio’s analysts have elaborately explained the regional market growth and trends that shape the market during the forecast period. China will have the most EVs deployed in 2022 and is expected to produce the most EVs in APAC in 2027. China, Japan, and South Korea are three countries in Asia that are world leaders in the field of this and electromobility. South Korea is technologically strong, but Japan and China hold strong positions in terms of production and market size. The market for high-capacity EV chargers growing in China, where the world's largest number of EVs are sold. In addition to electric cars and private cars, public transport in China is also electrified. Such deployment of electric buses by governments for private or public transport, fueled by the growing need to reduce air pollution in countries across APAC, will result in large-capacity vehicles. Demand for chargers is expected to spur the growth of the Market in APAC during the forecast period. 

Segment Overview

The market research report provides comprehensive data (region-wise segment analysis), with forecasts and estimates in "USD billion " for the period 2024-2028, as well as historical data from 2018-2022 for the following segments.

  • Type Outlook 
    • 50 KW-less than 150 KW
    • 150 KW-350 KW
    • 350 KW and above
  • Application Outlook 
    • Plug-in hybrid electric vehicle
    • Battery electric vehicle
  • Region Outlook 
    • North America
      • The U.S.
      • Canada
    • Europe
      • The U.K.
      • Germany
      • France
      • Rest of Europe
    • APAC
      • China
      • India
    • South America
      • Chile
      • Brazil
    • Middle East & Africa
      • Saudi Arabia
      • South Africa
      • Rest of the Middle East & Africa

You may also interested in the below market reports

Market Analyst Overview

The market is rapidly evolving with advancements in vehicle electrification and stringent safety norms driving demand for advanced technology solutions. Catering to the 50-150 kW charger category, innovations like the Velion DC Fast Charger and Level 3 DC Fast Chargers from Hitachi Industrial Products are pivotal in expanding electric vehicle infrastructure worldwide. These chargers address high-power technology needs while overcoming space constraints and optimizing energy management with competitive power tariffs. As consumer sentiment shifts toward environmental awareness and reducing environmental pollution and greenhouse gases, the market emphasizes green energy solutions and biofuels integration supported by regulatory bodies like the California Air Resources Board promoting zero-emission vehicles. Integrated battery diagnostic systems such as E-HEALTH Charge and E-CHARGE 20 battery charger enhance reliability and efficiency, positioning the DC fast charging system sector for robust growth in the global EV battery charger market.

The introduction of EV fast-charging systems supported by Cloud-Computing Platform marks a significant step towards reducing carbon emissions in urban and transportation planning. As advancements in battery technology and smart grid technology improve, addressing range anxiety and accommodating GB/T standard connector types become priorities. This aligns with government legislation and initiatives by energy providers and infrastructure developers to promote eco-friendly transportation through renewable energy sources. The market introduction of these systems not only impacts the public and private segments but also underscores the industrial impact on achieving environmental goals and fostering environmental consciousness. This integrated approach is pivotal in transitioning away from internal combustion engine vehicles towards sustainable mobility solutions, shaping the future of urban landscapes and global transportation networks. The Level 3 DC Fast Charger integrates high energy capabilities with advanced energy management technologies, enhancing electric motor efficiency while supporting battery diagnostic system and promoting respiratory health through reduced emissions.

Market Scope

Report Coverage

Details

Page number

163

Base year

2023

Historic period

2018 - 2022

Forecast period

2024-2028

Growth momentum & CAGR

Accelerate at a CAGR of 58.37%

Market growth 2024-2028

USD 117.48 billion

Market structure

Fragmented

YoY growth 2023-2024(%)

41.79

Regional analysis

APAC, North America, Europe, South America, and Middle East and Africa

Performing market contribution

APAC at 43%

Key countries

China, US, Germany, France, and The Netherlands

Competitive landscape

Leading Companies, Market Positioning of Companies, Competitive Strategies, and Industry Risks

Key companies profiled

ABB Ltd., Blink Charging Co., BorgWarner Inc., Chargemaster NZ, ChargePoint Holdings Inc., ClipperCreek Inc., EV Safe Charge Inc., EVBox BV, FLO Services USA Inc., Hyundai Motor Co., Infineon Technologies AG, Leviton Manufacturing Co. Inc., Robert Bosch GmbH, Sinexcel, Siemens AG, Tata Motors Ltd., Tesla Inc., VOLTERIO GmbH, WiTricity Corp., and Zhejiang Benyi Electrical Co. Ltd.

Market dynamics

Parent market analysis, Market Forecasting, Market growth inducers and obstacles, Fast-growing and slow-growing segment analysis, Market growth and Forecasting, COVID 19 impact and recovery analysis and future consumer dynamics, Market condition analysis for market forecast period

Customization purview

If our report has not included the data that you are looking for, you can reach out to our analysts and get segments customized.

Request Free Sample

What are the Key Data Covered in this Market Report?

  • CAGR of the market during the forecast period
  • Detailed information on factors that will drive the market growth and forecasting of the market between 2024 and 2028
  • Precise estimation of the size of the market size and its contribution to the parent market
  • Accurate predictions about upcoming market trends and analysis and changes in consumer behavior
  • Growth of the market industry across Europe, North America, APAC, South America, and Middle East and Africa
  • Thorough market growth analysis of the market’s competitive landscape and detailed information about companies
  • Comprehensive market analysis and report on the factors that will challenge the market research and growth of market companies

We can help! Our analysts can customize this report to meet your requirements. Get in touch

1 Executive Summary

  • 1.1 Market overview
    • Executive Summary - Chart on Market Overview
    • Executive Summary - Data Table on Market Overview
    • Executive Summary - Chart on Global Market Characteristics
    • Executive Summary - Chart on Market by Geography
    • Executive Summary - Chart on Market Segmentation by Type
    • Executive Summary - Chart on Market Segmentation by Application
    • Executive Summary - Chart on Incremental Growth
    • Executive Summary - Data Table on Incremental Growth
    • Executive Summary - Chart on Company Market Positioning

2 Market Landscape

  • 2.1 Market ecosystem
    • Parent Market
    • Data Table on - Parent Market
  • 2.2 Market characteristics
    • Market characteristics analysis
  • 2.3 Value chain analysis
    • Value Chain Analysis

3 Market Sizing

  • 3.1 Market definition
    • Offerings of companies included in the market definition
  • 3.2 Market segment analysis
    • Market segments
  • 3.3 Market size 2023
    • 3.4 Market outlook: Forecast for 2023-2028
      • Chart on Global - Market size and forecast 2023-2028 ($ million)
      • Data Table on Global - Market size and forecast 2023-2028 ($ million)
      • Chart on Global Market: Year-over-year growth 2023-2028 (%)
      • Data Table on Global Market: Year-over-year growth 2023-2028 (%)

    4 Historic Market Size

    • 4.1 Global High Power Charger For Electric Vehicle (EV) Market 2018 - 2022
      • Historic Market Size - Data Table on Global High Power Charger For Electric Vehicle (EV) Market 2018 - 2022 ($ million)
    • 4.2 Type segment analysis 2018 - 2022
      • Historic Market Size - Type Segment 2018 - 2022 ($ million)
    • 4.3 Application segment analysis 2018 - 2022
      • Historic Market Size - Application Segment 2018 - 2022 ($ million)
    • 4.4 Geography segment analysis 2018 - 2022
      • Historic Market Size - Geography Segment 2018 - 2022 ($ million)
    • 4.5 Country segment analysis 2018 - 2022
      • Historic Market Size - Country Segment 2018 - 2022 ($ million)

    5 Five Forces Analysis

    • 5.1 Five forces summary
      • Five forces analysis - Comparison between 2023 and 2028
    • 5.2 Bargaining power of buyers
      • Bargaining power of buyers - Impact of key factors 2023 and 2028
    • 5.3 Bargaining power of suppliers
      • Bargaining power of suppliers - Impact of key factors in 2023 and 2028
    • 5.4 Threat of new entrants
      • Threat of new entrants - Impact of key factors in 2023 and 2028
    • 5.5 Threat of substitutes
      • Threat of substitutes - Impact of key factors in 2023 and 2028
    • 5.6 Threat of rivalry
      • Threat of rivalry - Impact of key factors in 2023 and 2028
    • 5.7 Market condition
      • Chart on Market condition - Five forces 2023 and 2028

    6 Market Segmentation by Type

    • 6.1 Market segments
      • Chart on Type - Market share 2023-2028 (%)
      • Data Table on Type - Market share 2023-2028 (%)
    • 6.2 Comparison by Type
      • Chart on Comparison by Type
      • Data Table on Comparison by Type
    • 50 kW-less than 150 kW - Market size and forecast 2023-2028
      • Chart on 50 kW-less than 150 kW - Market size and forecast 2023-2028 ($ million)
      • Data Table on 50 kW-less than 150 kW - Market size and forecast 2023-2028 ($ million)
      • Chart on 50 kW-less than 150 kW - Year-over-year growth 2023-2028 (%)
      • Data Table on 50 kW-less than 150 kW - Year-over-year growth 2023-2028 (%)
    • 150 kW-350 kW - Market size and forecast 2023-2028
      • Chart on 150 kW-350 kW - Market size and forecast 2023-2028 ($ million)
      • Data Table on 150 kW-350 kW - Market size and forecast 2023-2028 ($ million)
      • Chart on 150 kW-350 kW - Year-over-year growth 2023-2028 (%)
      • Data Table on 150 kW-350 kW - Year-over-year growth 2023-2028 (%)
    • 350 kW and above - Market size and forecast 2023-2028
      • Chart on 350 kW and above - Market size and forecast 2023-2028 ($ million)
      • Data Table on 350 kW and above - Market size and forecast 2023-2028 ($ million)
      • Chart on 350 kW and above - Year-over-year growth 2023-2028 (%)
      • Data Table on 350 kW and above - Year-over-year growth 2023-2028 (%)
    • 6.6 Market opportunity by Type
      • Market opportunity by Type ($ million)
      • Data Table on Market opportunity by Type ($ million)

    7 Market Segmentation by Application

    • 7.1 Market segments
      • Chart on Application - Market share 2023-2028 (%)
      • Data Table on Application - Market share 2023-2028 (%)
    • 7.2 Comparison by Application
      • Chart on Comparison by Application
      • Data Table on Comparison by Application
    • 7.3 Plug-in hybrid electric vehicle - Market size and forecast 2023-2028
      • Chart on Plug-in hybrid electric vehicle - Market size and forecast 2023-2028 ($ million)
      • Data Table on Plug-in hybrid electric vehicle - Market size and forecast 2023-2028 ($ million)
      • Chart on Plug-in hybrid electric vehicle - Year-over-year growth 2023-2028 (%)
      • Data Table on Plug-in hybrid electric vehicle - Year-over-year growth 2023-2028 (%)
    • 7.4 Battery electric vehicle - Market size and forecast 2023-2028
      • Chart on Battery electric vehicle - Market size and forecast 2023-2028 ($ million)
      • Data Table on Battery electric vehicle - Market size and forecast 2023-2028 ($ million)
      • Chart on Battery electric vehicle - Year-over-year growth 2023-2028 (%)
      • Data Table on Battery electric vehicle - Year-over-year growth 2023-2028 (%)
    • 7.5 Market opportunity by Application
      • Market opportunity by Application ($ million)
      • Data Table on Market opportunity by Application ($ million)

    8 Customer Landscape

    • 8.1 Customer landscape overview
      • Analysis of price sensitivity, lifecycle, customer purchase basket, adoption rates, and purchase criteria

    9 Geographic Landscape

    • 9.1 Geographic segmentation
      • Chart on Market share by geography 2023-2028 (%)
      • Data Table on Market share by geography 2023-2028 (%)
    • 9.2 Geographic comparison
      • Chart on Geographic comparison
      • Data Table on Geographic comparison
    • 9.3 APAC - Market size and forecast 2023-2028
      • Chart on APAC - Market size and forecast 2023-2028 ($ million)
      • Data Table on APAC - Market size and forecast 2023-2028 ($ million)
      • Chart on APAC - Year-over-year growth 2023-2028 (%)
      • Data Table on APAC - Year-over-year growth 2023-2028 (%)
    • 9.4 North America - Market size and forecast 2023-2028
      • Chart on North America - Market size and forecast 2023-2028 ($ million)
      • Data Table on North America - Market size and forecast 2023-2028 ($ million)
      • Chart on North America - Year-over-year growth 2023-2028 (%)
      • Data Table on North America - Year-over-year growth 2023-2028 (%)
    • 9.5 Europe - Market size and forecast 2023-2028
      • Chart on Europe - Market size and forecast 2023-2028 ($ million)
      • Data Table on Europe - Market size and forecast 2023-2028 ($ million)
      • Chart on Europe - Year-over-year growth 2023-2028 (%)
      • Data Table on Europe - Year-over-year growth 2023-2028 (%)
    • 9.6 South America - Market size and forecast 2023-2028
      • Chart on South America - Market size and forecast 2023-2028 ($ million)
      • Data Table on South America - Market size and forecast 2023-2028 ($ million)
      • Chart on South America - Year-over-year growth 2023-2028 (%)
      • Data Table on South America - Year-over-year growth 2023-2028 (%)
    • 9.7 Middle East and Africa - Market size and forecast 2023-2028
      • Chart on Middle East and Africa - Market size and forecast 2023-2028 ($ million)
      • Data Table on Middle East and Africa - Market size and forecast 2023-2028 ($ million)
      • Chart on Middle East and Africa - Year-over-year growth 2023-2028 (%)
      • Data Table on Middle East and Africa - Year-over-year growth 2023-2028 (%)
    • 9.8 China - Market size and forecast 2023-2028
      • Chart on China - Market size and forecast 2023-2028 ($ million)
      • Data Table on China - Market size and forecast 2023-2028 ($ million)
      • Chart on China - Year-over-year growth 2023-2028 (%)
      • Data Table on China - Year-over-year growth 2023-2028 (%)
    • 9.9 US - Market size and forecast 2023-2028
      • Chart on US - Market size and forecast 2023-2028 ($ million)
      • Data Table on US - Market size and forecast 2023-2028 ($ million)
      • Chart on US - Year-over-year growth 2023-2028 (%)
      • Data Table on US - Year-over-year growth 2023-2028 (%)
    • 9.10 Germany - Market size and forecast 2023-2028
      • Chart on Germany - Market size and forecast 2023-2028 ($ million)
      • Data Table on Germany - Market size and forecast 2023-2028 ($ million)
      • Chart on Germany - Year-over-year growth 2023-2028 (%)
      • Data Table on Germany - Year-over-year growth 2023-2028 (%)
    • 9.11 France - Market size and forecast 2023-2028
      • Chart on France - Market size and forecast 2023-2028 ($ million)
      • Data Table on France - Market size and forecast 2023-2028 ($ million)
      • Chart on France - Year-over-year growth 2023-2028 (%)
      • Data Table on France - Year-over-year growth 2023-2028 (%)
    • 9.12 The Netherlands - Market size and forecast 2023-2028
      • Chart on The Netherlands - Market size and forecast 2023-2028 ($ million)
      • Data Table on The Netherlands - Market size and forecast 2023-2028 ($ million)
      • Chart on The Netherlands - Year-over-year growth 2023-2028 (%)
      • Data Table on The Netherlands - Year-over-year growth 2023-2028 (%)
    • 9.13 Market opportunity by geography
      • Market opportunity by geography ($ million)
      • Data Tables on Market opportunity by geography ($ million)

    10 Drivers, Challenges, and Opportunity/Restraints

    • 10.1 Market drivers
      • 10.2 Market challenges
        • 10.3 Impact of drivers and challenges
          • Impact of drivers and challenges in 2023 and 2028
        • 10.4 Market opportunities/restraints

          11 Competitive Landscape

          • 11.1 Overview
            • 11.2 Competitive Landscape
              • Overview on criticality of inputs and factors of differentiation
            • 11.3 Landscape disruption
              • Overview on factors of disruption
            • 11.4 Industry risks
              • Impact of key risks on business

            12 Competitive Analysis

            • 12.1 Companies profiled
              • Companies covered
            • 12.2 Market positioning of companies
              • Matrix on companies position and classification
            • 12.3 ABB Ltd.
              • ABB Ltd. - Overview
              • ABB Ltd. - Business segments
              • ABB Ltd. - Key news
              • ABB Ltd. - Key offerings
              • ABB Ltd. - Segment focus
            • 12.4 Blink Charging Co.
              • Blink Charging Co. - Overview
              • Blink Charging Co. - Product / Service
              • Blink Charging Co. - Key news
              • Blink Charging Co. - Key offerings
            • 12.5 BorgWarner Inc.
              • BorgWarner Inc. - Overview
              • BorgWarner Inc. - Business segments
              • BorgWarner Inc. - Key news
              • BorgWarner Inc. - Key offerings
              • BorgWarner Inc. - Segment focus
            • 12.6 Chargemaster NZ
              • Chargemaster NZ - Overview
              • Chargemaster NZ - Product / Service
              • Chargemaster NZ - Key offerings
            • 12.7 ChargePoint Holdings Inc.
              • ChargePoint Holdings Inc. - Overview
              • ChargePoint Holdings Inc. - Product / Service
              • ChargePoint Holdings Inc. - Key news
              • ChargePoint Holdings Inc. - Key offerings
            • 12.8 ClipperCreek Inc.
              • ClipperCreek Inc. - Overview
              • ClipperCreek Inc. - Product / Service
              • ClipperCreek Inc. - Key offerings
            • 12.9 EV Safe Charge Inc.
              • EV Safe Charge Inc. - Overview
              • EV Safe Charge Inc. - Product / Service
              • EV Safe Charge Inc. - Key offerings
            • 12.10 EVBox BV
              • EVBox BV - Overview
              • EVBox BV - Product / Service
              • EVBox BV - Key offerings
            • 12.11 FLO Services USA Inc.
              • FLO Services USA Inc. - Overview
              • FLO Services USA Inc. - Product / Service
              • FLO Services USA Inc. - Key news
              • FLO Services USA Inc. - Key offerings
            • 12.12 Hyundai Motor Co.
              • Hyundai Motor Co. - Overview
              • Hyundai Motor Co. - Business segments
              • Hyundai Motor Co. - Key news
              • Hyundai Motor Co. - Key offerings
              • Hyundai Motor Co. - Segment focus
            • 12.13 Infineon Technologies AG
              • Infineon Technologies AG - Overview
              • Infineon Technologies AG - Business segments
              • Infineon Technologies AG - Key news
              • Infineon Technologies AG - Key offerings
              • Infineon Technologies AG - Segment focus
            • 12.14 Leviton Manufacturing Co. Inc.
              • Leviton Manufacturing Co. Inc. - Overview
              • Leviton Manufacturing Co. Inc. - Product / Service
              • Leviton Manufacturing Co. Inc. - Key offerings
            • 12.15 Robert Bosch GmbH
              • Robert Bosch GmbH - Overview
              • Robert Bosch GmbH - Product / Service
              • Robert Bosch GmbH - Key news
              • Robert Bosch GmbH - Key offerings
            • 12.16 Siemens AG
              • Siemens AG - Overview
              • Siemens AG - Business segments
              • Siemens AG - Key news
              • Siemens AG - Key offerings
              • Siemens AG - Segment focus
            • 12.17 VOLTERIO GmbH
              • VOLTERIO GmbH - Overview
              • VOLTERIO GmbH - Product / Service
              • VOLTERIO GmbH - Key offerings

            13 Appendix

            • 13.1 Scope of the report
              • 13.2 Inclusions and exclusions checklist
                • Inclusions checklist
                • Exclusions checklist
              • 13.3 Currency conversion rates for US$
                • Currency conversion rates for US$
              • 13.4 Research methodology
                • Research methodology
              • 13.5 Data procurement
                • Information sources
              • 13.6 Data validation
                • Data validation
              • 13.7 Validation techniques employed for market sizing
                • Validation techniques employed for market sizing
              • 13.8 Data synthesis
                • Data synthesis
              • 13.9 360 degree market analysis
                • 360 degree market analysis
              • 13.10 List of abbreviations
                • List of abbreviations

              Research Methodology

              Technavio presents a detailed picture of the market by way of study, synthesis, and summation of data from multiple sources. The analysts have presented the various facets of the market with a particular focus on identifying the key industry influencers. The data thus presented is comprehensive, reliable, and the result of extensive research, both primary and secondary.

              INFORMATION SOURCES

              Primary sources

              • Manufacturers and suppliers
              • Channel partners
              • Industry experts
              • Strategic decision makers

              Secondary sources

              • Industry journals and periodicals
              • Government data
              • Financial reports of key industry players
              • Historical data
              • Press releases

              DATA ANALYSIS

              Data Synthesis

              • Collation of data
              • Estimation of key figures
              • Analysis of derived insights

              Data Validation

              • Triangulation with data models
              • Reference against proprietary databases
              • Corroboration with industry experts

              REPORT WRITING

              Qualitative

              • Market drivers
              • Market challenges
              • Market trends
              • Five forces analysis

              Quantitative

              • Market size and forecast
              • Market segmentation
              • Geographical insights
              • Competitive landscape

              Interested in this report?

              Get your sample now to see our research methodology and insights!

              Download Now

              Frequently Asked Questions

              High Power Charger For Electric Vehicle (Ev) market growth will increase by $ 117486.1 mn during 2024-2028 .

              The High Power Charger For Electric Vehicle (Ev) market is expected to grow at a CAGR of 58.37% during 2024-2028 .

              High Power Charger For Electric Vehicle (Ev) market is segmented by Type( 50 kW-less than 150 kW, 150 kW-350 kW, 350 kW and above) Application( Plug-in hybrid electric vehicle, Battery electric vehicle)

              ABB Ltd., Blink Charging Co., BorgWarner Inc., Chargemaster NZ, ChargePoint Holdings Inc., ClipperCreek Inc., EV Safe Charge Inc., EVBox BV, FLO Services USA Inc., Hyundai Motor Co., Infineon Technologies AG, Leviton Manufacturing Co. Inc., Robert Bosch GmbH, Sinexcel, Siemens AG, Tata Motors Ltd., Tesla Inc., VOLTERIO GmbH, WiTricity Corp., Zhejiang Benyi Electrical Co. Ltd. are a few of the key vendors in the High Power Charger For Electric Vehicle (Ev) market.

              APAC will register the highest growth rate of 43% among the other regions. Therefore, the High Power Charger For Electric Vehicle (Ev) market in APAC is expected to garner significant business opportunities for the vendors during the forecast period.

              China, US, Germany, France, The Netherlands

              • Increasing EV sales spurring demand for well-built EV charging infrastructureIncentives and subsidies provided by governments and regulatory bodies globally have been driving the growth of the EV market. The governments of various countries have extended financial incentives to EV buyers is the driving factor this market.
              • depending on the size of the batteries. For instance is the driving factor this market.
              • the Sustainable Energy Authority of Ireland (SEAI) provides grants of up to $5 is the driving factor this market.
              • 500-$6 is the driving factor this market.
              • 000 and an exemption from vehicle registration tax to EV buyers. In the US is the driving factor this market.
              • the federal government provides a substantial tax credit for new battery EVs and plug-in hybrid EVs is the driving factor this market.
              • ranging from $2 is the driving factor this market.
              • 500 to $7 is the driving factor this market.
              • 500 is the driving factor this market.
              • depending on the capacity of the EV's battery. All battery EVs are eligible for the full $7 is the driving factor this market.
              • 500 is the driving factor this market.
              • whereas some plug-in hybrid models with smaller batteries receive a lower amount. Further is the driving factor this market.
              • in Italy is the driving factor this market.
              • buyers of fully electric or hybrid vehicles enjoy an exemption from the annual registration tax for five years after they have purchased the vehicle. After this five-year period is the driving factor this market.
              • they would benefit from a 75% reduction in the equivalent tax rate charged on most petrol vehicles. Such tax incentives are pushing up the demand for EVs is the driving factor this market.
              • which is the driving factor this market.
              • in turn is the driving factor this market.
              • will drive the growth of the global high power charger for EVs market during the forecast period. is the driving factor this market.

              The High Power Charger For Electric Vehicle (Ev) market vendors should focus on grabbing business opportunities from the 50 kW-less than 150 kW segment as it accounted for the largest market share in the base year.