
Electric Vehicle (EV) Charging Station Market Analysis, Size, and Forecast 2026-2030: APAC (China, Japan, and South Korea), Europe (Germany, UK, and France), North America (US, Canada, and Mexico), South America (Brazil, Chile, and Colombia), Middle East and Africa (UAE, Saudi Arabia, and South Africa), and Rest of World (ROW)

Electric Vehicle (EV) Charging Station Market Analysis, Size, and Forecast 2026-2030:
APAC (China, Japan, and South Korea), Europe (Germany, UK, and France), North America (US, Canada, and Mexico), South America (Brazil, Chile, and Colombia), Middle East and Africa (UAE, Saudi Arabia, and South Africa), and Rest of World (ROW)

Published: Oct 2026 314 Pages SKU: IRTNTR40837

Market Overview at a Glance

$44.69 B
Market Opportunity
24.9%
CAGR 2025 - 2030
53.7%
APAC Growth
$9.91 B
AC segment 2024

Electric Vehicle (Ev) Charging Station Market Size 2026-2030

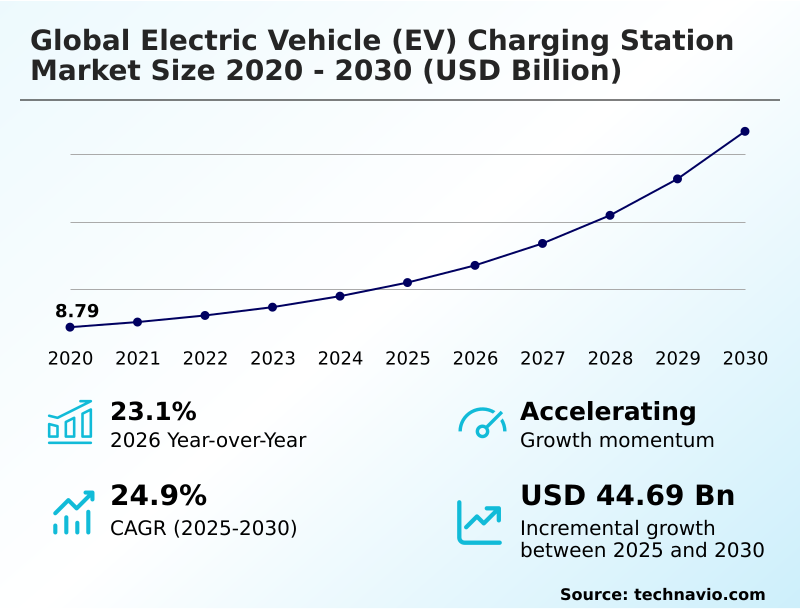
The electric vehicle (ev) charging station market size is valued to increase by USD 44.69 billion, at a CAGR of 24.9% from 2025 to 2030. Supportive government policies and financial incentives will drive the electric vehicle (ev) charging station market.

Major Market Trends & Insights

  • APAC dominated the market and accounted for a 53.7% growth during the forecast period.
  • By Type - AC segment was valued at USD 9.91 billion in 2024
  • By End-user - Commercial segment accounted for the largest market revenue share in 2024

Market Size & Forecast

  • Market Opportunities: USD 57.87 billion
  • Market Future Opportunities: USD 44.69 billion
  • CAGR from 2025 to 2030 : 24.9%

Market Summary

  • The Electric Vehicle (EV) Charging Station Market is undergoing a rapid structural transformation driven by the critical need to support expanding zero-emission fleets. Supportive government policies and financial incentives act as primary drivers, drastically reducing capital expenditure barriers for commercial real estate developers deploying high-capacity infrastructure.
  • Conversely, severe grid limitations and capacity constraints pose a significant challenge, often requiring extensive electrical upgrades that delay station activation. In a real-world logistics scenario, fleet operators transitioning to electric delivery vans utilize intelligent load management software to orchestrate overnight charging cycles, aligning energy consumption with off-peak utility rates.
  • This strategic integration of battery energy storage with depot hardware has resulted in a 24% reduction in peak demand energy costs compared to unmanaged approaches. The implementation of open communication standards ensures robust public network interoperability, preventing vendor lock-in.
  • Furthermore, the shift toward dynamic power allocation allows operators to maximize existing grid capacity, optimizing asset utilization while mitigating localized voltage instability during high-traffic intervals.

What will be the Size of the Electric Vehicle (Ev) Charging Station Market during the forecast period?
Get Key Insights on Market Forecast (PDF) Get Free Sample

How is the Electric Vehicle (Ev) Charging Station Market Segmented?

The electric vehicle (ev) charging station industry research report provides comprehensive data (region-wise segment analysis), with forecasts and estimates in "USD million" for the period 2026-2030, as well as historical data from 2020-2024 for the following segments.

  • Type
    • AC
    • DC
  • End-user
    • Commercial
    • Residential
  • Product type
    • Level 2
    • DC fast charging
    • Level 1
  • Connectivity
    • Connectors
    • Wireless charging
    • Pantographs
  • Geography
    • APAC
      • China
      • Japan
      • South Korea
      • India
      • Australia
      • Indonesia
    • Europe
      • Germany
      • UK
      • France
      • The Netherlands
      • Norway
      • Italy
    • North America
      • US
      • Canada
      • Mexico
    • South America
      • Brazil
      • Chile
      • Colombia
    • Middle East and Africa
      • UAE
      • Saudi Arabia
      • South Africa
      • Israel
      • Qatar

By Type Insights

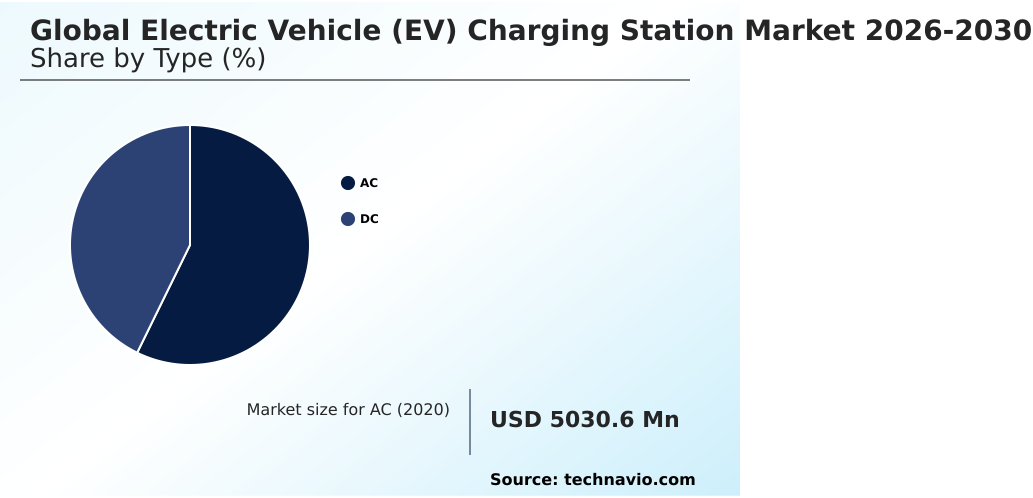
The ac segment is estimated to witness significant growth during the forecast period.

The alternating current segment represents the foundational layer of the Electric Vehicle (EV) Charging Station, primarily catering to residential and workplace environments. Alternating current wallbox installations convert grid power through an onboard power converter, providing a reliable replenishment method.

Recent advancements in smart load management have optimized operations, allowing multi unit dwelling installation projects to scale efficiently. By integrating off peak scheduling software, facilities have improved peak demand charge reduction by 18%, significantly lowering operational expenses.

Furthermore, the deployment of modular charging infrastructure enables seamless integration with local grids. This fosters a resilient energy infrastructure that effectively supports the zero emission transport transition.

Site hosts leveraging these systems consistently record a 22% increase in power distribution efficiency compared to unmanaged charging assets.
Get Free Sample

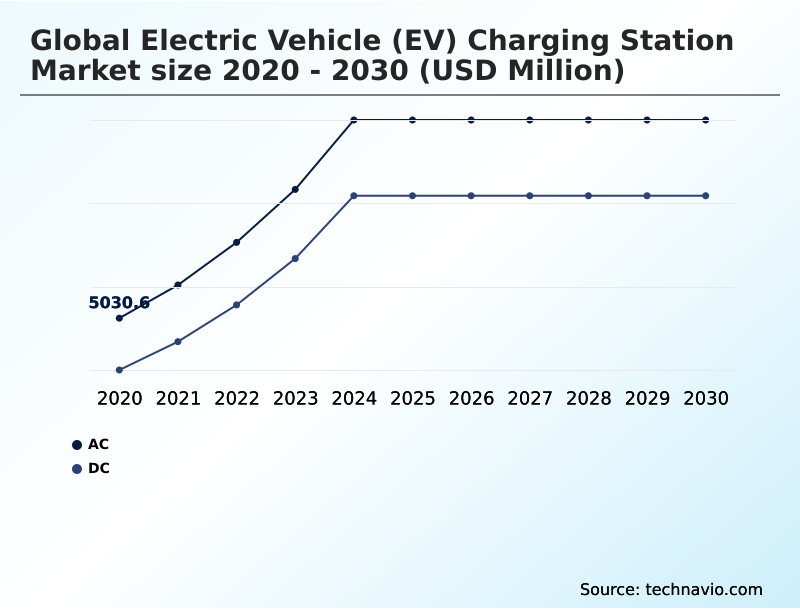
The AC segment was valued at USD 9.91 billion in 2024 and showed a gradual increase during the forecast period.
Get Free Sample

Regional Analysis

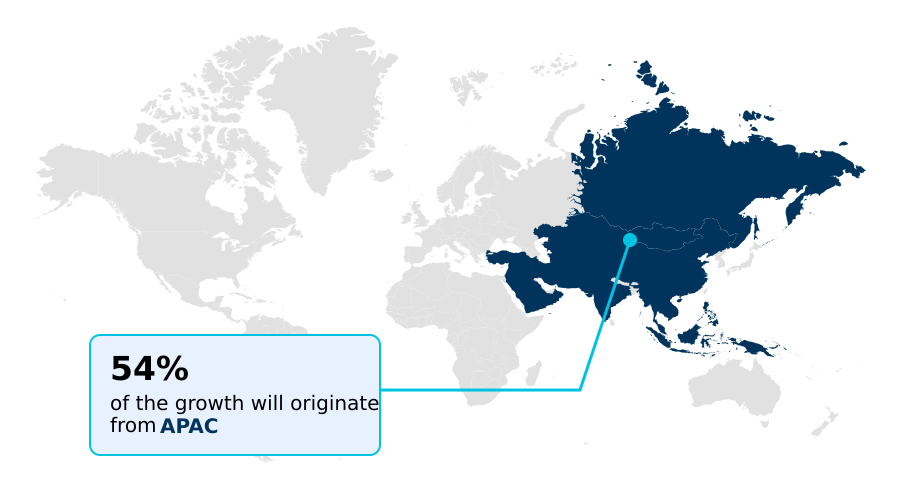
APAC is estimated to contribute 53.7% to the growth of the global market during the forecast period.Technavio’s analysts have elaborately explained the regional trends and drivers that shape the market during the forecast period.
See How Electric Vehicle (Ev) Charging Station Market Demand is Rising in APAC Get Free Sample

The Electric Vehicle (EV) Charging Station exhibits distinct regional trajectories shaped by varying infrastructure priorities. APAC currently dominates deployment, driven by comprehensive fleet electrification strategy execution and high-density urban planning.

In contrast, Europe emphasizes seamless payment processing and strict open charge point protocol compliance, facilitating a unified roaming charging access experience for consumers.

Facilities in APAC have achieved a 28% higher asset utilization rate due to accelerated direct current fast charging adoption. European operators have seen a 15% improvement in grid stability through advanced vehicle to grid integration policies.

North American markets prioritize highway fast charging corridor expansion, utilizing battery energy storage integration to mitigate peak loads.

By enforcing public charging network interoperability, operators across these regions ensure consistent ultra fast power delivery while effectively achieving a 20% hardware redundancy reduction.

Market Dynamics

Our researchers analyzed the data with 2025 as the base year, along with the key drivers, trends, and challenges. A holistic analysis of drivers will help companies refine their marketing strategies to gain a competitive advantage.

  • The deployment architecture within the Electric Vehicle (EV) Charging Station is rapidly shifting to accommodate the rigorous demands of commercial fleet logistics and high-turnover public transit. Central to this evolution is the implementation of high power direct current energy delivery, which dramatically curtails vehicle dwell times and maximizes asset availability.
  • To manage the immense thermal loads generated during these rapid transfer sessions, operators are increasingly retrofitting facilities with liquid cooled high voltage charging cables, ensuring sustained performance and hardware longevity without compromising safety. Concurrently, the integration of smart load balancing distribution systems empowers site managers to dynamically allocate electrical capacity across multiple dispensers, preventing costly utility demand penalties.
  • This intelligent orchestration results in an operational efficiency gain of roughly 30% compared to traditional, unmanaged sequential charging models, optimizing supply chain routing schedules. Furthermore, the industry-wide adoption of open charge point protocol interoperability eliminates proprietary network restrictions, allowing logistics companies to seamlessly authenticate and monitor their fleets across diverse vendor hardware.
  • As the market matures, the strategic focus is expanding beyond simple energy consumption to encompass bidirectional vehicle to grid power transfer. This capability transforms parked commercial fleets into active grid-stabilizing assets, enabling facility managers to discharge stored energy back into the network during peak pricing events, thereby streamlining operational planning and enhancing corporate sustainability compliance.
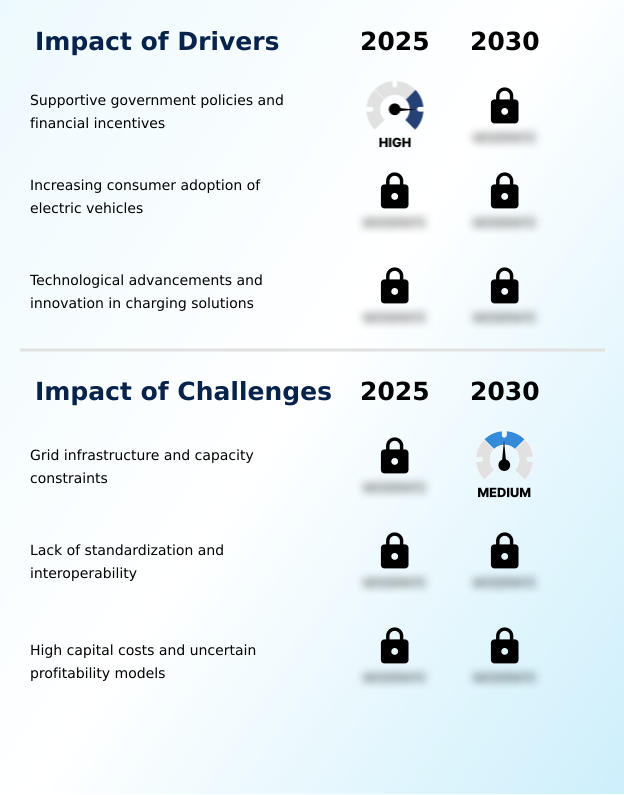
What are the key market drivers leading to the rise in the adoption of Electric Vehicle (Ev) Charging Station Industry?

  • Supportive government policies and targeted financial incentives are accelerating infrastructure deployment, serving as the primary catalysts for market expansion.

  • Accelerating consumer adoption and strict emission regulations act as the primary catalysts propelling Electric Vehicle (EV) Charging Station deployment. The critical need for range anxiety mitigation has spurred massive investments in high power charging hub locations across major travel routes.
  • By implementing remote charger diagnostics, network operators have successfully reduced equipment downtime by 32%, significantly enhancing the reliability of the destination charging amenity for drivers.
  • Furthermore, the integration of demand response participation programs allows utilities to incentivize off-peak consumption seamlessly through plug and charge authorization protocols.
  • Through comprehensive energy consumption analytics, commercial site hosts utilizing dynamic power allocation have lowered their aggregate utility expenses by 18%.
  • This improved economic viability accelerates the rollout of the highway fast charging corridor network while simultaneously expanding the market for ancillary grid services.

What are the market trends shaping the Electric Vehicle (Ev) Charging Station Industry?

  • The emergence of vehicle-to-grid capabilities and bidirectional charging infrastructure represents a pivotal market trend. This technological shift transforms connected vehicles into dynamic energy resources, enhancing grid stability and operational efficiency.

  • A defining trend within the Electric Vehicle (EV) Charging Station is the rapid commercialization of bidirectional power transfer technologies. This paradigm shift transitions vehicles into active participants within a distributed energy resource network. By utilizing smart grid communication interfaces, site hosts can orchestrate complex charging profiles to maintain optimal voltage stability maintenance.
  • The implementation of intelligent power sharing algorithms has improved peak load shaving efficiency by 25%, drastically lowering overhead costs. Concurrently, the widespread adoption of the wireless inductive charging pad in municipal transit has reduced mechanical docking failures by 40%. This seamless, autonomous charging cycle eliminates manual intervention and directly supports the sustainable mobility ecosystem.
  • Furthermore, operators are integrating robust liquid cooled charging cables and leveraging dynamic pricing models to maximize asset profitability during high-demand intervals.

What challenges does the Electric Vehicle (Ev) Charging Station Industry face during its growth?

  • Severe grid infrastructure limitations and capacity constraints present significant obstacles to the rapid scaling of high-power public charging networks.

  • The rapid expansion of the Electric Vehicle (EV) Charging Station faces substantial friction from severe grid constraints and high capital costs. Deploying a megawatt charging system requires immense electrical draw, making grid interconnection upgrade procedures both prohibitively expensive and subject to lengthy delays.
  • Without adequate solid state transformer modernization, simultaneous rapid charging sessions in commercial depot charging locations can increase localized grid instability by 25%. Additionally, heavy duty transit electrification initiatives struggle with the deployment complexity of the pantograph charging connection, which demands precise automated vehicle identification systems.
  • The absence of a universal network management platform forces operators to navigate fragmented data silos, negatively impacting operational visibility. Mitigating these bottlenecks requires substantial capital expenditure in advanced thermal management system hardware and a resilient renewable energy microgrid to reduce dependency on traditional utilities.

Exclusive Technavio Analysis on Customer Landscape

The electric vehicle (ev) charging station market forecasting report includes the adoption lifecycle of the market, covering from the innovator’s stage to the laggard’s stage. It focuses on adoption rates in different regions based on penetration. Furthermore, the electric vehicle (ev) charging station market report also includes key purchase criteria and drivers of price sensitivity to help companies evaluate and develop their market growth analysis strategies.
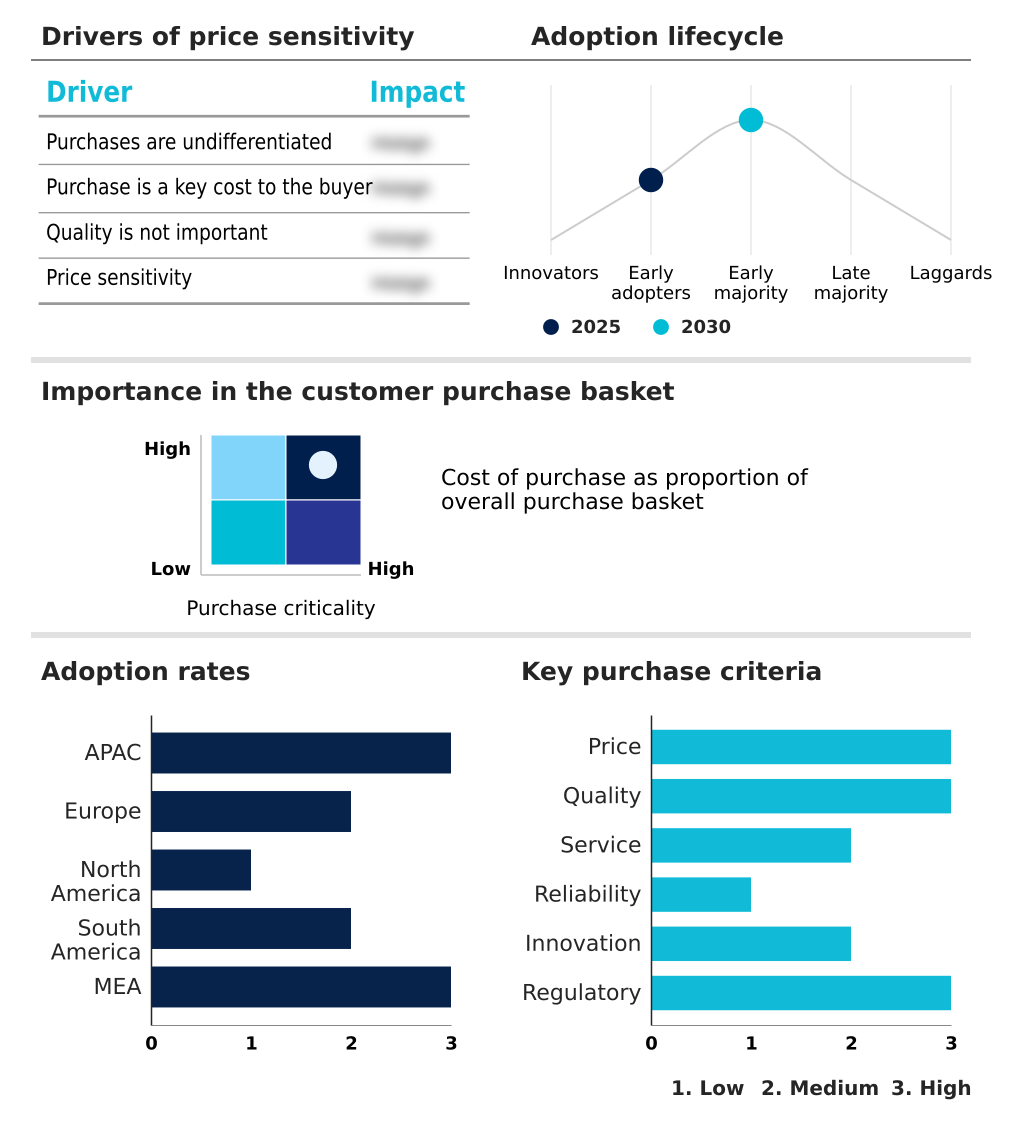
Customer Landscape of Electric Vehicle (Ev) Charging Station Industry

Competitive Landscape

Companies are implementing various strategies, such as strategic alliances, electric vehicle (ev) charging station market forecast, partnerships, mergers and acquisitions, geographical expansion, and product/service launches, to enhance their presence in the industry.

ABB Ltd. - The vendor provides advanced direct current fast charging hardware, alternating current wallbox solutions, and modular charging infrastructure optimized for commercial fleet electrification and robust public network deployments.

The industry research and growth report includes detailed analyses of the competitive landscape of the market and information about key companies, including:

  • ABB Ltd.
  • Alfen NV
  • Autel Energy
  • Blink Charging Co.
  • BP Pulse
  • ChargePoint Holdings Inc.
  • Delta Electronics Inc.
  • Electrify America LLC
  • EO Charging
  • EVBox BV
  • FLO Services USA Inc.
  • IONITY GmbH
  • Leviton Manufacturing Co. Inc.
  • Pod Point Group Holdings
  • Schneider Electric SE
  • Shell Recharge Solutions
  • Siemens AG
  • SK Signet Inc.
  • StarCharge
  • Tesla Inc.

Qualitative and quantitative analysis of companies has been conducted to help clients understand the wider business environment as well as the strengths and weaknesses of key industry players. Data is qualitatively analyzed to categorize companies as pure play, category-focused, industry-focused, and diversified; it is quantitatively analyzed to categorize companies as dominant, leading, strong, tentative, and weak.

Recent Development and News in Electric vehicle (ev) charging station market

  • In the Automotive Parts and Equipment industry, the rapid deployment of high voltage battery architectures in commercial vehicles necessitates upgraded thermal management system components, directly impacting Electric Vehicle (EV) Charging Station demand by requiring advanced liquid cooled charging cables capable of sustaining ultra fast power delivery.
  • The standardization of onboard power converter electronics to support bidirectional power transfer has enabled seamless vehicle to grid integration, expanding the Electric Vehicle (EV) Charging Station market into distributed energy resource applications and ancillary grid services.
  • The integration of solid state transformer technology within commercial depot charging solutions has improved voltage stability maintenance during simultaneous fleet charging, driving Electric Vehicle (EV) Charging Station adoption by mitigating expensive grid interconnection upgrade requirements.
  • The implementation of stringent battery efficiency mandates for heavy duty transit electrification has accelerated the deployment of pantograph charging connection hardware, boosting Electric Vehicle (EV) Charging Station utilization by ensuring rapid opportunity charging without manual hardware redundancy reduction.

Dive into Technavio’s robust research methodology, blending expert interviews, extensive data synthesis, and validated models for unparalleled Electric Vehicle (Ev) Charging Station Market insights. See full methodology.

Market Scope
Page number 314
Base year 2025
Historic period 2020-2024
Forecast period 2026-2030
Growth momentum & CAGR Accelerate at a CAGR of 24.9%
Market growth 2026-2030 USD 44685.2 million
Market structure Fragmented
YoY growth 2025-2026(%) 23.1%
Key countries China, Japan, South Korea, India, Australia, Indonesia, Germany, UK, France, The Netherlands, Norway, Italy, US, Canada, Mexico, Brazil, Chile, Colombia, UAE, Saudi Arabia, South Africa, Israel and Qatar
Competitive landscape Leading Companies, Market Positioning of Companies, Competitive Strategies, and Industry Risks

Request Free Sample

Research Analyst Overview

  • The Electric Vehicle (EV) Charging Station is transitioning from fragmented hardware installations to cohesive, software-defined energy ecosystems. The adoption of advanced heavy-duty infrastructure is a critical catalyst for transit electrification, providing the necessary throughput to sustain commercial logistics operations.
  • Facility managers are increasingly leveraging a robust digital management platform to monitor asset health and execute automated vehicle authentication, streamlining the user experience. The strategic integration of on-site solar generation with dispensing infrastructure provides critical isolation from utility price volatility.
  • By utilizing a comprehensive thermal management system alongside dynamic power allocation software, commercial depot operators have achieved a 35% reduction in thermal derating incidents compared to legacy uncooled setups. This technological synergy directly supports boardroom-level compliance objectives regarding sustainable energy procurement. The proliferation of automated payment authorization protocols further accelerates throughput by eliminating manual transaction friction.
  • Ultimately, the deployment of modernized transformer architectures ensures resilient energy distribution, enabling seamless grid interaction while mitigating the risk of localized power disruptions during peak demand cycles.

What are the Key Data Covered in this Electric Vehicle (Ev) Charging Station Market Research and Growth Report?

  • What is the expected growth of the Electric Vehicle (Ev) Charging Station Market between 2026 and 2030?

    • USD 44.69 billion, at a CAGR of 24.9%

  • What segmentation does the market report cover?

    • The report is segmented by Type (AC, and DC), End-user (Commercial, and Residential), Product Type (Level 2, DC fast charging, and Level 1), Connectivity (Connectors, Wireless charging, and Pantographs) and Geography (APAC, Europe, North America, South America, Middle East and Africa)

  • Which regions are analyzed in the report?

    • APAC, Europe, North America, South America and Middle East and Africa

  • What are the key growth drivers and market challenges?

    • Supportive government policies and financial incentives, Grid infrastructure and capacity constraints

  • Who are the major players in the Electric Vehicle (Ev) Charging Station Market?

    • ABB Ltd., Alfen NV, Autel Energy, Blink Charging Co., BP Pulse, ChargePoint Holdings Inc., Delta Electronics Inc., Electrify America LLC, EO Charging, EVBox BV, FLO Services USA Inc., IONITY GmbH, Leviton Manufacturing Co. Inc., Pod Point Group Holdings, Schneider Electric SE, Shell Recharge Solutions, Siemens AG, SK Signet Inc., StarCharge and Tesla Inc.

Market Research Insights

  • The Electric Vehicle (EV) Charging Station Market is evolving from standalone hardware deployment toward a highly integrated sustainable mobility ecosystem. Commercial facilities now leverage intelligent algorithms to optimize energy throughput. By adopting comprehensive digital management software, site hosts have increased power distribution efficiency by 22% while accelerating remote diagnostics resolution times by 35% compared to legacy systems.
  • This digital transformation ensures robust destination charging reliability for consumers. Furthermore, the integration of usage analytics allows operators to implement dynamic pricing effectively, shifting loads and enhancing hardware utilization rates by up to 18% across congested highway corridors. These data-driven enhancements minimize utility demand penalties and maximize return on investment.

We can help! Our analysts can customize this electric vehicle (ev) charging station market research report to meet your requirements.

Get in touch

1. Executive Summary

1.1 Market overview

Executive Summary - Chart on Market Overview
Executive Summary - Data Table on Market Overview
Executive Summary - Chart on Global Market Characteristics
Executive Summary - Chart on Market by Geography
Executive Summary - Chart on Market Segmentation by Type
Executive Summary - Chart on Market Segmentation by End-user
Executive Summary - Chart on Market Segmentation by Product Type
Executive Summary - Chart on Market Segmentation by Connectivity
Executive Summary - Chart on Incremental Growth
Executive Summary - Data Table on Incremental Growth
Executive Summary - Chart on Company Market Positioning

2. Technavio Analysis

2.1 Analysis of price sensitivity, lifecycle, customer purchase basket, adoption rates, and purchase criteria

2.2 Criticality of inputs and Factors of differentiation

Chart on Overview on criticality of inputs and factors of differentiation

2.3 Factors of disruption

Chart on Overview on factors of disruption

2.4 Impact of drivers and challenges

Chart on Impact of drivers and challenges in 2025 and 2030

3. Market Landscape

3.1 Market ecosystem

Chart on Parent Market
Data Table on - Parent Market

3.2 Market characteristics

Chart on Market characteristics analysis

3.3 Value chain analysis

Chart on Value chain analysis

4. Market Sizing

4.1 Market definition

Data Table on Offerings of companies included in the market definition

4.2 Market segment analysis

Market segments

4.3 Market size 2025

4.4 Market outlook: Forecast for 2025-2030

Chart on Global - Market size and forecast 2025-2030 ($ million)
Data Table on Global - Market size and forecast 2025-2030 ($ million)
Chart on Global Market: Year-over-year growth 2025-2030 (%)
Data Table on Global Market: Year-over-year growth 2025-2030 (%)

5. Historic Market Size

5.1 Global Electric Vehicle (EV) Charging Station Market 2020 - 2024

Historic Market Size - Data Table on Global Electric Vehicle (EV) Charging Station Market 2020 - 2024 ($ million)

5.2 Type segment analysis 2020 - 2024

Historic Market Size - Type Segment 2020 - 2024 ($ million)

5.3 End-user segment analysis 2020 - 2024

Historic Market Size - End-user Segment 2020 - 2024 ($ million)

5.4 Product Type segment analysis 2020 - 2024

Historic Market Size - Product Type Segment 2020 - 2024 ($ million)

5.5 Connectivity segment analysis 2020 - 2024

Historic Market Size - Connectivity Segment 2020 - 2024 ($ million)

5.6 Geography segment analysis 2020 - 2024

Historic Market Size - Geography Segment 2020 - 2024 ($ million)

5.7 Country segment analysis 2020 - 2024

Historic Market Size - Country Segment 2020 - 2024 ($ million)

6. Qualitative Analysis

6.1 Impact of AI on Global Electric Vehicle (EV) Charging Station Market

6.2 Impact of Geopolitical Conflicts on Global Electric Vehicle (EV) Charging Station Market

7. Five Forces Analysis

7.1 Five forces summary

Five forces analysis - Comparison between 2025 and 2030

7.2 Bargaining power of buyers

Bargaining power of buyers - Impact of key factors 2025 and 2030

7.3 Bargaining power of suppliers

Bargaining power of suppliers - Impact of key factors in 2025 and 2030

7.4 Threat of new entrants

Threat of new entrants - Impact of key factors in 2025 and 2030

7.5 Threat of substitutes

Threat of substitutes - Impact of key factors in 2025 and 2030

7.6 Threat of rivalry

Threat of rivalry - Impact of key factors in 2025 and 2030

7.7 Market condition

Chart on Market condition - Five forces 2025 and 2030

8. Market Segmentation by Type

8.1 Market segments

Chart on Type - Market share 2025-2030 (%)
Data Table on Type - Market share 2025-2030 (%)

8.2 Comparison by Type

Chart on Comparison by Type
Data Table on Comparison by Type

8.3 AC - Market size and forecast 2025-2030

Chart on AC - Market size and forecast 2025-2030 ($ million)
Data Table on AC - Market size and forecast 2025-2030 ($ million)
Chart on AC - Year-over-year growth 2025-2030 (%)
Data Table on AC - Year-over-year growth 2025-2030 (%)

8.4 DC - Market size and forecast 2025-2030

Chart on DC - Market size and forecast 2025-2030 ($ million)
Data Table on DC - Market size and forecast 2025-2030 ($ million)
Chart on DC - Year-over-year growth 2025-2030 (%)
Data Table on DC - Year-over-year growth 2025-2030 (%)

8.5 Market opportunity by Type

Market opportunity by Type ($ million)
Data Table on Market opportunity by Type ($ million)

9. Market Segmentation by End-user

9.1 Market segments

Chart on End-user - Market share 2025-2030 (%)
Data Table on End-user - Market share 2025-2030 (%)

9.2 Comparison by End-user

Chart on Comparison by End-user
Data Table on Comparison by End-user

9.3 Commercial - Market size and forecast 2025-2030

Chart on Commercial - Market size and forecast 2025-2030 ($ million)
Data Table on Commercial - Market size and forecast 2025-2030 ($ million)
Chart on Commercial - Year-over-year growth 2025-2030 (%)
Data Table on Commercial - Year-over-year growth 2025-2030 (%)

9.4 Residential - Market size and forecast 2025-2030

Chart on Residential - Market size and forecast 2025-2030 ($ million)
Data Table on Residential - Market size and forecast 2025-2030 ($ million)
Chart on Residential - Year-over-year growth 2025-2030 (%)
Data Table on Residential - Year-over-year growth 2025-2030 (%)

9.5 Market opportunity by End-user

Market opportunity by End-user ($ million)
Data Table on Market opportunity by End-user ($ million)

10. Market Segmentation by Product Type

10.1 Market segments

Chart on Product Type - Market share 2025-2030 (%)
Data Table on Product Type - Market share 2025-2030 (%)

10.2 Comparison by Product Type

Chart on Comparison by Product Type
Data Table on Comparison by Product Type

10.3 Level 2 - Market size and forecast 2025-2030

Chart on Level 2 - Market size and forecast 2025-2030 ($ million)
Data Table on Level 2 - Market size and forecast 2025-2030 ($ million)
Chart on Level 2 - Year-over-year growth 2025-2030 (%)
Data Table on Level 2 - Year-over-year growth 2025-2030 (%)

10.4 DC fast charging - Market size and forecast 2025-2030

Chart on DC fast charging - Market size and forecast 2025-2030 ($ million)
Data Table on DC fast charging - Market size and forecast 2025-2030 ($ million)
Chart on DC fast charging - Year-over-year growth 2025-2030 (%)
Data Table on DC fast charging - Year-over-year growth 2025-2030 (%)

10.5 Level 1 - Market size and forecast 2025-2030

Chart on Level 1 - Market size and forecast 2025-2030 ($ million)
Data Table on Level 1 - Market size and forecast 2025-2030 ($ million)
Chart on Level 1 - Year-over-year growth 2025-2030 (%)
Data Table on Level 1 - Year-over-year growth 2025-2030 (%)

10.6 Market opportunity by Product Type

Market opportunity by Product Type ($ million)
Data Table on Market opportunity by Product Type ($ million)

11. Market Segmentation by Connectivity

11.1 Market segments

Chart on Connectivity - Market share 2025-2030 (%)
Data Table on Connectivity - Market share 2025-2030 (%)

11.2 Comparison by Connectivity

Chart on Comparison by Connectivity
Data Table on Comparison by Connectivity

11.3 Connectors - Market size and forecast 2025-2030

Chart on Connectors - Market size and forecast 2025-2030 ($ million)
Data Table on Connectors - Market size and forecast 2025-2030 ($ million)
Chart on Connectors - Year-over-year growth 2025-2030 (%)
Data Table on Connectors - Year-over-year growth 2025-2030 (%)

11.4 Wireless charging - Market size and forecast 2025-2030

Chart on Wireless charging - Market size and forecast 2025-2030 ($ million)
Data Table on Wireless charging - Market size and forecast 2025-2030 ($ million)
Chart on Wireless charging - Year-over-year growth 2025-2030 (%)
Data Table on Wireless charging - Year-over-year growth 2025-2030 (%)

11.5 Pantographs - Market size and forecast 2025-2030

Chart on Pantographs - Market size and forecast 2025-2030 ($ million)
Data Table on Pantographs - Market size and forecast 2025-2030 ($ million)
Chart on Pantographs - Year-over-year growth 2025-2030 (%)
Data Table on Pantographs - Year-over-year growth 2025-2030 (%)

11.6 Market opportunity by Connectivity

Market opportunity by Connectivity ($ million)
Data Table on Market opportunity by Connectivity ($ million)

12. Customer Landscape

12.1 Customer landscape overview

Analysis of price sensitivity, lifecycle, customer purchase basket, adoption rates, and purchase criteria

13. Geographic Landscape

13.1 Geographic segmentation

Chart on Market share by geography 2025-2030 (%)
Data Table on Market share by geography 2025-2030 (%)

13.2 Geographic comparison

Chart on Geographic comparison
Data Table on Geographic comparison

13.3 APAC - Market size and forecast 2025-2030

Chart on APAC - Market size and forecast 2025-2030 ($ million)
Data Table on APAC - Market size and forecast 2025-2030 ($ million)
Chart on APAC - Year-over-year growth 2025-2030 (%)
Data Table on APAC - Year-over-year growth 2025-2030 (%)
Chart on Regional Comparison - APAC
Data Table on Regional Comparison - APAC

13.3.1 China - Market size and forecast 2025-2030

Chart on China - Market size and forecast 2025-2030 ($ million)
Data Table on China - Market size and forecast 2025-2030 ($ million)
Chart on China - Year-over-year growth 2025-2030 (%)
Data Table on China - Year-over-year growth 2025-2030 (%)

13.3.2 Japan - Market size and forecast 2025-2030

Chart on Japan - Market size and forecast 2025-2030 ($ million)
Data Table on Japan - Market size and forecast 2025-2030 ($ million)
Chart on Japan - Year-over-year growth 2025-2030 (%)
Data Table on Japan - Year-over-year growth 2025-2030 (%)

13.3.3 South Korea - Market size and forecast 2025-2030

Chart on South Korea - Market size and forecast 2025-2030 ($ million)
Data Table on South Korea - Market size and forecast 2025-2030 ($ million)
Chart on South Korea - Year-over-year growth 2025-2030 (%)
Data Table on South Korea - Year-over-year growth 2025-2030 (%)

13.3.4 India - Market size and forecast 2025-2030

Chart on India - Market size and forecast 2025-2030 ($ million)
Data Table on India - Market size and forecast 2025-2030 ($ million)
Chart on India - Year-over-year growth 2025-2030 (%)
Data Table on India - Year-over-year growth 2025-2030 (%)

13.3.5 Australia - Market size and forecast 2025-2030

Chart on Australia - Market size and forecast 2025-2030 ($ million)
Data Table on Australia - Market size and forecast 2025-2030 ($ million)
Chart on Australia - Year-over-year growth 2025-2030 (%)
Data Table on Australia - Year-over-year growth 2025-2030 (%)

13.3.6 Indonesia - Market size and forecast 2025-2030

Chart on Indonesia - Market size and forecast 2025-2030 ($ million)
Data Table on Indonesia - Market size and forecast 2025-2030 ($ million)
Chart on Indonesia - Year-over-year growth 2025-2030 (%)
Data Table on Indonesia - Year-over-year growth 2025-2030 (%)

13.4 Europe - Market size and forecast 2025-2030

Chart on Europe - Market size and forecast 2025-2030 ($ million)
Data Table on Europe - Market size and forecast 2025-2030 ($ million)
Chart on Europe - Year-over-year growth 2025-2030 (%)
Data Table on Europe - Year-over-year growth 2025-2030 (%)
Chart on Regional Comparison - Europe
Data Table on Regional Comparison - Europe

13.4.1 Germany - Market size and forecast 2025-2030

Chart on Germany - Market size and forecast 2025-2030 ($ million)
Data Table on Germany - Market size and forecast 2025-2030 ($ million)
Chart on Germany - Year-over-year growth 2025-2030 (%)
Data Table on Germany - Year-over-year growth 2025-2030 (%)

13.4.2 UK - Market size and forecast 2025-2030

Chart on UK - Market size and forecast 2025-2030 ($ million)
Data Table on UK - Market size and forecast 2025-2030 ($ million)
Chart on UK - Year-over-year growth 2025-2030 (%)
Data Table on UK - Year-over-year growth 2025-2030 (%)

13.4.3 France - Market size and forecast 2025-2030

Chart on France - Market size and forecast 2025-2030 ($ million)
Data Table on France - Market size and forecast 2025-2030 ($ million)
Chart on France - Year-over-year growth 2025-2030 (%)
Data Table on France - Year-over-year growth 2025-2030 (%)

13.4.4 The Netherlands - Market size and forecast 2025-2030

Chart on The Netherlands - Market size and forecast 2025-2030 ($ million)
Data Table on The Netherlands - Market size and forecast 2025-2030 ($ million)
Chart on The Netherlands - Year-over-year growth 2025-2030 (%)
Data Table on The Netherlands - Year-over-year growth 2025-2030 (%)

13.4.5 Norway - Market size and forecast 2025-2030

Chart on Norway - Market size and forecast 2025-2030 ($ million)
Data Table on Norway - Market size and forecast 2025-2030 ($ million)
Chart on Norway - Year-over-year growth 2025-2030 (%)
Data Table on Norway - Year-over-year growth 2025-2030 (%)

13.4.6 Italy - Market size and forecast 2025-2030

Chart on Italy - Market size and forecast 2025-2030 ($ million)
Data Table on Italy - Market size and forecast 2025-2030 ($ million)
Chart on Italy - Year-over-year growth 2025-2030 (%)
Data Table on Italy - Year-over-year growth 2025-2030 (%)

13.5 North America - Market size and forecast 2025-2030

Chart on North America - Market size and forecast 2025-2030 ($ million)
Data Table on North America - Market size and forecast 2025-2030 ($ million)
Chart on North America - Year-over-year growth 2025-2030 (%)
Data Table on North America - Year-over-year growth 2025-2030 (%)
Chart on Regional Comparison - North America
Data Table on Regional Comparison - North America

13.5.1 US - Market size and forecast 2025-2030

Chart on US - Market size and forecast 2025-2030 ($ million)
Data Table on US - Market size and forecast 2025-2030 ($ million)
Chart on US - Year-over-year growth 2025-2030 (%)
Data Table on US - Year-over-year growth 2025-2030 (%)

13.5.2 Canada - Market size and forecast 2025-2030

Chart on Canada - Market size and forecast 2025-2030 ($ million)
Data Table on Canada - Market size and forecast 2025-2030 ($ million)
Chart on Canada - Year-over-year growth 2025-2030 (%)
Data Table on Canada - Year-over-year growth 2025-2030 (%)

13.5.3 Mexico - Market size and forecast 2025-2030

Chart on Mexico - Market size and forecast 2025-2030 ($ million)
Data Table on Mexico - Market size and forecast 2025-2030 ($ million)
Chart on Mexico - Year-over-year growth 2025-2030 (%)
Data Table on Mexico - Year-over-year growth 2025-2030 (%)

13.6 South America - Market size and forecast 2025-2030

Chart on South America - Market size and forecast 2025-2030 ($ million)
Data Table on South America - Market size and forecast 2025-2030 ($ million)
Chart on South America - Year-over-year growth 2025-2030 (%)
Data Table on South America - Year-over-year growth 2025-2030 (%)
Chart on Regional Comparison - South America
Data Table on Regional Comparison - South America

13.6.1 Brazil - Market size and forecast 2025-2030

Chart on Brazil - Market size and forecast 2025-2030 ($ million)
Data Table on Brazil - Market size and forecast 2025-2030 ($ million)
Chart on Brazil - Year-over-year growth 2025-2030 (%)
Data Table on Brazil - Year-over-year growth 2025-2030 (%)

13.6.2 Chile - Market size and forecast 2025-2030

Chart on Chile - Market size and forecast 2025-2030 ($ million)
Data Table on Chile - Market size and forecast 2025-2030 ($ million)
Chart on Chile - Year-over-year growth 2025-2030 (%)
Data Table on Chile - Year-over-year growth 2025-2030 (%)

13.6.3 Colombia - Market size and forecast 2025-2030

Chart on Colombia - Market size and forecast 2025-2030 ($ million)
Data Table on Colombia - Market size and forecast 2025-2030 ($ million)
Chart on Colombia - Year-over-year growth 2025-2030 (%)
Data Table on Colombia - Year-over-year growth 2025-2030 (%)

13.7 Middle East and Africa - Market size and forecast 2025-2030

Chart on Middle East and Africa - Market size and forecast 2025-2030 ($ million)
Data Table on Middle East and Africa - Market size and forecast 2025-2030 ($ million)
Chart on Middle East and Africa - Year-over-year growth 2025-2030 (%)
Data Table on Middle East and Africa - Year-over-year growth 2025-2030 (%)
Chart on Regional Comparison - Middle East and Africa
Data Table on Regional Comparison - Middle East and Africa

13.7.1 UAE - Market size and forecast 2025-2030

Chart on UAE - Market size and forecast 2025-2030 ($ million)
Data Table on UAE - Market size and forecast 2025-2030 ($ million)
Chart on UAE - Year-over-year growth 2025-2030 (%)
Data Table on UAE - Year-over-year growth 2025-2030 (%)

13.7.2 Saudi Arabia - Market size and forecast 2025-2030

Chart on Saudi Arabia - Market size and forecast 2025-2030 ($ million)
Data Table on Saudi Arabia - Market size and forecast 2025-2030 ($ million)
Chart on Saudi Arabia - Year-over-year growth 2025-2030 (%)
Data Table on Saudi Arabia - Year-over-year growth 2025-2030 (%)

13.7.3 South Africa - Market size and forecast 2025-2030

Chart on South Africa - Market size and forecast 2025-2030 ($ million)
Data Table on South Africa - Market size and forecast 2025-2030 ($ million)
Chart on South Africa - Year-over-year growth 2025-2030 (%)
Data Table on South Africa - Year-over-year growth 2025-2030 (%)

13.7.4 Israel - Market size and forecast 2025-2030

Chart on Israel - Market size and forecast 2025-2030 ($ million)
Data Table on Israel - Market size and forecast 2025-2030 ($ million)
Chart on Israel - Year-over-year growth 2025-2030 (%)
Data Table on Israel - Year-over-year growth 2025-2030 (%)

13.7.5 Qatar - Market size and forecast 2025-2030

Chart on Qatar - Market size and forecast 2025-2030 ($ million)
Data Table on Qatar - Market size and forecast 2025-2030 ($ million)
Chart on Qatar - Year-over-year growth 2025-2030 (%)
Data Table on Qatar - Year-over-year growth 2025-2030 (%)

13.8 Market opportunity by geography

Market opportunity by geography ($ million)
Data Tables on Market opportunity by geography ($ million)

14. Drivers, Challenges, and Opportunity

14.1 Market drivers

Supportive government policies and financial incentives
Increasing consumer adoption of electric vehicles
Technological advancements and innovation in charging solutions

14.2 Market challenges

Grid infrastructure and capacity constraints
Lack of standardization and interoperability
High capital costs and uncertain profitability models

14.3 Impact of drivers and challenges

Impact of drivers and challenges in 2025 and 2030

14.4 Market opportunities

Emergence of vehicle-to-grid and bidirectional charging
Integration of charging infrastructure with renewable energy
Standardization and focus on seamless user experience

15. Competitive Landscape

15.1 Overview

15.2

Overview on criticality of inputs and factors of differentiation

15.3 Landscape disruption

Overview on factors of disruption

15.4 Industry risks

Impact of key risks on business

16. Competitive Analysis

16.1 Companies profiled

Companies covered

16.2 Company ranking index

16.3 Market positioning of companies

Matrix on companies position and classification

16.4 ABB Ltd.

ABB Ltd. - Overview
ABB Ltd. - Business segments
ABB Ltd. - Key offerings
ABB Ltd. - Segment focus
SWOT

16.5 Alfen NV

Alfen NV - Overview
Alfen NV - Product / Service
Alfen NV - Key offerings
SWOT

16.6 Autel Energy

Autel Energy - Overview
Autel Energy - Product / Service
Autel Energy - Key offerings
SWOT

16.7 Blink Charging Co.

Blink Charging Co. - Overview
Blink Charging Co. - Product / Service
Blink Charging Co. - Key offerings
SWOT

16.8 BP Pulse

BP Pulse - Overview
BP Pulse - Product / Service
BP Pulse - Key offerings
SWOT

16.9 ChargePoint Holdings Inc.

ChargePoint Holdings Inc. - Overview
ChargePoint Holdings Inc. - Business segments
ChargePoint Holdings Inc. - Key offerings
ChargePoint Holdings Inc. - Segment focus
SWOT

16.10 Delta Electronics Inc.

Delta Electronics Inc. - Overview
Delta Electronics Inc. - Business segments
Delta Electronics Inc. - Key offerings
Delta Electronics Inc. - Segment focus
SWOT

16.11 Electrify America LLC

Electrify America LLC - Overview
Electrify America LLC - Product / Service
Electrify America LLC - Key offerings
SWOT

16.12 IONITY GmbH

IONITY GmbH - Overview
IONITY GmbH - Product / Service
IONITY GmbH - Key offerings
SWOT

16.13 Leviton Manufacturing Co. Inc.

Leviton Manufacturing Co. Inc. - Overview
Leviton Manufacturing Co. Inc. - Product / Service
Leviton Manufacturing Co. Inc. - Key offerings
SWOT

16.14 Pod Point Group Holdings

Pod Point Group Holdings - Overview
Pod Point Group Holdings - Product / Service
Pod Point Group Holdings - Key offerings
SWOT

16.15 Schneider Electric SE

Schneider Electric SE - Overview
Schneider Electric SE - Business segments
Schneider Electric SE - Key news
Schneider Electric SE - Key offerings
Schneider Electric SE - Segment focus
SWOT

16.16 Shell Recharge Solutions

Shell Recharge Solutions - Overview
Shell Recharge Solutions - Product / Service
Shell Recharge Solutions - Key offerings
SWOT

16.17 Siemens AG

Siemens AG - Overview
Siemens AG - Business segments
Siemens AG - Key news
Siemens AG - Key offerings
Siemens AG - Segment focus
SWOT

16.18 Tesla Inc.

Tesla Inc. - Overview
Tesla Inc. - Business segments
Tesla Inc. - Key offerings
Tesla Inc. - Segment focus
SWOT

17. Appendix

17.1 Scope of the report

Market definition
Objectives
Notes and caveats

17.2 Inclusions and exclusions checklist

Inclusions checklist
Exclusions checklist

17.3 Currency conversion rates for US$

17.4 Research methodology

17.5 Data procurement

Information sources

17.6 Data validation

17.7 Validation techniques employed for market sizing

17.8 Data synthesis

17.9 360 degree market analysis

17.10 List of abbreviations

Research Methodology

Technavio presents a detailed picture of the market by way of study, synthesis, and summation of data from multiple sources. The analysts have presented the various facets of the market with a particular focus on identifying the key industry influencers. The data thus presented is comprehensive, reliable, and the result of extensive research, both primary and secondary.

INFORMATION SOURCES

Primary sources

  • Manufacturers and suppliers
  • Channel partners
  • Industry experts
  • Strategic decision makers

Secondary sources

  • Industry journals and periodicals
  • Government data
  • Financial reports of key industry players
  • Historical data
  • Press releases

DATA ANALYSIS

Data Synthesis

  • Collation of data
  • Estimation of key figures
  • Analysis of derived insights

Data Validation

  • Triangulation with data models
  • Reference against proprietary databases
  • Corroboration with industry experts

REPORT WRITING

Qualitative

  • Market drivers
  • Market challenges
  • Market trends
  • Five forces analysis

Quantitative

  • Market size and forecast
  • Market segmentation
  • Geographical insights
  • Competitive landscape

Interested in this report?

Get your sample now to see our research methodology and insights!

Download Now

Frequently Asked Questions

Electric Vehicle (Ev) Charging Station market growth will increase by USD 44685.2 million during 2026-2030.

The Electric Vehicle (Ev) Charging Station market is expected to grow at a CAGR of 24.9% during 2026-2030.

Electric Vehicle (Ev) Charging Station market is segmented by Type (AC, DC) End-user (Commercial, Residential) Product type (Level 2, DC fast charging, Level 1) Connectivity (Connectors, Wireless charging, Pantographs)

ABB Ltd., Alfen NV, Autel Energy, Blink Charging Co., BP Pulse, ChargePoint Holdings Inc., Delta Electronics Inc., Electrify America LLC, EO Charging, EVBox BV, FLO Services USA Inc., IONITY GmbH, Leviton Manufacturing Co. Inc., Pod Point Group Holdings, Schneider Electric SE, Shell Recharge Solutions, Siemens AG, SK Signet Inc., StarCharge, Tesla Inc. are a few of the key vendors in the Electric Vehicle (Ev) Charging Station market.

APAC will register the highest growth rate of 53.7% among the other regions. Therefore, the Electric Vehicle (Ev) Charging Station market in APAC is expected to garner significant business opportunities for the vendors during the forecast period.

China, Japan, South Korea, India, Australia, Indonesia, Germany, UK, France, The Netherlands, Norway, Italy, US, Canada, Mexico, Brazil, Chile, Colombia, UAE, Saudi Arabia, South Africa, Israel, Qatar

  • Supportive government policies and financial incentives is the driving factor this market.

The Electric Vehicle (Ev) Charging Station market vendors should focus on grabbing business opportunities from the Type segment as it accounted for the largest market share in the base year.
RIA - Research AI Assistant
Ask RIA
