High Volume Dispensing Systems Market Analysis, Size, and Forecast 2026-2030: North America (US, Canada, and Mexico), APAC (China, Japan, and India), Europe (UK, Germany, and France), Middle East and Africa (UAE, Saudi Arabia, and South Africa), South America (Brazil and Argentina), and Rest of World (ROW)

High Volume Dispensing Systems Market Analysis, Size, and Forecast 2026-2030:
North America (US, Canada, and Mexico), APAC (China, Japan, and India), Europe (UK, Germany, and France), Middle East and Africa (UAE, Saudi Arabia, and South Africa), South America (Brazil and Argentina), and Rest of World (ROW)

Published: Jan 2026 287 Pages SKU: IRTNTR73974

Market Overview at a Glance

$523.1 Mn
Market Opportunity
4.6%
CAGR 2025 - 2030
39.3%
North America Growth
$1.26 B
Hospital pharmacies segment 2024

High Volume Dispensing Systems Market Size 2026-2030

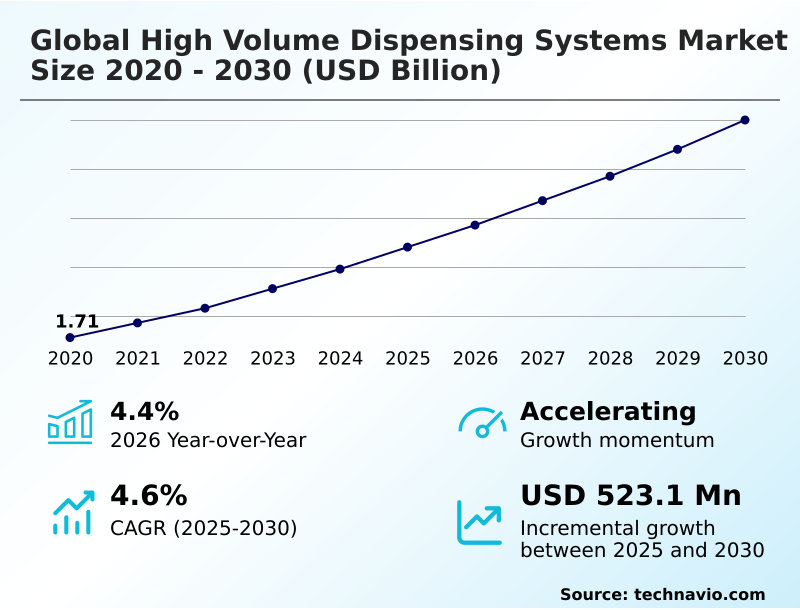
The high volume dispensing systems market size is valued to increase by USD 523.1 million, at a CAGR of 4.6% from 2025 to 2030. Growing global pharmaceutical sales will drive the high volume dispensing systems market.

Major Market Trends & Insights

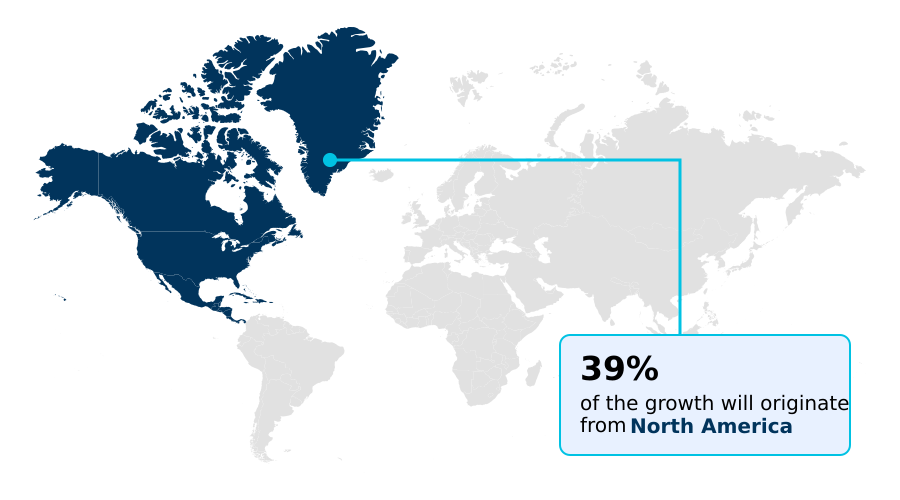
  • North America dominated the market and accounted for a 39.3% growth during the forecast period.
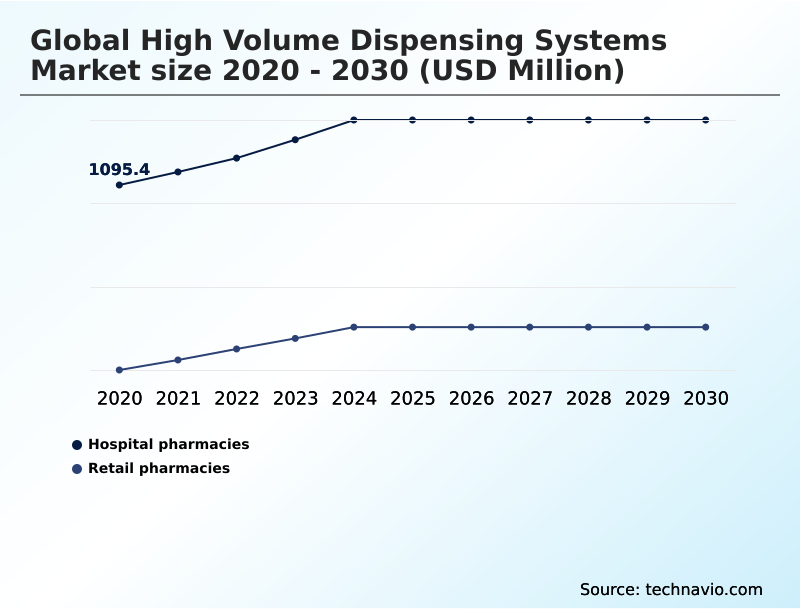
  • By End-user - Hospital pharmacies segment was valued at USD 1.26 billion in 2024
  • By Component - System and cabinets segment accounted for the largest market revenue share in 2024

Market Size & Forecast

  • Market Opportunities: USD 890.9 million
  • Market Future Opportunities: USD 523.1 million
  • CAGR from 2025 to 2030 : 4.6%

Market Summary

  • The High Volume Dispensing Systems Market is evolving in response to significant pressures within the pharmaceutical and manufacturing sectors. A primary catalyst is the persistent need for operational efficiency, compelling organizations to adopt advanced automation. In a typical scenario, a large healthcare network implements a centralized fulfillment center to service its multiple retail and hospital pharmacies.
  • This facility uses robotic prescription dispensing and automated pouch packaging to handle thousands of routine prescriptions daily, a task that would otherwise consume extensive pharmacist and technician hours. This strategic shift is driven not only by the pursuit of cost reduction but also by the critical goal of enhancing patient safety through medication error reduction.
  • Modern systems incorporate sophisticated barcode verification systems and machine vision verification to ensure accuracy. However, challenges persist, including the high initial capital investment and the complexity of achieving seamless pharmacy information systems integration with existing legacy platforms. As the industry moves forward, the focus remains on creating more intelligent and interconnected systems that can optimize the entire pharmaceutical supply chain.

What will be the Size of the High Volume Dispensing Systems Market during the forecast period?

Get Key Insights on Market Forecast (PDF) Request Free Sample

How is the High Volume Dispensing Systems Market Segmented?

The high volume dispensing systems industry research report provides comprehensive data (region-wise segment analysis), with forecasts and estimates in "USD million" for the period 2026-2030, as well as historical data from 2020-2024 for the following segments.

  • End-user
    • Hospital pharmacies
    • Retail pharmacies
  • Component
    • System and cabinets
    • Software solutions
  • Type
    • Valve dispensing
    • Jet dispensing
    • Needle dispensing
    • Screw dispensing
    • Diaphragm dispensing
  • Geography
    • North America
      • US
      • Canada
      • Mexico
    • APAC
      • China
      • Japan
      • India
    • Europe
      • UK
      • Germany
      • France
    • Middle East and Africa
      • UAE
      • Saudi Arabia
      • South Africa
    • South America
      • Brazil
      • Argentina
    • Rest of World (ROW)

By End-user Insights

The hospital pharmacies segment is estimated to witness significant growth during the forecast period.

The hospital pharmacies segment is undergoing a significant transformation, driven by the adoption of a centralized service center model to enhance prescription fulfillment efficiency.

This shift leverages high volume dispensing systems as the core of a hub-and-spoke distribution model, consolidating prescription processing for multiple facilities.

The implementation of pharmacy robotics software and automated storage and retrieval systems (ASRS) facilitates high-throughput screening and pharmacist time reallocation toward clinical duties.

By automating repetitive tasks, these systems enable a pronounced patient safety improvement, reducing medication errors by over 15%.

This strategic move toward centralized pharmacy robotics and automated quality control not only addresses labor shortage mitigation but also ensures greater consistency and accuracy in medication management, supporting lean pharmacy principles.

Request Free Sample

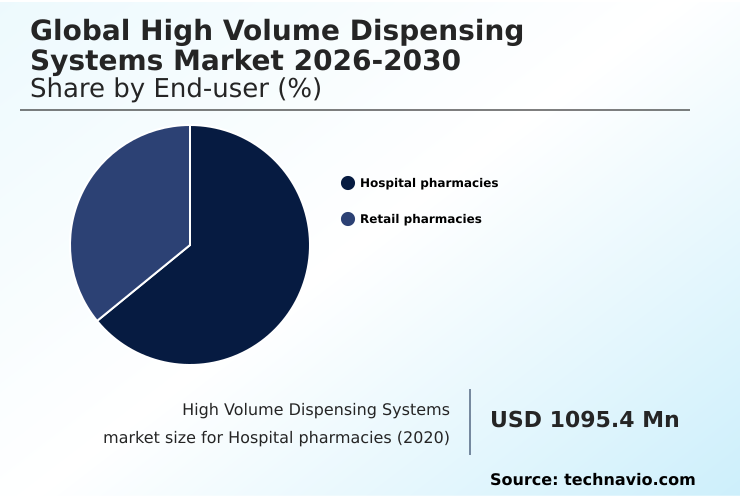
The Hospital pharmacies segment was valued at USD 1.26 billion in 2024 and showed a gradual increase during the forecast period.

Request Free Sample

Regional Analysis

North America is estimated to contribute 39.3% to the growth of the global market during the forecast period.Technavio’s analysts have elaborately explained the regional trends and drivers that shape the market during the forecast period.

See How High Volume Dispensing Systems Market Demand is Rising in North America Request Free Sample

The geographic landscape of the market is led by North America, which accounts for nearly 40% of the incremental growth, driven by its advanced healthcare infrastructure and the aggressive adoption of pharmacy supply chain automation.

The region's focus on mitigating medication errors has spurred investment in automated vial labeling and telepharmacy integration.

In contrast, the market in APAC is expanding at the fastest rate, with growth outpacing other regions by more than 0.5%, fueled by new infrastructure and rising healthcare expenditure.

The implementation of high-density storage carousels and modular dispensing systems is becoming common.

This regional dynamic, emphasizing both established leadership and rapid emergence, highlights a global trend toward leveraging robotic storage and retrieval and workflow bottleneck analysis to enhance dispensing throughput capacity and meet diverse regulatory standards.

Market Dynamics

Our researchers analyzed the data with 2025 as the base year, along with the key drivers, trends, and challenges. A holistic analysis of drivers will help companies refine their marketing strategies to gain a competitive advantage.

  • Strategic decisions in the high volume dispensing systems market are increasingly guided by detailed analyses of operational metrics and long-term value. For facilities considering high volume dispensing for specialty drugs, the focus is on precision and medication traceability to ensure compliance and patient safety.
  • The overall ROI of central fill pharmacy automation is a critical factor, with many organizations finding that the initial investment is offset by significant reductions in labor costs and waste. A key objective is reducing dispensing errors with robotics, as automated systems can achieve accuracy levels that are simply unattainable through manual processes.
  • When improving efficiency in mail-order pharmacies, the emphasis is on maximizing throughput with high-speed dispensing for unit-dose packaging. The scalability of automated dispensing systems allows organizations to grow without major disruptions. However, integration challenges with legacy EHRs remain a consideration.
  • A thorough cost-benefit analysis of pharmacy automation often reveals that automated inventory management in hospitals leads to inventory reductions of over 20%. The impact of automation on pharmacist roles is transformative, shifting focus toward clinical care.
  • Robotic solutions for blister card packaging and vial filling automation for retail chains are becoming standard for achieving a balance between speed and accuracy in dispensing.

What are the key market drivers leading to the rise in the adoption of High Volume Dispensing Systems Industry?

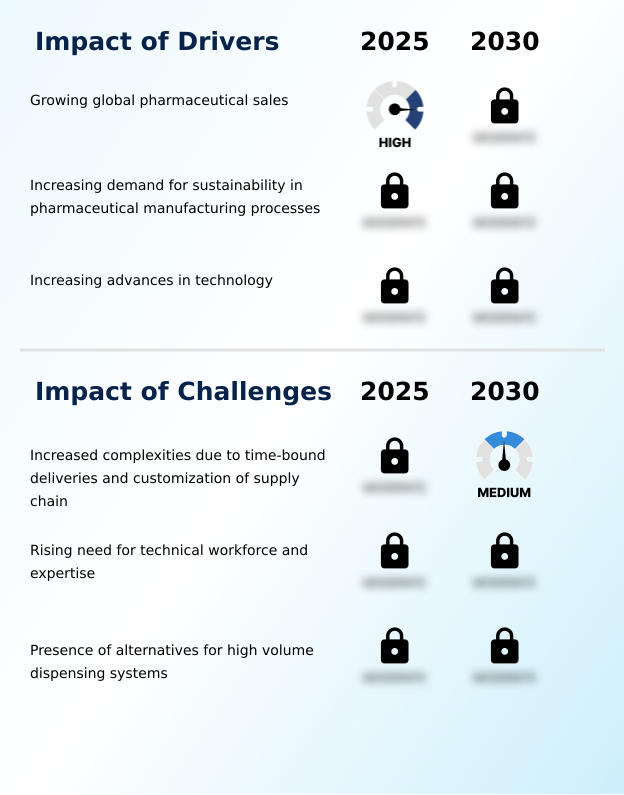
  • The key market driver is the growth in global pharmaceutical sales, which increases the demand for efficient, high-throughput dispensing solutions.

  • The market is primarily driven by the imperative to enhance operational efficiency and patient safety in the face of rising prescription volumes and a persistent shortage of skilled pharmacy personnel.
  • High volume dispensing systems directly address these pressures by automating over 80% of routine dispensing tasks, allowing for significant pharmacist time reallocation.
  • The implementation of central fill pharmacy automation enables healthcare organizations to process up to 10,000 prescriptions per shift with a single system, a scale unattainable through manual methods.
  • This drive for high-throughput screening and prescription fulfillment efficiency is crucial for mail-order pharmacy operations and large retail chains.
  • Technologies like high-speed canister counting and automated vial labeling ensure both speed and accuracy, supporting the critical goal of medication error reduction and enhancing overall pharmaceutical supply chain automation.

What are the market trends shaping the High Volume Dispensing Systems Industry?

  • The increasing application of automation within high-volume dispensing systems is an emerging market trend. This development is driven by the pressing need for enhanced operational efficiency and safety across pharmacy settings.

  • A primary trend is the integration of artificial intelligence and machine learning into pharmacy robotics software, enabling predictive analytics for inventory management and system maintenance. This shift toward smarter automation allows for dynamic pharmacy workflow optimization, with some platforms improving demand forecasting accuracy by over 20%.
  • The use of machine vision verification is also advancing, incorporating deep learning algorithms to identify potential defects in real time. This evolution supports enhanced medication adherence packaging and blister card packaging automation. Furthermore, the adoption of digital pharmacy integration is driving demand for systems that offer seamless electronic health record (EHR) integration.
  • These intelligent systems are delivering significant business outcomes, including a 15% reduction in unplanned downtime through predictive maintenance alerts, directly contributing to dispensing throughput capacity and operational continuity.

What challenges does the High Volume Dispensing Systems Industry face during its growth?

  • A key challenge affecting industry growth is the rising complexity associated with meeting time-bound delivery schedules and the need for highly customized supply chains.

  • A significant challenge confronting the market is the substantial initial capital investment required for implementation, which can be a major barrier for smaller independent pharmacies and regional health systems. The complexity of achieving seamless pharmacy information systems integration with disparate and often outdated legacy platforms presents another hurdle, with integration projects sometimes taking 30% longer than anticipated.
  • Furthermore, the successful operation of these sophisticated systems, which rely on technologies like multi-axis robotic arms and precision fluid dispensing, necessitates a specialized technical workforce for maintenance and troubleshooting.
  • This need for ongoing technical expertise, coupled with the high upfront costs of automated pouch packaging and other advanced modules, constrains broader market adoption despite the clear long-term benefits of regulatory compliance automation.

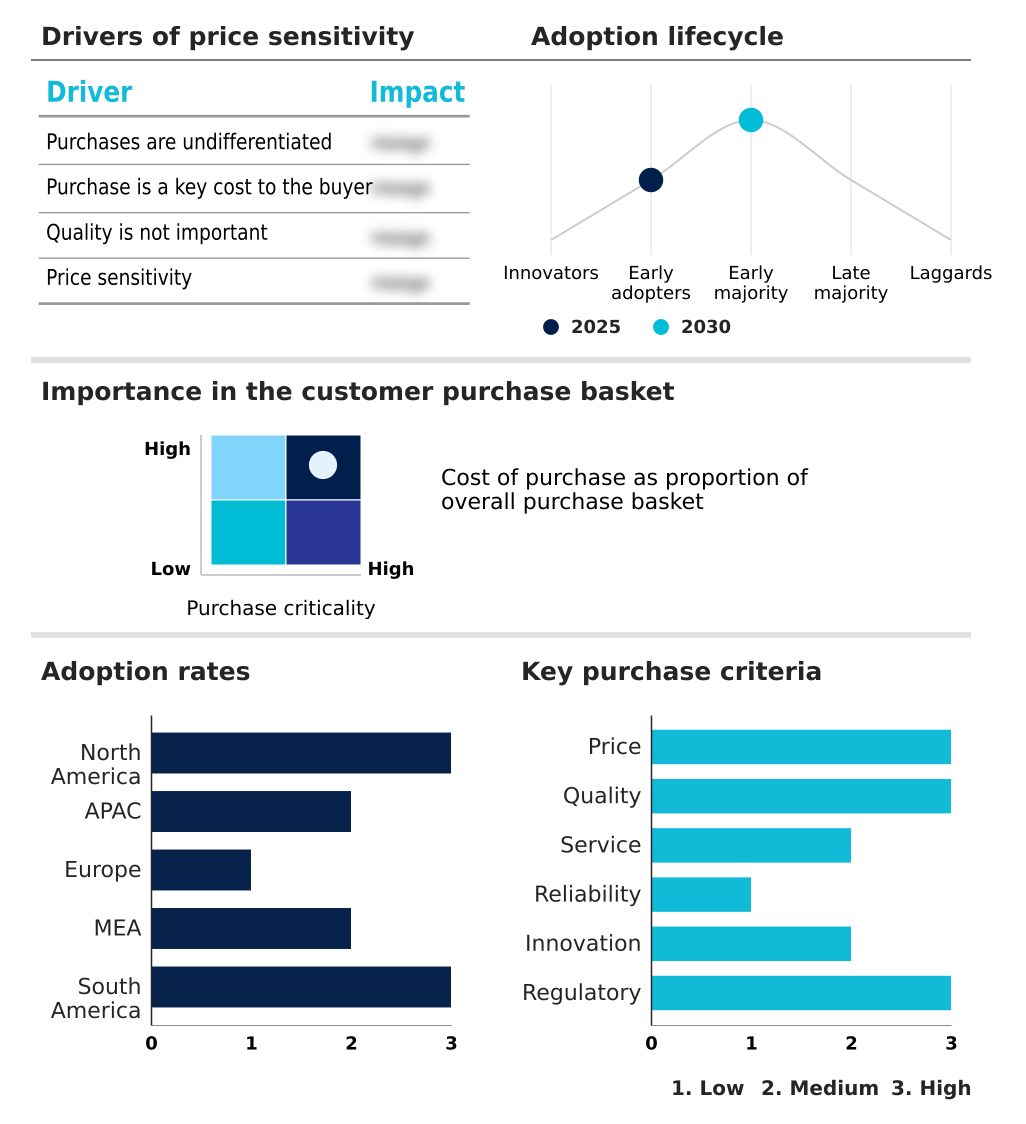
Exclusive Technavio Analysis on Customer Landscape

The high volume dispensing systems market forecasting report includes the adoption lifecycle of the market, covering from the innovator’s stage to the laggard’s stage. It focuses on adoption rates in different regions based on penetration. Furthermore, the high volume dispensing systems market report also includes key purchase criteria and drivers of price sensitivity to help companies evaluate and develop their market growth analysis strategies.

Customer Landscape of High Volume Dispensing Systems Industry

Competitive Landscape

Companies are implementing various strategies, such as strategic alliances, high volume dispensing systems market forecast, partnerships, mergers and acquisitions, geographical expansion, and product/service launches, to enhance their presence in the industry.

AptarGroup Inc. - Offers unified pharmacy automation solutions, focusing on high-volume inventory management, automated dispensing cabinets, and workflow optimization for centralized fulfillment centers.

The industry research and growth report includes detailed analyses of the competitive landscape of the market and information about key companies, including:

  • AptarGroup Inc.
  • ARxIUM Inc.
  • Atlas Copco AB
  • Becton Dickinson and Co.
  • Dymax Corp.
  • FISNAR
  • Graco Inc.
  • Henkel AG and Co. KGaA
  • McKesson Corp.
  • Musashi Seimitsu Co. Ltd.
  • Nordson Corp.
  • OK International Inc.
  • Omnicell Inc.
  • Premier Tech Ltd.
  • Richards Packaging Inc.
  • ScriptPro LLC
  • Swisslog Healthcare AG
  • Valco Cincinnati Inc.
  • ViscoTec GmbH
  • YUYAMA Co. Ltd.

Qualitative and quantitative analysis of companies has been conducted to help clients understand the wider business environment as well as the strengths and weaknesses of key industry players. Data is qualitatively analyzed to categorize companies as pure play, category-focused, industry-focused, and diversified; it is quantitatively analyzed to categorize companies as dominant, leading, strong, tentative, and weak.

Recent Development and News in High volume dispensing systems market

  • In August 2024, Nordson Corp. completed its acquisition of the ARAG Group, significantly expanding its capabilities in precision dispensing applications beyond its traditional industrial manufacturing base into agriculture.
  • In December 2024, Remedi SeniorCare was acquired by a digital health entrepreneur, with plans to revive its automated high-volume dispensing operations and enhance its service offerings for the long-term care sector.
  • In February 2025, BD (Becton, Dickinson and Co.) announced its intention to separate its Biosciences business into an independent, publicly traded company, allowing the core medical segment to increase focus on medication management solutions.
  • In April 2025, Bannermans Pharmacy in the UK invested approximately USD 70,000 in a multi-branch, AI-powered robotic dispensing system to improve high-volume prescription fulfillment and operational efficiency across Scotland.

Dive into Technavio’s robust research methodology, blending expert interviews, extensive data synthesis, and validated models for unparalleled High Volume Dispensing Systems Market insights. See full methodology.

Market Scope
Page number 287
Base year 2025
Historic period 2020-2024
Forecast period 2026-2030
Growth momentum & CAGR Accelerate at a CAGR of 4.6%
Market growth 2026-2030 USD 523.1 million
Market structure Fragmented
YoY growth 2025-2026(%) 4.4%
Key countries US, Canada, Mexico, China, Japan, India, South Korea, Australia, Indonesia, UK, Germany, France, Italy, Spain, The Netherlands, UAE, Saudi Arabia, South Africa, Egypt, Qatar, Brazil, Argentina and Chile
Competitive landscape Leading Companies, Market Positioning of Companies, Competitive Strategies, and Industry Risks

Request Free Sample

Research Analyst Overview

  • The High Volume Dispensing Systems Market is fundamentally reshaping pharmaceutical fulfillment through a convergence of sophisticated hardware and intelligent software. At its core, the market relies on robotic prescription dispensing, central fill pharmacy automation, and automated dispensing cabinets to manage the complexities of modern healthcare.
  • Technologies such as high-speed canister counting and vial filling and capping are central to the hub-and-spoke distribution model, which has become a strategic imperative for large pharmacy networks. The integration of barcode verification systems and machine vision verification provides a level of accuracy that is critical for patient safety, while automated storage and retrieval systems (ASRS) optimize facility footprints.
  • For boardroom consideration, the investment in these systems is directly tied to risk mitigation and regulatory compliance, particularly around supply chain serialization. Deploying systems with EHR integration and remote prescription verification capabilities has been shown to reduce prescription processing times by over 30%, freeing up pharmacists for higher-value clinical tasks and ensuring adherence to stringent industry standards.

What are the Key Data Covered in this High Volume Dispensing Systems Market Research and Growth Report?

  • What is the expected growth of the High Volume Dispensing Systems Market between 2026 and 2030?

    • USD 523.1 million, at a CAGR of 4.6%

  • What segmentation does the market report cover?

    • The report is segmented by End-user (Hospital pharmacies, and Retail pharmacies), Component (System and cabinets, and Software solutions), Type (Valve dispensing, Jet dispensing, Needle dispensing, Screw dispensing, and Diaphragm dispensing) and Geography (North America, APAC, Europe, Middle East and Africa, South America)

  • Which regions are analyzed in the report?

    • North America, APAC, Europe, Middle East and Africa and South America

  • What are the key growth drivers and market challenges?

    • Growing global pharmaceutical sales, Increased complexities due to time-bound deliveries and customization of supply chain

  • Who are the major players in the High Volume Dispensing Systems Market?

    • AptarGroup Inc., ARxIUM Inc., Atlas Copco AB, Becton Dickinson and Co., Dymax Corp., FISNAR, Graco Inc., Henkel AG and Co. KGaA, McKesson Corp., Musashi Seimitsu Co. Ltd., Nordson Corp., OK International Inc., Omnicell Inc., Premier Tech Ltd., Richards Packaging Inc., ScriptPro LLC, Swisslog Healthcare AG, Valco Cincinnati Inc., ViscoTec GmbH and YUYAMA Co. Ltd.

Market Research Insights

  • The market is shaped by a strategic push toward pharmacy workflow optimization, where automated systems are achieving dispensing accuracy rates exceeding 99.9% and reducing fulfillment times by over 50% compared to manual methods. This focus on prescription fulfillment efficiency is critical for mail-order pharmacy operations and facilities implementing a centralized service center model.
  • The adoption of high-volume order processing technology is directly linked to labor shortage mitigation and achieving significant operational cost reduction. By enabling pharmacist time reallocation from mechanical tasks to clinical services, these systems support expanded medication therapy management (MTM) support.
  • The integration of automated inventory management and continuous motion assembly technologies ensures scalable fulfillment solutions, driving a clear return on investment. Ultimately, this automation enhances medication traceability and patient safety improvement, addressing key regulatory and operational demands across the healthcare landscape.

We can help! Our analysts can customize this high volume dispensing systems market research report to meet your requirements.

Get in touch

1. Executive Summary

1.1 Market overview

Executive Summary - Chart on Market Overview
Executive Summary - Data Table on Market Overview
Executive Summary - Chart on Global Market Characteristics
Executive Summary - Chart on Market by Geography
Executive Summary - Chart on Market Segmentation by End-user
Executive Summary - Chart on Market Segmentation by Component
Executive Summary - Chart on Market Segmentation by Type
Executive Summary - Chart on Incremental Growth
Executive Summary - Data Table on Incremental Growth
Executive Summary - Chart on Company Market Positioning

2. Technavio Analysis

2.1 Analysis of price sensitivity, lifecycle, customer purchase basket, adoption rates, and purchase criteria

2.2 Criticality of inputs and Factors of differentiation

Chart on Overview on criticality of inputs and factors of differentiation

2.3 Factors of disruption

Chart on Overview on factors of disruption

2.4 Impact of drivers and challenges

Chart on Impact of drivers and challenges in 2025 and 2030

3. Market Landscape

3.1 Market ecosystem

Chart on Parent Market
Data Table on - Parent Market

3.2 Market characteristics

Chart on Market characteristics analysis

3.3 Value chain analysis

Chart on Value chain analysis

4. Market Sizing

4.1 Market definition

Data Table on Offerings of companies included in the market definition

4.2 Market segment analysis

Market segments

4.3 Market size 2025

4.4 Market outlook: Forecast for 2025-2030

Chart on Global - Market size and forecast 2025-2030 ($ million)
Data Table on Global - Market size and forecast 2025-2030 ($ million)
Chart on Global Market: Year-over-year growth 2025-2030 (%)
Data Table on Global Market: Year-over-year growth 2025-2030 (%)

5. Historic Market Size

5.1 Global High Volume Dispensing Systems Market 2020 - 2024

Historic Market Size - Data Table on Global High Volume Dispensing Systems Market 2020 - 2024 ($ million)

5.2 End-user segment analysis 2020 - 2024

Historic Market Size - End-user Segment 2020 - 2024 ($ million)

5.3 Component segment analysis 2020 - 2024

Historic Market Size - Component Segment 2020 - 2024 ($ million)

5.4 Type segment analysis 2020 - 2024

Historic Market Size - Type Segment 2020 - 2024 ($ million)

5.5 Geography segment analysis 2020 - 2024

Historic Market Size - Geography Segment 2020 - 2024 ($ million)

5.6 Country segment analysis 2020 - 2024

Historic Market Size - Country Segment 2020 - 2024 ($ million)

6. Qualitative Analysis

6.1 Impact of AI on global high volume dispensing systems market

7. Five Forces Analysis

7.1 Five forces summary

Five forces analysis - Comparison between 2025 and 2030

7.2 Bargaining power of buyers

Bargaining power of buyers - Impact of key factors 2025 and 2030

7.3 Bargaining power of suppliers

Bargaining power of suppliers - Impact of key factors in 2025 and 2030

7.4 Threat of new entrants

Threat of new entrants - Impact of key factors in 2025 and 2030

7.5 Threat of substitutes

Threat of substitutes - Impact of key factors in 2025 and 2030

7.6 Threat of rivalry

Threat of rivalry - Impact of key factors in 2025 and 2030

7.7 Market condition

Chart on Market condition - Five forces 2025 and 2030

8. Market Segmentation by End-user

8.1 Market segments

Chart on End-user - Market share 2025-2030 (%)
Data Table on End-user - Market share 2025-2030 (%)

8.2 Comparison by End-user

Chart on Comparison by End-user
Data Table on Comparison by End-user

8.3 Hospital pharmacies - Market size and forecast 2025-2030

Chart on Hospital pharmacies - Market size and forecast 2025-2030 ($ million)
Data Table on Hospital pharmacies - Market size and forecast 2025-2030 ($ million)
Chart on Hospital pharmacies - Year-over-year growth 2025-2030 (%)
Data Table on Hospital pharmacies - Year-over-year growth 2025-2030 (%)

8.4 Retail pharmacies - Market size and forecast 2025-2030

Chart on Retail pharmacies - Market size and forecast 2025-2030 ($ million)
Data Table on Retail pharmacies - Market size and forecast 2025-2030 ($ million)
Chart on Retail pharmacies - Year-over-year growth 2025-2030 (%)
Data Table on Retail pharmacies - Year-over-year growth 2025-2030 (%)

8.5 Market opportunity by End-user

Market opportunity by End-user ($ million)
Data Table on Market opportunity by End-user ($ million)

9. Market Segmentation by Component

9.1 Market segments

Chart on Component - Market share 2025-2030 (%)
Data Table on Component - Market share 2025-2030 (%)

9.2 Comparison by Component

Chart on Comparison by Component
Data Table on Comparison by Component

9.3 System and cabinets - Market size and forecast 2025-2030

Chart on System and cabinets - Market size and forecast 2025-2030 ($ million)
Data Table on System and cabinets - Market size and forecast 2025-2030 ($ million)
Chart on System and cabinets - Year-over-year growth 2025-2030 (%)
Data Table on System and cabinets - Year-over-year growth 2025-2030 (%)

9.4 Software solutions - Market size and forecast 2025-2030

Chart on Software solutions - Market size and forecast 2025-2030 ($ million)
Data Table on Software solutions - Market size and forecast 2025-2030 ($ million)
Chart on Software solutions - Year-over-year growth 2025-2030 (%)
Data Table on Software solutions - Year-over-year growth 2025-2030 (%)

9.5 Market opportunity by Component

Market opportunity by Component ($ million)
Data Table on Market opportunity by Component ($ million)

10. Market Segmentation by Type

10.1 Market segments

Chart on Type - Market share 2025-2030 (%)
Data Table on Type - Market share 2025-2030 (%)

10.2 Comparison by Type

Chart on Comparison by Type
Data Table on Comparison by Type

10.3 Valve dispensing - Market size and forecast 2025-2030

Chart on Valve dispensing - Market size and forecast 2025-2030 ($ million)
Data Table on Valve dispensing - Market size and forecast 2025-2030 ($ million)
Chart on Valve dispensing - Year-over-year growth 2025-2030 (%)
Data Table on Valve dispensing - Year-over-year growth 2025-2030 (%)

10.4 Jet dispensing - Market size and forecast 2025-2030

Chart on Jet dispensing - Market size and forecast 2025-2030 ($ million)
Data Table on Jet dispensing - Market size and forecast 2025-2030 ($ million)
Chart on Jet dispensing - Year-over-year growth 2025-2030 (%)
Data Table on Jet dispensing - Year-over-year growth 2025-2030 (%)

10.5 Needle dispensing - Market size and forecast 2025-2030

Chart on Needle dispensing - Market size and forecast 2025-2030 ($ million)
Data Table on Needle dispensing - Market size and forecast 2025-2030 ($ million)
Chart on Needle dispensing - Year-over-year growth 2025-2030 (%)
Data Table on Needle dispensing - Year-over-year growth 2025-2030 (%)

10.6 Screw dispensing - Market size and forecast 2025-2030

Chart on Screw dispensing - Market size and forecast 2025-2030 ($ million)
Data Table on Screw dispensing - Market size and forecast 2025-2030 ($ million)
Chart on Screw dispensing - Year-over-year growth 2025-2030 (%)
Data Table on Screw dispensing - Year-over-year growth 2025-2030 (%)

10.7 Diaphragm dispensing - Market size and forecast 2025-2030

Chart on Diaphragm dispensing - Market size and forecast 2025-2030 ($ million)
Data Table on Diaphragm dispensing - Market size and forecast 2025-2030 ($ million)
Chart on Diaphragm dispensing - Year-over-year growth 2025-2030 (%)
Data Table on Diaphragm dispensing - Year-over-year growth 2025-2030 (%)

10.8 Market opportunity by Type

Market opportunity by Type ($ million)
Data Table on Market opportunity by Type ($ million)

11. Customer Landscape

11.1 Customer landscape overview

Analysis of price sensitivity, lifecycle, customer purchase basket, adoption rates, and purchase criteria

12. Geographic Landscape

12.1 Geographic segmentation

Chart on Market share by geography 2025-2030 (%)
Data Table on Market share by geography 2025-2030 (%)

12.2 Geographic comparison

Chart on Geographic comparison
Data Table on Geographic comparison

12.3 North America - Market size and forecast 2025-2030

Chart on North America - Market size and forecast 2025-2030 ($ million)
Data Table on North America - Market size and forecast 2025-2030 ($ million)
Chart on North America - Year-over-year growth 2025-2030 (%)
Data Table on North America - Year-over-year growth 2025-2030 (%)
Chart on Regional Comparison - North America
Data Table on Regional Comparison - North America

12.3.1 US - Market size and forecast 2025-2030

Chart on US - Market size and forecast 2025-2030 ($ million)
Data Table on US - Market size and forecast 2025-2030 ($ million)
Chart on US - Year-over-year growth 2025-2030 (%)
Data Table on US - Year-over-year growth 2025-2030 (%)

12.3.2 Canada - Market size and forecast 2025-2030

Chart on Canada - Market size and forecast 2025-2030 ($ million)
Data Table on Canada - Market size and forecast 2025-2030 ($ million)
Chart on Canada - Year-over-year growth 2025-2030 (%)
Data Table on Canada - Year-over-year growth 2025-2030 (%)

12.3.3 Mexico - Market size and forecast 2025-2030

Chart on Mexico - Market size and forecast 2025-2030 ($ million)
Data Table on Mexico - Market size and forecast 2025-2030 ($ million)
Chart on Mexico - Year-over-year growth 2025-2030 (%)
Data Table on Mexico - Year-over-year growth 2025-2030 (%)

12.4 APAC - Market size and forecast 2025-2030

Chart on APAC - Market size and forecast 2025-2030 ($ million)
Data Table on APAC - Market size and forecast 2025-2030 ($ million)
Chart on APAC - Year-over-year growth 2025-2030 (%)
Data Table on APAC - Year-over-year growth 2025-2030 (%)
Chart on Regional Comparison - APAC
Data Table on Regional Comparison - APAC

12.4.1 China - Market size and forecast 2025-2030

Chart on China - Market size and forecast 2025-2030 ($ million)
Data Table on China - Market size and forecast 2025-2030 ($ million)
Chart on China - Year-over-year growth 2025-2030 (%)
Data Table on China - Year-over-year growth 2025-2030 (%)

12.4.2 Japan - Market size and forecast 2025-2030

Chart on Japan - Market size and forecast 2025-2030 ($ million)
Data Table on Japan - Market size and forecast 2025-2030 ($ million)
Chart on Japan - Year-over-year growth 2025-2030 (%)
Data Table on Japan - Year-over-year growth 2025-2030 (%)

12.4.3 India - Market size and forecast 2025-2030

Chart on India - Market size and forecast 2025-2030 ($ million)
Data Table on India - Market size and forecast 2025-2030 ($ million)
Chart on India - Year-over-year growth 2025-2030 (%)
Data Table on India - Year-over-year growth 2025-2030 (%)

12.4.4 South Korea - Market size and forecast 2025-2030

Chart on South Korea - Market size and forecast 2025-2030 ($ million)
Data Table on South Korea - Market size and forecast 2025-2030 ($ million)
Chart on South Korea - Year-over-year growth 2025-2030 (%)
Data Table on South Korea - Year-over-year growth 2025-2030 (%)

12.4.5 Australia - Market size and forecast 2025-2030

Chart on Australia - Market size and forecast 2025-2030 ($ million)
Data Table on Australia - Market size and forecast 2025-2030 ($ million)
Chart on Australia - Year-over-year growth 2025-2030 (%)
Data Table on Australia - Year-over-year growth 2025-2030 (%)

12.4.6 Indonesia - Market size and forecast 2025-2030

Chart on Indonesia - Market size and forecast 2025-2030 ($ million)
Data Table on Indonesia - Market size and forecast 2025-2030 ($ million)
Chart on Indonesia - Year-over-year growth 2025-2030 (%)
Data Table on Indonesia - Year-over-year growth 2025-2030 (%)

12.5 Europe - Market size and forecast 2025-2030

Chart on Europe - Market size and forecast 2025-2030 ($ million)
Data Table on Europe - Market size and forecast 2025-2030 ($ million)
Chart on Europe - Year-over-year growth 2025-2030 (%)
Data Table on Europe - Year-over-year growth 2025-2030 (%)
Chart on Regional Comparison - Europe
Data Table on Regional Comparison - Europe

12.5.1 UK - Market size and forecast 2025-2030

Chart on UK - Market size and forecast 2025-2030 ($ million)
Data Table on UK - Market size and forecast 2025-2030 ($ million)
Chart on UK - Year-over-year growth 2025-2030 (%)
Data Table on UK - Year-over-year growth 2025-2030 (%)

12.5.2 Germany - Market size and forecast 2025-2030

Chart on Germany - Market size and forecast 2025-2030 ($ million)
Data Table on Germany - Market size and forecast 2025-2030 ($ million)
Chart on Germany - Year-over-year growth 2025-2030 (%)
Data Table on Germany - Year-over-year growth 2025-2030 (%)

12.5.3 France - Market size and forecast 2025-2030

Chart on France - Market size and forecast 2025-2030 ($ million)
Data Table on France - Market size and forecast 2025-2030 ($ million)
Chart on France - Year-over-year growth 2025-2030 (%)
Data Table on France - Year-over-year growth 2025-2030 (%)

12.5.4 Italy - Market size and forecast 2025-2030

Chart on Italy - Market size and forecast 2025-2030 ($ million)
Data Table on Italy - Market size and forecast 2025-2030 ($ million)
Chart on Italy - Year-over-year growth 2025-2030 (%)
Data Table on Italy - Year-over-year growth 2025-2030 (%)

12.5.5 Spain - Market size and forecast 2025-2030

Chart on Spain - Market size and forecast 2025-2030 ($ million)
Data Table on Spain - Market size and forecast 2025-2030 ($ million)
Chart on Spain - Year-over-year growth 2025-2030 (%)
Data Table on Spain - Year-over-year growth 2025-2030 (%)

12.5.6 The Netherlands - Market size and forecast 2025-2030

Chart on The Netherlands - Market size and forecast 2025-2030 ($ million)
Data Table on The Netherlands - Market size and forecast 2025-2030 ($ million)
Chart on The Netherlands - Year-over-year growth 2025-2030 (%)
Data Table on The Netherlands - Year-over-year growth 2025-2030 (%)

12.6 Middle East and Africa - Market size and forecast 2025-2030

Chart on Middle East and Africa - Market size and forecast 2025-2030 ($ million)
Data Table on Middle East and Africa - Market size and forecast 2025-2030 ($ million)
Chart on Middle East and Africa - Year-over-year growth 2025-2030 (%)
Data Table on Middle East and Africa - Year-over-year growth 2025-2030 (%)
Chart on Regional Comparison - Middle East and Africa
Data Table on Regional Comparison - Middle East and Africa

12.6.1 UAE - Market size and forecast 2025-2030

Chart on UAE - Market size and forecast 2025-2030 ($ million)
Data Table on UAE - Market size and forecast 2025-2030 ($ million)
Chart on UAE - Year-over-year growth 2025-2030 (%)
Data Table on UAE - Year-over-year growth 2025-2030 (%)

12.6.2 Saudi Arabia - Market size and forecast 2025-2030

Chart on Saudi Arabia - Market size and forecast 2025-2030 ($ million)
Data Table on Saudi Arabia - Market size and forecast 2025-2030 ($ million)
Chart on Saudi Arabia - Year-over-year growth 2025-2030 (%)
Data Table on Saudi Arabia - Year-over-year growth 2025-2030 (%)

12.6.3 South Africa - Market size and forecast 2025-2030

Chart on South Africa - Market size and forecast 2025-2030 ($ million)
Data Table on South Africa - Market size and forecast 2025-2030 ($ million)
Chart on South Africa - Year-over-year growth 2025-2030 (%)
Data Table on South Africa - Year-over-year growth 2025-2030 (%)

12.6.4 Egypt - Market size and forecast 2025-2030

Chart on Egypt - Market size and forecast 2025-2030 ($ million)
Data Table on Egypt - Market size and forecast 2025-2030 ($ million)
Chart on Egypt - Year-over-year growth 2025-2030 (%)
Data Table on Egypt - Year-over-year growth 2025-2030 (%)

12.6.5 Qatar - Market size and forecast 2025-2030

Chart on Qatar - Market size and forecast 2025-2030 ($ million)
Data Table on Qatar - Market size and forecast 2025-2030 ($ million)
Chart on Qatar - Year-over-year growth 2025-2030 (%)
Data Table on Qatar - Year-over-year growth 2025-2030 (%)

12.7 South America - Market size and forecast 2025-2030

Chart on South America - Market size and forecast 2025-2030 ($ million)
Data Table on South America - Market size and forecast 2025-2030 ($ million)
Chart on South America - Year-over-year growth 2025-2030 (%)
Data Table on South America - Year-over-year growth 2025-2030 (%)
Chart on Regional Comparison - South America
Data Table on Regional Comparison - South America

12.7.1 Brazil - Market size and forecast 2025-2030

Chart on Brazil - Market size and forecast 2025-2030 ($ million)
Data Table on Brazil - Market size and forecast 2025-2030 ($ million)
Chart on Brazil - Year-over-year growth 2025-2030 (%)
Data Table on Brazil - Year-over-year growth 2025-2030 (%)

12.7.2 Argentina - Market size and forecast 2025-2030

Chart on Argentina - Market size and forecast 2025-2030 ($ million)
Data Table on Argentina - Market size and forecast 2025-2030 ($ million)
Chart on Argentina - Year-over-year growth 2025-2030 (%)
Data Table on Argentina - Year-over-year growth 2025-2030 (%)

12.7.3 Chile - Market size and forecast 2025-2030

Chart on Chile - Market size and forecast 2025-2030 ($ million)
Data Table on Chile - Market size and forecast 2025-2030 ($ million)
Chart on Chile - Year-over-year growth 2025-2030 (%)
Data Table on Chile - Year-over-year growth 2025-2030 (%)

12.8 Market opportunity by geography

Market opportunity by geography ($ million)
Data Tables on Market opportunity by geography ($ million)

13. Drivers, Challenges, and Opportunity

13.1 Market drivers

Growing global pharmaceutical sales
Increasing demand for sustainability in pharmaceutical manufacturing processes
Increasing advances in technology

13.2 Market challenges

Increased complexities due to time-bound deliveries and customization of supply chain
Rising need for technical workforce and expertise
Presence of alternatives for high volume dispensing systems

13.3 Impact of drivers and challenges

Impact of drivers and challenges in 2025 and 2030

13.4 Market opportunities

Increased application of automation in high volume dispensing systems
Focus on patient safety and error reduction
Rising integration with electronic health records and cloud-based analytics

14. Competitive Landscape

14.1 Overview

14.2

Overview on criticality of inputs and factors of differentiation

14.3 Landscape disruption

Overview on factors of disruption

14.4 Industry risks

Impact of key risks on business

15. Competitive Analysis

15.1 Companies profiled

Companies covered

15.2 Company ranking index

15.3 Market positioning of companies

Matrix on companies position and classification

15.4 AptarGroup Inc.

AptarGroup Inc. - Overview
AptarGroup Inc. - Business segments
AptarGroup Inc. - Key news
AptarGroup Inc. - Key offerings
AptarGroup Inc. - Segment focus
SWOT

15.5 ARxIUM Inc.

ARxIUM Inc. - Overview
ARxIUM Inc. - Product / Service
ARxIUM Inc. - Key offerings
SWOT

15.6 Atlas Copco AB

Atlas Copco AB - Overview
Atlas Copco AB - Business segments
Atlas Copco AB - Key news
Atlas Copco AB - Key offerings
Atlas Copco AB - Segment focus
SWOT

15.7 Becton Dickinson and Co.

Becton Dickinson and Co. - Overview
Becton Dickinson and Co. - Business segments
Becton Dickinson and Co. - Key news
Becton Dickinson and Co. - Key offerings
Becton Dickinson and Co. - Segment focus
SWOT

15.8 FISNAR

FISNAR - Overview
FISNAR - Product / Service
FISNAR - Key offerings
SWOT

15.9 Graco Inc.

Graco Inc. - Overview
Graco Inc. - Product / Service
Graco Inc. - Key offerings
SWOT

15.10 McKesson Corp.

McKesson Corp. - Overview
McKesson Corp. - Business segments
McKesson Corp. - Key news
McKesson Corp. - Key offerings
McKesson Corp. - Segment focus
SWOT

15.11 Nordson Corp.

Nordson Corp. - Overview
Nordson Corp. - Business segments
Nordson Corp. - Key news
Nordson Corp. - Key offerings
Nordson Corp. - Segment focus
SWOT

15.12 Omnicell Inc.

Omnicell Inc. - Overview
Omnicell Inc. - Product / Service
Omnicell Inc. - Key offerings
SWOT

15.13 Richards Packaging Inc.

Richards Packaging Inc. - Overview
Richards Packaging Inc. - Product / Service
Richards Packaging Inc. - Key offerings
SWOT

15.14 ScriptPro LLC

ScriptPro LLC - Overview
ScriptPro LLC - Product / Service
ScriptPro LLC - Key offerings
SWOT

15.15 Swisslog Healthcare AG

Swisslog Healthcare AG - Overview
Swisslog Healthcare AG - Product / Service
Swisslog Healthcare AG - Key offerings
SWOT

15.16 Valco Cincinnati Inc.

Valco Cincinnati Inc. - Overview
Valco Cincinnati Inc. - Product / Service
Valco Cincinnati Inc. - Key offerings
SWOT

15.17 ViscoTec GmbH

ViscoTec GmbH - Overview
ViscoTec GmbH - Product / Service
ViscoTec GmbH - Key offerings
SWOT

15.18 YUYAMA Co. Ltd.

YUYAMA Co. Ltd. - Overview
YUYAMA Co. Ltd. - Product / Service
YUYAMA Co. Ltd. - Key offerings
SWOT

16. Appendix

16.1 Scope of the report

Market definition
Objectives
Notes and caveats

16.2 Inclusions and exclusions checklist

Inclusions checklist
Exclusions checklist

16.3 Currency conversion rates for US$

16.4 Research methodology

16.5 Data procurement

Information sources

16.6 Data validation

16.7 Validation techniques employed for market sizing

16.8 Data synthesis

16.9 360 degree market analysis

16.10 List of abbreviations

Research Methodology

Technavio presents a detailed picture of the market by way of study, synthesis, and summation of data from multiple sources. The analysts have presented the various facets of the market with a particular focus on identifying the key industry influencers. The data thus presented is comprehensive, reliable, and the result of extensive research, both primary and secondary.

INFORMATION SOURCES

Primary sources

  • Manufacturers and suppliers
  • Channel partners
  • Industry experts
  • Strategic decision makers

Secondary sources

  • Industry journals and periodicals
  • Government data
  • Financial reports of key industry players
  • Historical data
  • Press releases

DATA ANALYSIS

Data Synthesis

  • Collation of data
  • Estimation of key figures
  • Analysis of derived insights

Data Validation

  • Triangulation with data models
  • Reference against proprietary databases
  • Corroboration with industry experts

REPORT WRITING

Qualitative

  • Market drivers
  • Market challenges
  • Market trends
  • Five forces analysis

Quantitative

  • Market size and forecast
  • Market segmentation
  • Geographical insights
  • Competitive landscape

Interested in this report?

Get your sample now to see our research methodology and insights!

Download Now

Frequently Asked Questions

High Volume Dispensing Systems market growth will increase by USD 523.1 million during 2026-2030.

The High Volume Dispensing Systems market is expected to grow at a CAGR of 4.6% during 2026-2030.

High Volume Dispensing Systems market is segmented by End-user (Hospital pharmacies, Retail pharmacies) Component (System and cabinets, Software solutions) Type (Valve dispensing, Jet dispensing, Needle dispensing, Screw dispensing, Diaphragm dispensing)

AptarGroup Inc., ARxIUM Inc., Atlas Copco AB, Becton Dickinson and Co., Dymax Corp., FISNAR, Graco Inc., Henkel AG and Co. KGaA, McKesson Corp., Musashi Seimitsu Co. Ltd., Nordson Corp., OK International Inc., Omnicell Inc., Premier Tech Ltd., Richards Packaging Inc., ScriptPro LLC, Swisslog Healthcare AG, Valco Cincinnati Inc., ViscoTec GmbH, YUYAMA Co. Ltd. are a few of the key vendors in the High Volume Dispensing Systems market.

North America will register the highest growth rate of 39.3% among the other regions. Therefore, the High Volume Dispensing Systems market in North America is expected to garner significant business opportunities for the vendors during the forecast period.

US, Canada, Mexico, China, Japan, India, South Korea, Australia, Indonesia, UK, Germany, France, Italy, Spain, The Netherlands, UAE, Saudi Arabia, South Africa, Egypt, Qatar, Brazil, Argentina, Chile

  • Growing global pharmaceutical sales is the driving factor this market.

The High Volume Dispensing Systems market vendors should focus on grabbing business opportunities from the End-user segment as it accounted for the largest market share in the base year.