Home Theater Market Size 2025-2029
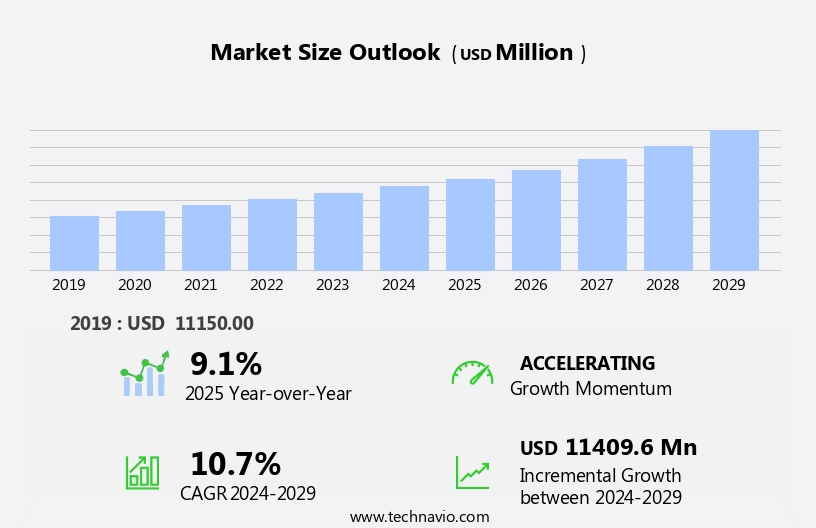
The home theater market size is forecast to increase by USD 11.41 billion at a CAGR of 10.7% between 2024 and 2029.
- The market is experiencing significant growth due to several key trends. One of the primary factors driving market expansion is the increase in disposable income, enabling consumers to invest in premium home entertainment systems. The integration of Bluetooth and Wi-Fi connectivity in home entertainment systems has enabled seamless streaming of audio and video content. Another trend is the rising demand for customized home theater systems, as consumers seek personalized experiences in their entertainment spaces. However, the high cost of home theater systems remains a challenge for some potential buyers. Despite this, the market is expected to continue its growth trajectory, offering opportunities for manufacturers and suppliers to innovate and cater to evolving consumer preferences.
What will be the Size of the Home Theater Market During the Forecast Period?

Request Free Sample
- The market encompasses a range of home entertainment-related devices, including high-definition television sets, projectors, soundbars, and home theater in a box (HTIB) systems. These technologies continue to evolve, integrating smart home capabilities, Bluetooth and Wi-Fi connectivity, and cloud services. Home theaters increasingly offer access to video streaming platforms, such as Netflix and Disney Plus, and audio content in various formats. Lamp-less technology and surround sound speakers enhance the viewing experience, while sub-woofers provide deep bass. Market growth is driven by advancements in technology, consumer demand for entertainment experiences, and the proliferation of OTT platforms. Home theaters remain a significant investment for consumers seeking to create a cinematic experience in their own homes.
How is this Home Theater Industry segmented and which is the largest segment?
The home theater industry research report provides comprehensive data (region-wise segment analysis), with forecasts and estimates in "USD billion" for the period 2025-2029, as well as historical data from 2019-2023 for the following segments.
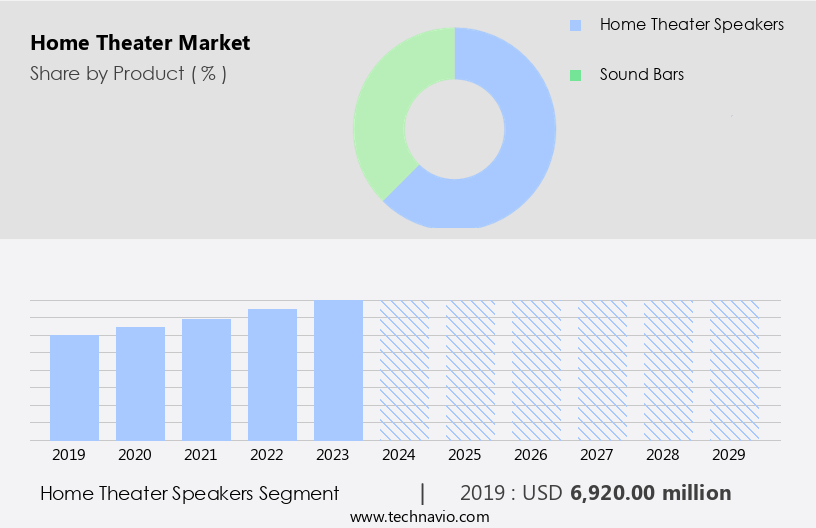
- Product
- Home theater speakers
- Sound bars
- Distribution Channel
- Connectivity
- End-user
- Geography
- APAC
- China
- India
- Japan
- South Korea
- North America
- Europe
- Middle East and Africa
- South America
By Product Insights
- The home theater speakers segment is estimated to witness significant growth during the forecast period. The market encompasses a range of devices and technologies designed to enhance the in-home entertainment experience. Smart homes, cloud services, video streaming platforms, and audio content are integral components of modern home entertainment systems. Devices such as Bluetooth and Wi-Fi connectivity-enabled soundbars, component systems, wireless subwoofers, and projector screens are popular choices. The sound bar segment is expected to dominate the market due to its affordability and ease of use. Other product types, including component systems and 3D sound systems, cater to niche audiences.
- Installation costs and the availability of counterfeit products may pose challenges for market growth. Despite these hurdles, home theater systems continue to be popular for their surround sound capabilities and theater-like experience. Companies like Bowers and Wilkins, Koninklijke Philips, LG Corporation, and JBL offer a range of high-quality audio equipment. Online retailers and specialty stores are key distribution channels, with platforms like Chromecast and streaming services such as Netflix and Disney Plus driving demand.

Get a glance at the market report of share of various segments Request Free Sample
The home theater speakers segment was valued at USD 6.92 billion in 2019 and showed a gradual increase during the forecast period.
Regional Analysis
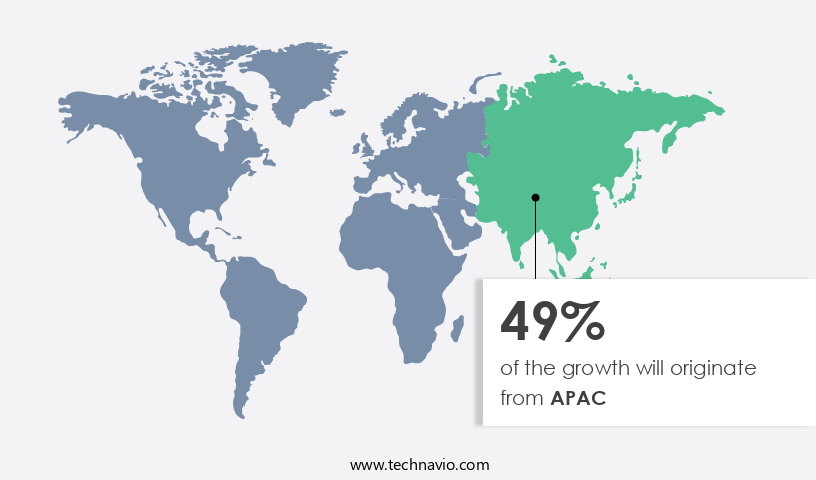
- APAC is estimated to contribute 49% to the growth of the global market during the forecast period. Technavio's analysts have elaborately explained the regional trends and drivers that shape the market during the forecast period. The market in APAC is experiencing significant growth due to the increasing disposable income of consumers. This financial growth is driving the demand for various media and entertainment devices, particularly home theater systems. Advanced audio devices, such as soundbars and wireless subwoofers, are becoming increasingly popular. China, Japan, and India are expected to be the major contributors to the market in the region. The adoption of online sales channels for purchasing consumer electronic goods is also increasing. Smart homes, equipped with Wi-Fi and Bluetooth connectivity, are becoming more prevalent, leading to the integration of cloud services, video streaming platforms, and OTT content.

For more insights on the market size of various regions, Request Free Sample
Major players in the market include LG Electronics, Harman International Industries, Seiko Epson Corporation, and others. Product types include Home Theater in a Box (HTIB) systems, soundbars, Blu-ray high-definition players, and more. The market is expected to grow due to the rising popularity of 3D sound systems and the increasing affordability of high-quality audio equipment. Installation costs and the availability of stand-alone speakers and smart TVs are also factors influencing market growth.
Market Dynamics
Our researchers analyzed the data with 2024 as the base year, along with the key drivers, trends, and challenges. A holistic analysis of drivers will help companies refine their marketing strategies to gain a competitive advantage.
What are the key market drivers leading to the rise in the adoption of the Home Theater Industry?
- Rise in disposable income is the key driver of the market. The market is experiencing growth due to the increasing disposable income of consumers. According to the Bureau of Economic Analysis, personal income rose by 0.2% in August 2024, with disposable personal income and personal outlays also increasing by the same percentage. This income growth has expanded the purchasing power of consumers, making high-end audio devices more accessible. Home entertainment-related devices, such as soundbars, Bluetooth speakers, and Wi-Fi connectivity, are popular choices for consumers seeking enhanced home theater experiences. Smart homes and cloud services have also influenced the market, with video streaming platforms like Netflix and Disney Plus offering high-definition audio content.
- Products like HTIB systems, component systems, and wireless subwoofers continue to dominate the market. Urbanization and the availability of electronic parts have facilitated the production of these devices. The sound bar segment has seen significant growth due to its affordability and ease of installation. The market dynamics are further influenced by the availability of 3D sound systems, smart TVs, and flat-screen TVs. Consumers are increasingly opting for audio equipment, such as speakers and sub-woofers, to complement their TVs. However, the market also faces challenges from counterfeit products and the rising installation costs of complex home theater systems. Internet connectivity and smart devices have transformed the market, with companies like LG Electronics, Harman International Industries, and Seiko Epson Corporation leading the way.
What are the market trends shaping the Home Theater Industry?
- Demand for customized home theater systems is an upcoming market trend. The market is experiencing growth due to the increasing popularity of home entertainment-related devices and the integration of technology in homes. Smart homes, cloud services, and video streaming platforms are driving the demand for high-quality audio content and video display. Home theater packages, including soundbars, Blu-ray high-definition players, and projector screens, are gaining traction, especially with the advancement of lamp-less technology. The sound bar segment is expected to dominate the market due to its convenience and affordability. Internet connectivity, such as Wi-Fi and Bluetooth, enables seamless integration with other smart devices and OTT platforms like Netflix and Disney Plus.
- Surround sound systems, speakers, sub-woofers, and sound bars are essential components of a home theater system. However, the high cost of home theaters and the lack of return on investment for builders limit their adoption in the middle-income segment. Specialty stores and online retailers offer various home entertainment systems, including A/V receivers, media players, and storage devices. Customized home theaters, although a niche market, are gaining popularity due to their unique offerings. Companies like LG Electronics, Harman International Industries, Seiko Epson Corporation, and others provide various home theater solutions.
- Counterfeit products pose a challenge to the market, and consumers are advised to purchase from reputable sources to ensure product quality and safety. Audio equipment, including speakers, sub-woofers, and sound bars, are essential components of a home theater system. Smart TVs and flat-screen TVs are popular video sources, and Echo and Chromecast enable wireless connectivity for easy use. Installation costs and stand-alone speakers are other factors that impact the market's growth.
What challenges does the Home Theater Industry face during its growth?
- High cost of home theater systems is a key challenge affecting the industry growth. The market encompasses a range of home entertainment-related devices, including soundbars, component systems, and Blu-ray high-definition players. Smart homes and cloud services have significantly influenced market growth, enabling consumers to access video streaming platforms like Netflix and Disney Plus via Wi-Fi or Bluetooth connectivity. Audio content is a key focus, with surround sound systems utilizing speakers and sub-woofers to deliver a good experience. The market comprises various product types, such as Home theatre packages, HTIBs, and sound bars. LG Electronics, Harman International Industries, Seiko Epson Corporation, and other leading players offer innovative solutions. The sound bar segment is gaining popularity due to its compact design and affordability.
- However, the high cost of systems and the availability of inexpensive stand-alone speaker systems pose challenges to market growth. Setting up an equipment requires a substantial investment, with estimates suggesting a budget of nearly USD 17,000-18,000 for a complete system. Consumers consider various factors, such as installation cost and the quality of equipment, when making their purchases. Internet connectivity and smart devices, like Echo and Chromecast, have transformed the experience. The integration of OTT platforms and 3D sound systems adds to the appeal. However, the risk of purchasing counterfeit products online is a concern for consumers.
Exclusive Customer Landscape
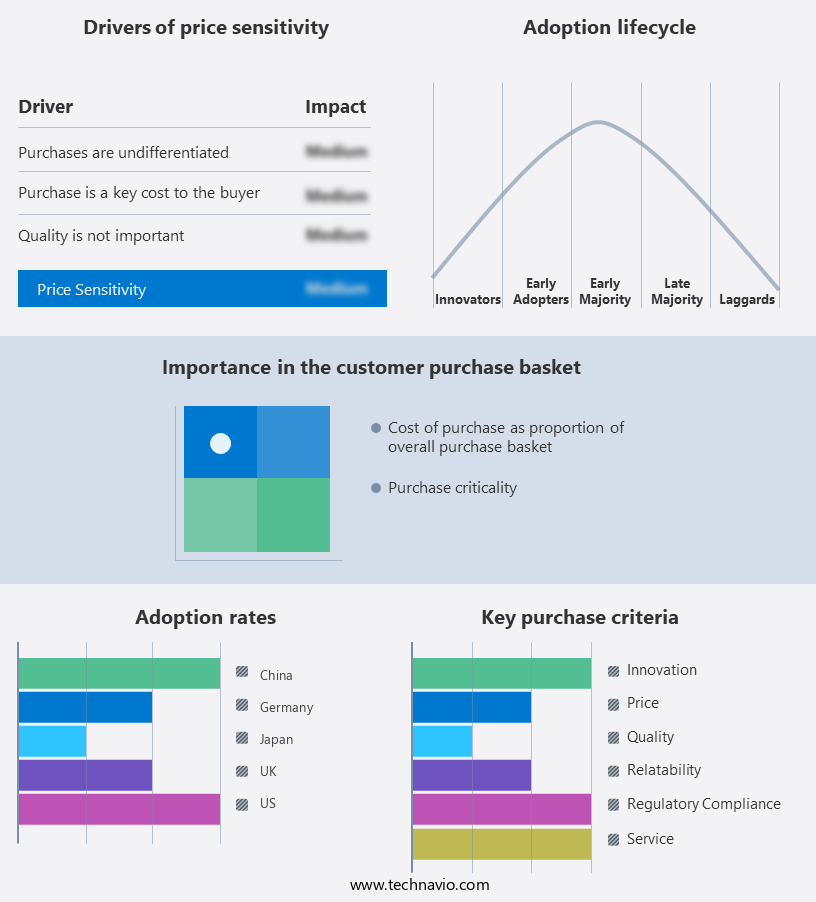
The market forecasting report includes the adoption lifecycle of the market, covering from the innovator's stage to the laggard's stage. It focuses on adoption rates in different regions based on penetration. Furthermore, the market report also includes key purchase criteria and drivers of price sensitivity to help companies evaluate and develop their market growth analysis strategies.

Customer Landscape
Key Companies & Market Insights
Companies are implementing various strategies, such as strategic alliances, home theater market forecast, partnerships, mergers and acquisitions, geographical expansion, and product/service launches, to enhance their presence in the industry.
Atlantic Technology Inc. - The company offers home theater systems along with several other products such as soundbars and speakers.
The industry research and growth report includes detailed analyses of the competitive landscape of the market and information about key companies, including:
- AudioQuest
- Bluesound International
- Bose Corp.
- Bowers and Wilkins
- Koninklijke Philips NV
- LG Corp.
- Logitech International SA
- Monitor Audio Ltd.
- NAD Electronics
- Panasonic Holdings Corp.
- Pioneer Corp.
- Samsung Electronics Co. Ltd.
- Sennheiser Electronic GmbH and Co. KG
- Sharp Corp.
- Sonos Inc.
- Sony Group Corp.
- The Rotel Co., Ltd.
- Toshiba Corp.
- Yamaha Corp.
Qualitative and quantitative analysis of companies has been conducted to help clients understand the wider business environment as well as the strengths and weaknesses of key industry players. Data is qualitatively analyzed to categorize companies as pure play, category-focused, industry-focused, and diversified; it is quantitatively analyzed to categorize companies as dominant, leading, strong, tentative, and weak.
Research Analyst Overview
The market continues to evolve, with technological advancements and consumer preferences shaping its dynamics. Home entertainment-related devices, including smart homes, cloud services, video streaming platforms, and audio content, are at the forefront of this evolution. Home Theater in a Box (HTIB) systems, soundbars, and projector screens are popular choices for consumers seeking experiences. Lamp-less technology and high-definition displays have revolutionized television sets, offering superior image quality. The adoption of smart homes and IoT devices has expanded the market for home entertainment systems.
Further, consumers can now control using voice commands or smart devices, enhancing convenience and ease of use. Urbanization and the increasing popularity have led to the growth of the market. Manufacturers are focusing on developing innovative products to cater to the evolving needs of consumers. For instance, Harman International Industries and Seiko Epson Corporation are investing in lamp-less technology for projectors, while LG Electronics and JBL are introducing wireless subwoofers. Transcosmos, Echo, and Chromecast are among the companies offering smart home integration and voice control features. The market for home entertainment systems is segmented based on product type, including HTIB systems, sound bars, component systems, and stand-alone speakers.
In addition, the sound bar segment is expected to dominate the market due to its compact design and affordability. The component system segment is expected to witness steady growth due to its superior sound quality. The market is also segmented based on distribution channels, including specialty stores and online retail. Online retail is expected to witness significant growth due to its convenience and wide product selection. OTT platforms, such as Netflix and Disney Plus, are also emerging as key players In the market, offering streaming services for movies and TV shows. The adoption of surround sound and 3D sound systems is expected to drive the growth of the market.
|
Market Scope
|
|
Report Coverage
|
Details
|
|
Page number
|
227
|
|
Base year
|
2024
|
|
Historic period
|
2019-2023 |
|
Forecast period
|
2025-2029
|
|
Growth momentum & CAGR
|
Accelerate at a CAGR of 10.7%
|
|
Market growth 2025-2029
|
USD 11.41 billion
|
|
Market structure
|
Fragmented
|
|
YoY growth 2024-2025(%)
|
9.1
|
|
Key countries
|
US, China, Japan, India, Canada, South Korea, UK, Germany, Italy, and France
|
|
Competitive landscape
|
Leading Companies, Market Positioning of Companies, Competitive Strategies, and Industry Risks
|
Request Free Sample
What are the Key Data Covered in this Home Theater Market Research and Growth Report?
- CAGR of the Home Theater industry during the forecast period
- Detailed information on factors that will drive the market growth and forecasting between 2025 and 2029
- Precise estimation of the size of the market and its contribution of the industry in focus to the parent market
- Accurate predictions about upcoming growth and trends and changes in consumer behaviour
- Growth of the market across APAC, North America, Europe, Middle East and Africa, and South America
- Thorough analysis of the market's competitive landscape and detailed information about companies
- Comprehensive analysis of factors that will challenge the home theater market growth of industry companies
We can help! Our analysts can customize this home theater market research report to meet your requirements.
Get in touch
1 Executive Summary
- 1.1 Market overview
- Executive Summary - Chart on Market Overview
- Executive Summary - Data Table on Market Overview
- Executive Summary - Chart on Global Market Characteristics
- Executive Summary - Chart on Market by Geography
- Executive Summary - Chart on Market Segmentation by Product
- Executive Summary - Chart on Market Segmentation by Distribution Channel
- Executive Summary - Chart on Market Segmentation by Connectivity
- Executive Summary - Chart on Market Segmentation by End-user
- Executive Summary - Chart on Incremental Growth
- Executive Summary - Data Table on Incremental Growth
- Executive Summary - Chart on Company Market Positioning
2 Technavio Analysis
- 2.1 Analysis of price sensitivity, lifecycle, customer purchase basket, adoption rates, and purchase criteria
- Analysis of price sensitivity, lifecycle, customer purchase basket, adoption rates, and purchase criteria
- 2.2 Criticality of inputs and Factors of differentiation
- Overview on criticality of inputs and factors of differentiation
- 2.3 Factors of disruption
- Overview on factors of disruption
- 2.4 Impact of drivers and challenges
- Impact of drivers and challenges in 2024 and 2029
3 Market Landscape
- 3.1 Market ecosystem
- Parent Market
- Data Table on - Parent Market
- 3.2 Market characteristics
- Market characteristics analysis
4 Market Sizing
- 4.1 Market definition
- Offerings of companies included in the market definition
- 4.2 Market segment analysis
- 4.4 Market outlook: Forecast for 2024-2029
- Chart on Global - Market size and forecast 2024-2029 ($ million)
- Data Table on Global - Market size and forecast 2024-2029 ($ million)
- Chart on Global Market: Year-over-year growth 2024-2029 (%)
- Data Table on Global Market: Year-over-year growth 2024-2029 (%)
5 Historic Market Size
- 5.1 Global Home Theater Market 2019 - 2023
- Historic Market Size - Data Table on Global Home Theater Market 2019 - 2023 ($ million)
- 5.2 Product segment analysis 2019 - 2023
- Historic Market Size - Product Segment 2019 - 2023 ($ million)
- 5.3 Distribution Channel segment analysis 2019 - 2023
- Historic Market Size - Distribution Channel Segment 2019 - 2023 ($ million)
- 5.4 Connectivity segment analysis 2019 - 2023
- Historic Market Size - Connectivity Segment 2019 - 2023 ($ million)
- 5.5 End-user segment analysis 2019 - 2023
- Historic Market Size - End-user Segment 2019 - 2023 ($ million)
- 5.6 Geography segment analysis 2019 - 2023
- Historic Market Size - Geography Segment 2019 - 2023 ($ million)
- 5.7 Country segment analysis 2019 - 2023
- Historic Market Size - Country Segment 2019 - 2023 ($ million)
6 Qualitative Analysis
- 6.1 Impact of AI on Global Home Theater Market
7 Five Forces Analysis
- 7.1 Five forces summary
- Five forces analysis - Comparison between 2024 and 2029
- 7.2 Bargaining power of buyers
- Bargaining power of buyers - Impact of key factors 2024 and 2029
- 7.3 Bargaining power of suppliers
- Bargaining power of suppliers - Impact of key factors in 2024 and 2029
- 7.4 Threat of new entrants
- Threat of new entrants - Impact of key factors in 2024 and 2029
- 7.5 Threat of substitutes
- Threat of substitutes - Impact of key factors in 2024 and 2029
- 7.6 Threat of rivalry
- Threat of rivalry - Impact of key factors in 2024 and 2029
- 7.7 Market condition
- Chart on Market condition - Five forces 2024 and 2029
8 Market Segmentation by Product
- 8.1 Market segments
- Chart on Product - Market share 2024-2029 (%)
- Data Table on Product - Market share 2024-2029 (%)
- 8.2 Comparison by Product
- Chart on Comparison by Product
- Data Table on Comparison by Product
- 8.3 Home theater speakers - Market size and forecast 2024-2029
- Chart on Home theater speakers - Market size and forecast 2024-2029 ($ million)
- Data Table on Home theater speakers - Market size and forecast 2024-2029 ($ million)
- Chart on Home theater speakers - Year-over-year growth 2024-2029 (%)
- Data Table on Home theater speakers - Year-over-year growth 2024-2029 (%)
- 8.4 Sound bars - Market size and forecast 2024-2029
- Chart on Sound bars - Market size and forecast 2024-2029 ($ million)
- Data Table on Sound bars - Market size and forecast 2024-2029 ($ million)
- Chart on Sound bars - Year-over-year growth 2024-2029 (%)
- Data Table on Sound bars - Year-over-year growth 2024-2029 (%)
- 8.5 Market opportunity by Product
- Market opportunity by Product ($ million)
- Data Table on Market opportunity by Product ($ million)
9 Market Segmentation by Distribution Channel
- 9.1 Market segments
- Chart on Distribution Channel - Market share 2024-2029 (%)
- Data Table on Distribution Channel - Market share 2024-2029 (%)
- 9.2 Comparison by Distribution Channel
- Chart on Comparison by Distribution Channel
- Data Table on Comparison by Distribution Channel
- 9.3 Offline - Market size and forecast 2024-2029
- Chart on Offline - Market size and forecast 2024-2029 ($ million)
- Data Table on Offline - Market size and forecast 2024-2029 ($ million)
- Chart on Offline - Year-over-year growth 2024-2029 (%)
- Data Table on Offline - Year-over-year growth 2024-2029 (%)
- 9.4 Online - Market size and forecast 2024-2029
- Chart on Online - Market size and forecast 2024-2029 ($ million)
- Data Table on Online - Market size and forecast 2024-2029 ($ million)
- Chart on Online - Year-over-year growth 2024-2029 (%)
- Data Table on Online - Year-over-year growth 2024-2029 (%)
- 9.5 Market opportunity by Distribution Channel
- Market opportunity by Distribution Channel ($ million)
- Data Table on Market opportunity by Distribution Channel ($ million)
10 Market Segmentation by Connectivity
- 10.1 Market segments
- Chart on Connectivity - Market share 2024-2029 (%)
- Data Table on Connectivity - Market share 2024-2029 (%)
- 10.2 Comparison by Connectivity
- Chart on Comparison by Connectivity
- Data Table on Comparison by Connectivity
- 10.3 Wireless - Market size and forecast 2024-2029
- Chart on Wireless - Market size and forecast 2024-2029 ($ million)
- Data Table on Wireless - Market size and forecast 2024-2029 ($ million)
- Chart on Wireless - Year-over-year growth 2024-2029 (%)
- Data Table on Wireless - Year-over-year growth 2024-2029 (%)
- 10.4 Wired - Market size and forecast 2024-2029
- Chart on Wired - Market size and forecast 2024-2029 ($ million)
- Data Table on Wired - Market size and forecast 2024-2029 ($ million)
- Chart on Wired - Year-over-year growth 2024-2029 (%)
- Data Table on Wired - Year-over-year growth 2024-2029 (%)
- 10.5 Market opportunity by Connectivity
- Market opportunity by Connectivity ($ million)
- Data Table on Market opportunity by Connectivity ($ million)
11 Market Segmentation by End-user
- 11.1 Market segments
- Chart on End-user - Market share 2024-2029 (%)
- Data Table on End-user - Market share 2024-2029 (%)
- 11.2 Comparison by End-user
- Chart on Comparison by End-user
- Data Table on Comparison by End-user
- 11.3 Residential - Market size and forecast 2024-2029
- Chart on Residential - Market size and forecast 2024-2029 ($ million)
- Data Table on Residential - Market size and forecast 2024-2029 ($ million)
- Chart on Residential - Year-over-year growth 2024-2029 (%)
- Data Table on Residential - Year-over-year growth 2024-2029 (%)
- 11.4 Commercial - Market size and forecast 2024-2029
- Chart on Commercial - Market size and forecast 2024-2029 ($ million)
- Data Table on Commercial - Market size and forecast 2024-2029 ($ million)
- Chart on Commercial - Year-over-year growth 2024-2029 (%)
- Data Table on Commercial - Year-over-year growth 2024-2029 (%)
- 11.5 Market opportunity by End-user
- Market opportunity by End-user ($ million)
- Data Table on Market opportunity by End-user ($ million)
12 Customer Landscape
- 12.1 Customer landscape overview
- Analysis of price sensitivity, lifecycle, customer purchase basket, adoption rates, and purchase criteria
13 Geographic Landscape
- 13.1 Geographic segmentation
- Chart on Market share by geography 2024-2029 (%)
- Data Table on Market share by geography 2024-2029 (%)
- 13.2 Geographic comparison
- Chart on Geographic comparison
- Data Table on Geographic comparison
- 13.3 APAC - Market size and forecast 2024-2029
- Chart on APAC - Market size and forecast 2024-2029 ($ million)
- Data Table on APAC - Market size and forecast 2024-2029 ($ million)
- Chart on APAC - Year-over-year growth 2024-2029 (%)
- Data Table on APAC - Year-over-year growth 2024-2029 (%)
- 13.4 North America - Market size and forecast 2024-2029
- Chart on North America - Market size and forecast 2024-2029 ($ million)
- Data Table on North America - Market size and forecast 2024-2029 ($ million)
- Chart on North America - Year-over-year growth 2024-2029 (%)
- Data Table on North America - Year-over-year growth 2024-2029 (%)
- 13.5 Europe - Market size and forecast 2024-2029
- Chart on Europe - Market size and forecast 2024-2029 ($ million)
- Data Table on Europe - Market size and forecast 2024-2029 ($ million)
- Chart on Europe - Year-over-year growth 2024-2029 (%)
- Data Table on Europe - Year-over-year growth 2024-2029 (%)
- 13.6 Middle East and Africa - Market size and forecast 2024-2029
- Chart on Middle East and Africa - Market size and forecast 2024-2029 ($ million)
- Data Table on Middle East and Africa - Market size and forecast 2024-2029 ($ million)
- Chart on Middle East and Africa - Year-over-year growth 2024-2029 (%)
- Data Table on Middle East and Africa - Year-over-year growth 2024-2029 (%)
- 13.7 South America - Market size and forecast 2024-2029
- Chart on South America - Market size and forecast 2024-2029 ($ million)
- Data Table on South America - Market size and forecast 2024-2029 ($ million)
- Chart on South America - Year-over-year growth 2024-2029 (%)
- Data Table on South America - Year-over-year growth 2024-2029 (%)
- 13.8 US - Market size and forecast 2024-2029
- Chart on US - Market size and forecast 2024-2029 ($ million)
- Data Table on US - Market size and forecast 2024-2029 ($ million)
- Chart on US - Year-over-year growth 2024-2029 (%)
- Data Table on US - Year-over-year growth 2024-2029 (%)
- 13.9 China - Market size and forecast 2024-2029
- Chart on China - Market size and forecast 2024-2029 ($ million)
- Data Table on China - Market size and forecast 2024-2029 ($ million)
- Chart on China - Year-over-year growth 2024-2029 (%)
- Data Table on China - Year-over-year growth 2024-2029 (%)
- 13.10 Japan - Market size and forecast 2024-2029
- Chart on Japan - Market size and forecast 2024-2029 ($ million)
- Data Table on Japan - Market size and forecast 2024-2029 ($ million)
- Chart on Japan - Year-over-year growth 2024-2029 (%)
- Data Table on Japan - Year-over-year growth 2024-2029 (%)
- 13.11 India - Market size and forecast 2024-2029
- Chart on India - Market size and forecast 2024-2029 ($ million)
- Data Table on India - Market size and forecast 2024-2029 ($ million)
- Chart on India - Year-over-year growth 2024-2029 (%)
- Data Table on India - Year-over-year growth 2024-2029 (%)
- 13.12 UK - Market size and forecast 2024-2029
- Chart on UK - Market size and forecast 2024-2029 ($ million)
- Data Table on UK - Market size and forecast 2024-2029 ($ million)
- Chart on UK - Year-over-year growth 2024-2029 (%)
- Data Table on UK - Year-over-year growth 2024-2029 (%)
- 13.13 Canada - Market size and forecast 2024-2029
- Chart on Canada - Market size and forecast 2024-2029 ($ million)
- Data Table on Canada - Market size and forecast 2024-2029 ($ million)
- Chart on Canada - Year-over-year growth 2024-2029 (%)
- Data Table on Canada - Year-over-year growth 2024-2029 (%)
- 13.14 South Korea - Market size and forecast 2024-2029
- Chart on South Korea - Market size and forecast 2024-2029 ($ million)
- Data Table on South Korea - Market size and forecast 2024-2029 ($ million)
- Chart on South Korea - Year-over-year growth 2024-2029 (%)
- Data Table on South Korea - Year-over-year growth 2024-2029 (%)
- 13.15 Germany - Market size and forecast 2024-2029
- Chart on Germany - Market size and forecast 2024-2029 ($ million)
- Data Table on Germany - Market size and forecast 2024-2029 ($ million)
- Chart on Germany - Year-over-year growth 2024-2029 (%)
- Data Table on Germany - Year-over-year growth 2024-2029 (%)
- 13.16 France - Market size and forecast 2024-2029
- Chart on France - Market size and forecast 2024-2029 ($ million)
- Data Table on France - Market size and forecast 2024-2029 ($ million)
- Chart on France - Year-over-year growth 2024-2029 (%)
- Data Table on France - Year-over-year growth 2024-2029 (%)
- 13.17 Italy - Market size and forecast 2024-2029
- Chart on Italy - Market size and forecast 2024-2029 ($ million)
- Data Table on Italy - Market size and forecast 2024-2029 ($ million)
- Chart on Italy - Year-over-year growth 2024-2029 (%)
- Data Table on Italy - Year-over-year growth 2024-2029 (%)
- 13.18 Market opportunity by geography
- Market opportunity by geography ($ million)
- Data Tables on Market opportunity by geography ($ million)
14 Drivers, Challenges, and Opportunity/Restraints
- 14.3 Impact of drivers and challenges
- Impact of drivers and challenges in 2024 and 2029
- 14.4 Market opportunities/restraints
15 Competitive Landscape
- 15.2 Competitive Landscape
- Overview on criticality of inputs and factors of differentiation
- 15.3 Landscape disruption
- Overview on factors of disruption
- 15.4 Industry risks
- Impact of key risks on business
16 Competitive Analysis
- 16.2 Company ranking index
- 16.3 Market positioning of companies
- Matrix on companies position and classification
- 16.4 Atlantic Technology Inc.
- Atlantic Technology Inc. - Overview
- Atlantic Technology Inc. - Product / Service
- Atlantic Technology Inc. - Key offerings
- SWOT
- 16.5 AudioQuest
- AudioQuest - Overview
- AudioQuest - Product / Service
- AudioQuest - Key offerings
- SWOT
- 16.6 Bose Corp.
- Bose Corp. - Overview
- Bose Corp. - Product / Service
- Bose Corp. - Key news
- Bose Corp. - Key offerings
- SWOT
- 16.7 Koninklijke Philips N.V.
- Koninklijke Philips N.V. - Overview
- Koninklijke Philips N.V. - Business segments
- Koninklijke Philips N.V. - Key news
- Koninklijke Philips N.V. - Key offerings
- Koninklijke Philips N.V. - Segment focus
- SWOT
- 16.8 LG Corp.
- LG Corp. - Overview
- LG Corp. - Business segments
- LG Corp. - Key news
- LG Corp. - Key offerings
- LG Corp. - Segment focus
- SWOT
- 16.9 Logitech International SA
- Logitech International SA - Overview
- Logitech International SA - Business segments
- Logitech International SA - Key news
- Logitech International SA - Key offerings
- Logitech International SA - Segment focus
- SWOT
- 16.10 Panasonic Holdings Corp.
- Panasonic Holdings Corp. - Overview
- Panasonic Holdings Corp. - Business segments
- Panasonic Holdings Corp. - Key news
- Panasonic Holdings Corp. - Key offerings
- Panasonic Holdings Corp. - Segment focus
- SWOT
- 16.11 Pioneer Corp.
- Pioneer Corp. - Overview
- Pioneer Corp. - Product / Service
- Pioneer Corp. - Key offerings
- SWOT
- 16.12 Samsung Electronics Co. Ltd.
- Samsung Electronics Co. Ltd. - Overview
- Samsung Electronics Co. Ltd. - Business segments
- Samsung Electronics Co. Ltd. - Key news
- Samsung Electronics Co. Ltd. - Key offerings
- Samsung Electronics Co. Ltd. - Segment focus
- SWOT
- 16.13 Sennheiser Electronic GmbH and Co. KG
- Sennheiser Electronic GmbH and Co. KG - Overview
- Sennheiser Electronic GmbH and Co. KG - Product / Service
- Sennheiser Electronic GmbH and Co. KG - Key news
- Sennheiser Electronic GmbH and Co. KG - Key offerings
- SWOT
- 16.14 Sharp Corp.
- Sharp Corp. - Overview
- Sharp Corp. - Business segments
- Sharp Corp. - Key news
- Sharp Corp. - Key offerings
- Sharp Corp. - Segment focus
- SWOT
- 16.15 Sonos Inc.
- Sonos Inc. - Overview
- Sonos Inc. - Product / Service
- Sonos Inc. - Key news
- Sonos Inc. - Key offerings
- SWOT
- 16.16 Sony Group Corp.
- Sony Group Corp. - Overview
- Sony Group Corp. - Business segments
- Sony Group Corp. - Key news
- Sony Group Corp. - Key offerings
- Sony Group Corp. - Segment focus
- SWOT
- 16.17 Toshiba Corp.
- Toshiba Corp. - Overview
- Toshiba Corp. - Business segments
- Toshiba Corp. - Key news
- Toshiba Corp. - Key offerings
- Toshiba Corp. - Segment focus
- SWOT
- 16.18 Yamaha Corp.
- Yamaha Corp. - Overview
- Yamaha Corp. - Business segments
- Yamaha Corp. - Key news
- Yamaha Corp. - Key offerings
- Yamaha Corp. - Segment focus
- SWOT
17 Appendix
- 17.2 Inclusions and exclusions checklist
- Inclusions checklist
- Exclusions checklist
- 17.3 Currency conversion rates for US$
- Currency conversion rates for US$
- 17.4 Research methodology
- 17.7 Validation techniques employed for market sizing
- Validation techniques employed for market sizing
- 17.9 360 degree market analysis
- 360 degree market analysis
- 17.10 List of abbreviations
Research Framework
Technavio presents a detailed picture of the market by way of study, synthesis, and summation of data from multiple sources. The analysts have presented the various facets of the market with a particular focus on identifying the key industry influencers. The data thus presented is comprehensive, reliable, and the result of extensive research, both primary and secondary.
INFORMATION SOURCES
Primary sources
- Manufacturers and suppliers
- Channel partners
- Industry experts
- Strategic decision makers
Secondary sources
- Industry journals and periodicals
- Government data
- Financial reports of key industry players
- Historical data
- Press releases

DATA ANALYSIS
Data Synthesis
- Collation of data
- Estimation of key figures
- Analysis of derived insights
Data Validation
- Triangulation with data models
- Reference against proprietary databases
- Corroboration with industry experts

REPORT WRITING
Qualitative
- Market drivers
- Market challenges
- Market trends
- Five forces analysis
Quantitative
- Market size and forecast
- Market segmentation
- Geographical insights
- Competitive landscape