Homeland Security Market Analysis, Size, and Forecast 2026-2030: North America (US, Canada, and Mexico), Europe (Germany, France, and UK), APAC (China, India, and Japan), Middle East and Africa (Saudi Arabia, UAE, and South Africa), South America (Brazil, Argentina, and Colombia), and Rest of World (ROW)

Homeland Security Market Analysis, Size, and Forecast 2026-2030:
North America (US, Canada, and Mexico), Europe (Germany, France, and UK), APAC (China, India, and Japan), Middle East and Africa (Saudi Arabia, UAE, and South Africa), South America (Brazil, Argentina, and Colombia), and Rest of World (ROW)

Published: Apr 2026 312 Pages SKU: IRTNTR81423

Market Overview at a Glance

$202.2 B
Market Opportunity
5.8%
CAGR 2025 - 2030
35.7%
North America Growth
$214.6 B
Cybersecurity segment 2024

Homeland Security Market Size 2026-2030

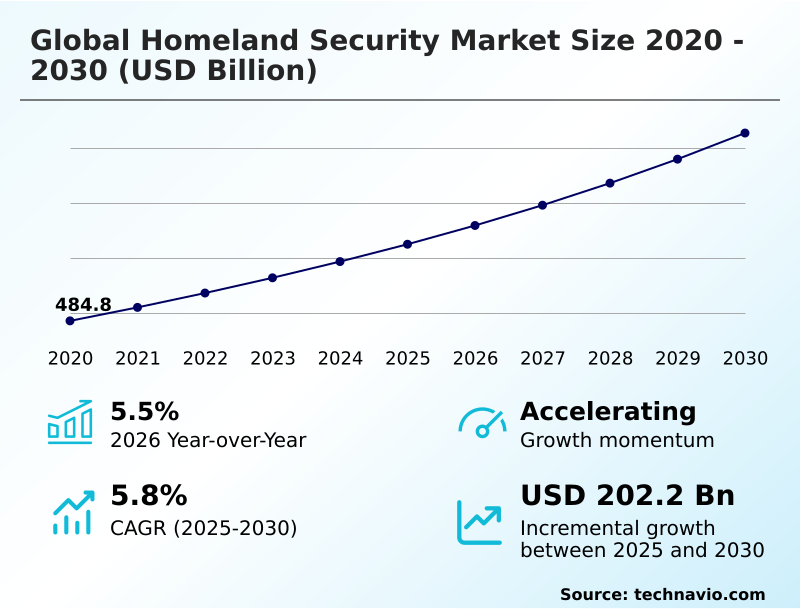
The homeland security market size is valued to increase by USD 202.2 billion, at a CAGR of 5.8% from 2025 to 2030. Escalation of cyber warfare and necessity for digital sovereignty will drive the homeland security market.

Major Market Trends & Insights

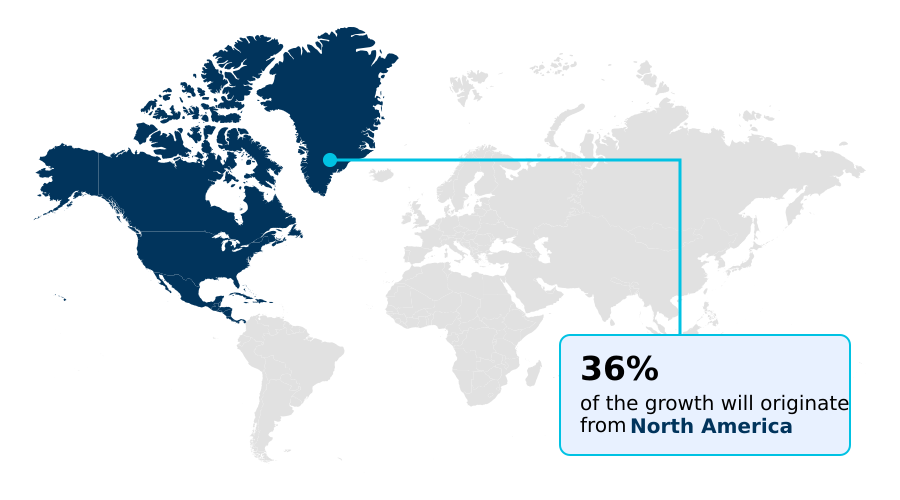
  • North America dominated the market and accounted for a 35.7% growth during the forecast period.
  • By Type - Cybersecurity segment was valued at USD 214.6 billion in 2024
  • By Component - Hardware segment accounted for the largest market revenue share in 2024

Market Size & Forecast

  • Market Opportunities: USD 341.5 billion
  • Market Future Opportunities: USD 202.2 billion
  • CAGR from 2025 to 2030 : 5.8%

Market Summary

  • The homeland security market is undergoing a significant transformation, moving beyond conventional physical defense toward integrated, intelligence-driven frameworks. This evolution is driven by the need to counter a broadening spectrum of threats, from sophisticated cyber warfare targeting critical infrastructure to asymmetric threats leveraging commercial-off-shelf technologies.
  • A key trend is the integration of AI and edge analytics for predictive threat assessment, enabling proactive rather than reactive security postures. For instance, a public-private partnership managing a national power grid utilizes a unified operational view combining data from surveillance systems and grid-stability sensors.
  • This allows for predictive modeling to identify vulnerabilities before they are exploited, reducing potential downtime by up to 40%. The market also emphasizes the modernization of border security with biometric identification and autonomous surveillance, balancing national safety with the facilitation of legitimate global commerce.
  • However, challenges related to the ethical use of facial recognition and the interoperability of legacy systems with new zero-trust architectures persist, shaping procurement strategies and demanding innovative, adaptable solutions from technology providers.

What will be the Size of the Homeland Security Market during the forecast period?

Get Key Insights on Market Forecast (PDF) Request Free Sample

How is the Homeland Security Market Segmented?

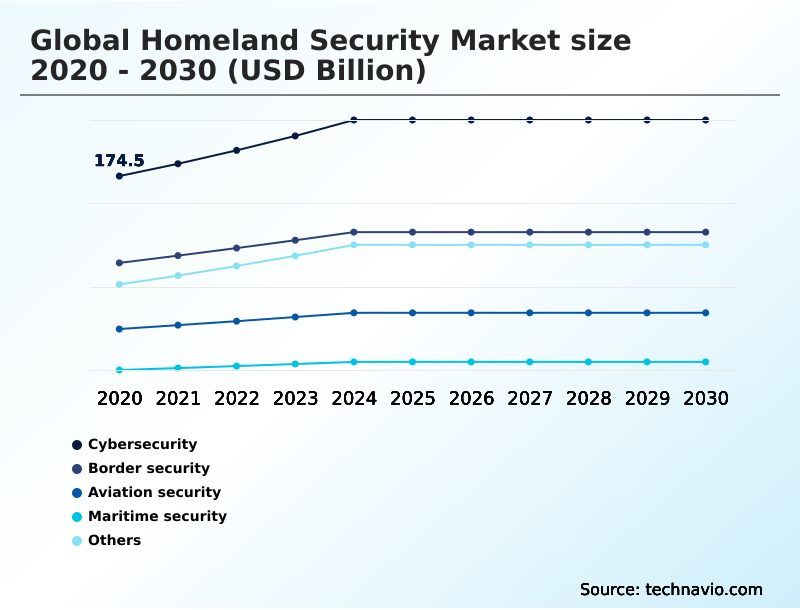
The homeland security industry research report provides comprehensive data (region-wise segment analysis), with forecasts and estimates in "USD billion" for the period 2026-2030, as well as historical data from 2020-2024 for the following segments.

  • Type
    • Cybersecurity
    • Border security
    • Aviation security
    • Maritime security
    • Others
  • Component
    • Hardware
    • Software
    • Services
  • End-user
    • Public sector
    • Private sector
  • Geography
    • North America
      • US
      • Canada
      • Mexico
    • Europe
      • Germany
      • France
      • UK
    • APAC
      • China
      • India
      • Japan
    • Middle East and Africa
      • Saudi Arabia
      • UAE
      • South Africa
    • South America
      • Brazil
      • Argentina
      • Colombia
    • Rest of World (ROW)

By Type Insights

The cybersecurity segment is estimated to witness significant growth during the forecast period.

The cybersecurity segment is pivotal, focusing on protecting national digital infrastructure against sophisticated electronic warfare. This involves a strategic shift toward zero-trust architecture, where continuous verification is mandatory, rendering the traditional network perimeter obsolete.

Core to this is safeguarding the digital supply chain to prevent infiltration via third-party software vulnerabilities.

The deployment of advanced cybersecurity defensive software within sovereign cloud environments is critical for defending against advanced persistent threats and maintaining the integrity of sovereign information.

Integrating AI-powered forensic analysis into command and control platforms enhances the real-time identification of anomalous network behavior, improving breach detection rates by over 30%.

This data-centric approach ensures a resilient digital environment capable of defending a nation's expanding digital attack surface.

Request Free Sample

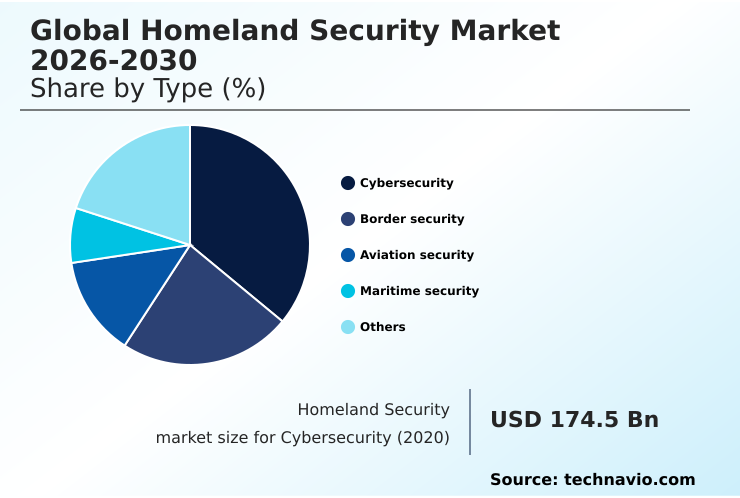
The Cybersecurity segment was valued at USD 214.6 billion in 2024 and showed a gradual increase during the forecast period.

Request Free Sample

Regional Analysis

North America is estimated to contribute 35.7% to the growth of the global market during the forecast period.Technavio’s analysts have elaborately explained the regional trends and drivers that shape the market during the forecast period.

See How Homeland Security Market Demand is Rising in North America Request Free Sample

The geographic landscape of the market is diverse, with regional priorities shaping technology adoption. In North America, the focus is on critical infrastructure protection and securing the digital supply chain.

APAC is a high-growth region, driven by investments in maritime security and smart city initiatives that leverage extensive surveillance systems and data-centric governance. In this region, enhanced maritime domain awareness has improved incident response times by over 25%.

Europe navigates a complex regulatory environment, balancing border security needs with stringent privacy laws, which fosters innovation in privacy-preserving technologies like federated learning. Coordinated disinformation campaigns are a global concern, prompting cross-regional collaboration among financial intelligence units.

Key technologies like facial recognition and iris scanning are being deployed globally, but their application is tailored to regional legal frameworks, creating a fragmented but opportunity-rich market.

Market Dynamics

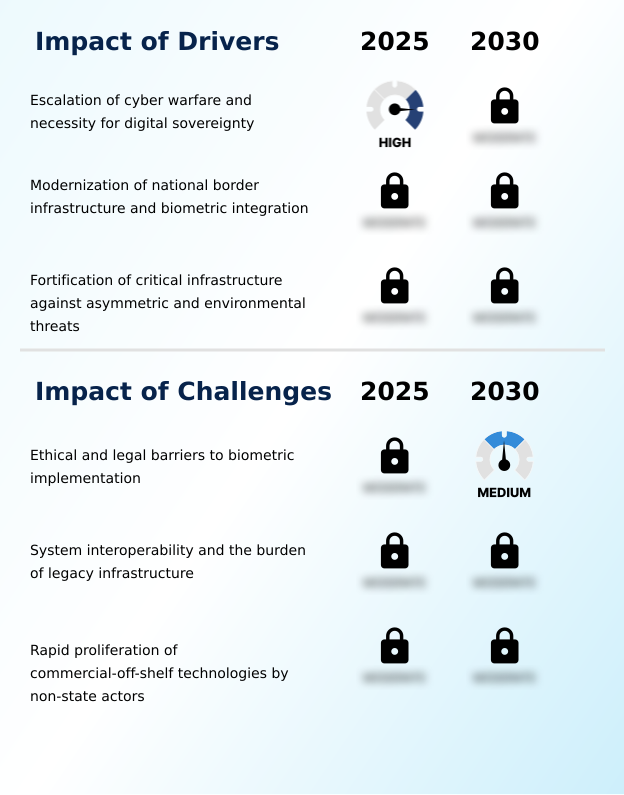
Our researchers analyzed the data with 2025 as the base year, along with the key drivers, trends, and challenges. A holistic analysis of drivers will help companies refine their marketing strategies to gain a competitive advantage.

  • An analysis of the global homeland security market reveals distinct growth patterns influenced by several factors. The market's structure, defined by the global homeland security market by type and the global homeland security market by component, shows a clear shift toward software and service-based solutions.
  • Key global homeland security market growth drivers include persistent geopolitical instability and the need to protect critical national assets, while significant global homeland security market challenges stem from ethical debates over public surveillance and the high cost of overhauling legacy systems. Recent global homeland security market developments indicate a focus on AI integration, as highlighted by major players.
  • The global homeland security market's key trends, such as the move toward zero-trust architecture for government agencies and the use of autonomous systems for border management, are reshaping operational strategies. Regionally, the global homeland security market in North America leads in spending, while the global homeland security market in APAC exhibits the fastest growth.
  • The global homeland security market in Europe contends with strict data privacy regulations affecting biometric implementation in homeland security. Specific segments like the aviation security screening systems market and the maritime security surveillance technologies market are seeing rapid innovation.
  • The expanding role of cloud computing in homeland security is undeniable, yet interoperability issues in security systems remain a primary concern for procurement officers, with organizations reporting that integration challenges can increase project timelines by more than 30% compared to greenfield deployments.

What are the key market drivers leading to the rise in the adoption of Homeland Security Industry?

  • The escalation of cyber warfare and the corresponding necessity for digital sovereignty are key drivers propelling the market's growth.

  • Market growth is significantly propelled by the dual pressures of escalating cyber warfare and the critical need for digital sovereignty.
  • Nations are building a resilient digital environment to protect sovereign information from advanced persistent threats that exploit an ever-expanding digital attack surface. This has led to the widespread adoption of zero-trust architectures, ensuring resilient connectivity and robust digital perimeter protection.
  • Modernization of border management is another key driver, with the deployment of advanced biometric processing systems accelerating traveler verification by up to 60%. These systems, along with unmanned aerial vehicles, form a layered defense strategy.
  • Concurrently, protecting critical national infrastructure with technologies like grid-stability sensors enhances the national resilience framework, enabling effective threat prioritization against both physical and digital disruptive forces.

What are the market trends shaping the Homeland Security Industry?

  • The proliferation of artificial intelligence for predictive threat assessment is emerging as a significant market trend. This development enables proactive security measures by identifying potential hazards before they manifest.

  • Key market trends are centered on the integration of intelligent and automated technologies to create a proactive security posture. The adoption of zero-trust models is becoming standard, moving beyond traditional perimeter defenses to a framework of continuous verification that limits lateral movement, reducing breach impact by over 60%.
  • This is complemented by the proliferation of autonomous surveillance, where swarm drones and other unmanned systems provide persistent monitoring. Such systems, particularly for autonomous border surveillance, expand coverage by fivefold compared to manual patrols.
  • Central to these trends is the use of high-performance computing and edge analytics for predictive threat assessment and modeling, which allows for the identification of behavioral deviations before they escalate. These technologies are creating a digital fence that provides a unified operational view, enhancing overall situational awareness and enabling more effective security responses.

What challenges does the Homeland Security Industry face during its growth?

  • Ethical considerations and legal barriers associated with biometric implementation present a key challenge affecting the industry's growth trajectory.

  • The market faces significant challenges from the rapid evolution of asymmetric threats and the technologies that enable them. Adversaries are leveraging commercial-off-shelf technologies, leading to a constant need for innovation in asymmetric threats neutralization. The rise of high-fidelity synthetic media and deepfake detection has become a critical concern, requiring the development of advanced synthetic media detection algorithms.
  • This cat-and-mouse game demands continuous investment in countermeasures like signal jamming equipment. Furthermore, the use of encrypted communication by non-state actors complicates monitoring efforts by financial intelligence units.
  • Addressing these challenges necessitates a move toward privacy-preserving technologies that can be deployed without violating ethical and legal norms, ensuring that security measures do not compromise civil liberties while effectively countering threats from illegal logging to coordinated disinformation campaigns.

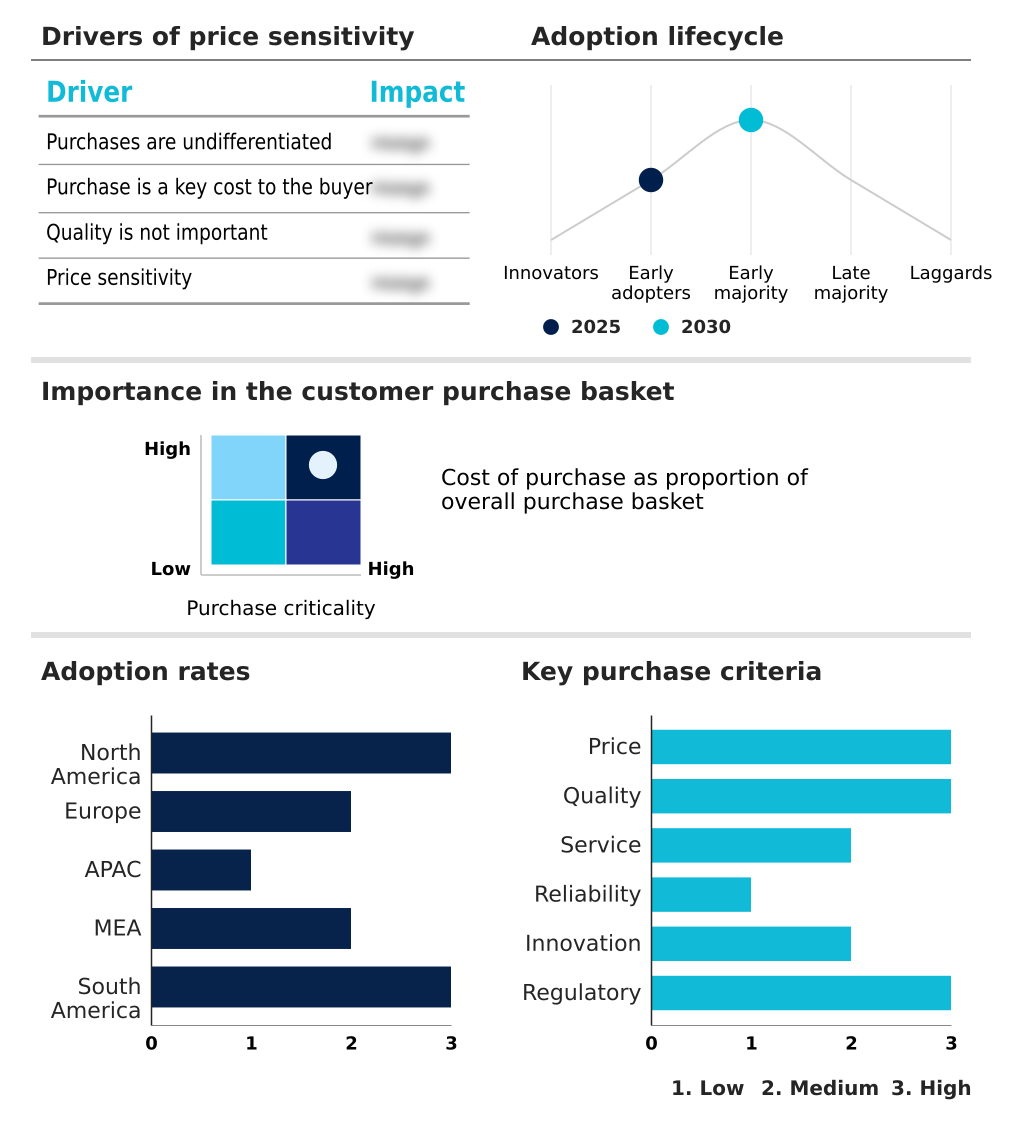
Exclusive Technavio Analysis on Customer Landscape

The homeland security market forecasting report includes the adoption lifecycle of the market, covering from the innovator’s stage to the laggard’s stage. It focuses on adoption rates in different regions based on penetration. Furthermore, the homeland security market report also includes key purchase criteria and drivers of price sensitivity to help companies evaluate and develop their market growth analysis strategies.

Customer Landscape of Homeland Security Industry

Competitive Landscape

Companies are implementing various strategies, such as strategic alliances, homeland security market forecast, partnerships, mergers and acquisitions, geographical expansion, and product/service launches, to enhance their presence in the industry.

Airbus SE - Key offerings include integrated intelligence systems, secure communications, and specialized aircraft for comprehensive border and maritime surveillance operations, enhancing national security frameworks.

The industry research and growth report includes detailed analyses of the competitive landscape of the market and information about key companies, including:

  • Airbus SE
  • Axon Enterprise Inc.
  • BAE Systems Plc
  • Booz Allen Hamilton Corp.
  • CACI International Inc.
  • Elbit Systems Ltd.
  • General Dynamics Corp.
  • Honeywell International Inc.
  • IDEMIA France SAS
  • L3Harris Technologies Inc.
  • Leidos Holdings Inc.
  • Leonardo S.p.A.
  • Lockheed Martin Corp.
  • Motorola Solutions Inc.
  • NEC Corp.
  • Northrop Grumman Corp.
  • Palantir Technologies Inc.
  • RTX Corp.
  • Smiths Detection Group Ltd.
  • Thales Group

Qualitative and quantitative analysis of companies has been conducted to help clients understand the wider business environment as well as the strengths and weaknesses of key industry players. Data is qualitatively analyzed to categorize companies as pure play, category-focused, industry-focused, and diversified; it is quantitatively analyzed to categorize companies as dominant, leading, strong, tentative, and weak.

Recent Development and News in Homeland security market

  • In August 2025, Cisco Systems launched a comprehensive zero-trust security architecture tailored for national critical infrastructure, integrating physical sensor data with network traffic analysis to prevent lateral movement by malicious actors.
  • In September 2025, the Australian Home Affairs Department implemented a new automated biometric processing system for international maritime arrivals to streamline the identification process and enhance coastal security.
  • In October 2025, the European Data Protection Board issued a restrictive guideline that further limited the use of real-time biometric identification in public spaces by law enforcement agencies.
  • In November 2025, General Electric Vernova introduced a new series of advanced grid-stability sensors designed to protect power distribution networks from physical sabotage and electromagnetic interference.

Dive into Technavio’s robust research methodology, blending expert interviews, extensive data synthesis, and validated models for unparalleled Homeland Security Market insights. See full methodology.

Market Scope
Page number 312
Base year 2025
Historic period 2020-2024
Forecast period 2026-2030
Growth momentum & CAGR Accelerate at a CAGR of 5.8%
Market growth 2026-2030 USD 202.2 billion
Market structure Fragmented
YoY growth 2025-2026(%) 5.5%
Key countries US, Canada, Mexico, Germany, France, UK, Italy, Spain, The Netherlands, China, India, Japan, South Korea, Australia, Indonesia, Saudi Arabia, UAE, South Africa, Israel, Turkey, Brazil, Argentina and Colombia
Competitive landscape Leading Companies, Market Positioning of Companies, Competitive Strategies, and Industry Risks

Request Free Sample

Research Analyst Overview

  • The homeland security market is evolving from siloed defense mechanisms toward integrated, intelligence-driven ecosystems. This strategic shift is driven by the dual needs of countering sophisticated asymmetric threats and achieving digital sovereignty.
  • Central to this transformation is the adoption of zero-trust models, a boardroom-level decision that forces a complete re-evaluation of cybersecurity budgets, moving investment from perimeter security to continuous verification. The deployment of autonomous surveillance, powered by edge analytics, is reshaping border security and critical infrastructure protection.
  • For instance, leveraging edge computing in surveillance systems has demonstrated an ability to reduce data transmission costs by over 60% while accelerating real-time threat detection. Technologies such as biometric identification, command and control platforms, and predictive modeling are no longer standalone tools but are integral components of a cohesive defense posture.
  • This integration is essential for managing an expanding digital attack surface and ensuring a resilient digital environment against persistent cyber warfare.

What are the Key Data Covered in this Homeland Security Market Research and Growth Report?

  • What is the expected growth of the Homeland Security Market between 2026 and 2030?

    • USD 202.2 billion, at a CAGR of 5.8%

  • What segmentation does the market report cover?

    • The report is segmented by Type (Cybersecurity, Border security, Aviation security, Maritime security, and Others), Component (Hardware, Software, and Services), End-user (Public sector, and Private sector) and Geography (North America, Europe, APAC, Middle East and Africa, South America)

  • Which regions are analyzed in the report?

    • North America, Europe, APAC, Middle East and Africa and South America

  • What are the key growth drivers and market challenges?

    • Escalation of cyber warfare and necessity for digital sovereignty, Ethical and legal barriers to biometric implementation

  • Who are the major players in the Homeland Security Market?

    • Airbus SE, Axon Enterprise Inc., BAE Systems Plc, Booz Allen Hamilton Corp., CACI International Inc., Elbit Systems Ltd., General Dynamics Corp., Honeywell International Inc., IDEMIA France SAS, L3Harris Technologies Inc., Leidos Holdings Inc., Leonardo S.p.A., Lockheed Martin Corp., Motorola Solutions Inc., NEC Corp., Northrop Grumman Corp., Palantir Technologies Inc., RTX Corp., Smiths Detection Group Ltd. and Thales Group

Market Research Insights

  • Market dynamics are increasingly shaped by the push for digital perimeter protection and enhanced situational awareness. The adoption of autonomous border surveillance has improved threat detection efficiency in remote terrains by over 40%, optimizing personnel deployment.
  • Concurrently, the implementation of zero-trust architectures is a critical response to advanced persistent threats, with early adopters reporting up to a 70% reduction in lateral movement by malicious actors post-breach. A focus on resilient connectivity and threat prioritization is driving investment in platforms that offer a unified operational view.
  • Furthermore, sovereign cloud integration is becoming standard for government agencies, ensuring data integrity while mitigating risks associated with foreign software dependencies. These shifts underscore a move toward proactive, data-centric security models.

We can help! Our analysts can customize this homeland security market research report to meet your requirements.

Get in touch

1. Executive Summary

1.1 Market overview

Executive Summary - Chart on Market Overview
Executive Summary - Data Table on Market Overview
Executive Summary - Chart on Global Market Characteristics
Executive Summary - Chart on Market by Geography
Executive Summary - Chart on Market Segmentation by Type
Executive Summary - Chart on Market Segmentation by Component
Executive Summary - Chart on Market Segmentation by End-user
Executive Summary - Chart on Incremental Growth
Executive Summary - Data Table on Incremental Growth
Executive Summary - Chart on Company Market Positioning

2. Technavio Analysis

2.1 Analysis of price sensitivity, lifecycle, customer purchase basket, adoption rates, and purchase criteria

2.2 Criticality of inputs and Factors of differentiation

Chart on Overview on criticality of inputs and factors of differentiation

2.3 Factors of disruption

Chart on Overview on factors of disruption

2.4 Impact of drivers and challenges

Chart on Impact of drivers and challenges in 2025 and 2030

3. Market Landscape

3.1 Market ecosystem

Chart on Parent Market
Data Table on - Parent Market

3.2 Market characteristics

Chart on Market characteristics analysis

3.3 Value chain analysis

Chart on Value chain analysis

4. Market Sizing

4.1 Market definition

Data Table on Offerings of companies included in the market definition

4.2 Market segment analysis

Market segments

4.3 Market size 2025

4.4 Market outlook: Forecast for 2025-2030

Chart on Global - Market size and forecast 2025-2030 ($ billion)
Data Table on Global - Market size and forecast 2025-2030 ($ billion)
Chart on Global Market: Year-over-year growth 2025-2030 (%)
Data Table on Global Market: Year-over-year growth 2025-2030 (%)

5. Historic Market Size

5.1 Global Homeland Security Market 2020 - 2024

Historic Market Size - Data Table on Global Homeland Security Market 2020 - 2024 ($ billion)

5.2 Type segment analysis 2020 - 2024

Historic Market Size - Type Segment 2020 - 2024 ($ billion)

5.3 Component segment analysis 2020 - 2024

Historic Market Size - Component Segment 2020 - 2024 ($ billion)

5.4 End-user segment analysis 2020 - 2024

Historic Market Size - End-user Segment 2020 - 2024 ($ billion)

5.5 Geography segment analysis 2020 - 2024

Historic Market Size - Geography Segment 2020 - 2024 ($ billion)

5.6 Country segment analysis 2020 - 2024

Historic Market Size - Country Segment 2020 - 2024 ($ billion)

6. Qualitative Analysis

6.1 Impact of AI on Global Homeland Security Market

6.2 Impact of geopolitical conflicts on Global Homeland Security Market

7. Five Forces Analysis

7.1 Five forces summary

Five forces analysis - Comparison between 2025 and 2030

7.2 Bargaining power of buyers

Bargaining power of buyers - Impact of key factors 2025 and 2030

7.3 Bargaining power of suppliers

Bargaining power of suppliers - Impact of key factors in 2025 and 2030

7.4 Threat of new entrants

Threat of new entrants - Impact of key factors in 2025 and 2030

7.5 Threat of substitutes

Threat of substitutes - Impact of key factors in 2025 and 2030

7.6 Threat of rivalry

Threat of rivalry - Impact of key factors in 2025 and 2030

7.7 Market condition

Chart on Market condition - Five forces 2025 and 2030

8. Market Segmentation by Type

8.1 Market segments

Chart on Type - Market share 2025-2030 (%)
Data Table on Type - Market share 2025-2030 (%)

8.2 Comparison by Type

Chart on Comparison by Type
Data Table on Comparison by Type

8.3 Cybersecurity - Market size and forecast 2025-2030

Chart on Cybersecurity - Market size and forecast 2025-2030 ($ billion)
Data Table on Cybersecurity - Market size and forecast 2025-2030 ($ billion)
Chart on Cybersecurity - Year-over-year growth 2025-2030 (%)
Data Table on Cybersecurity - Year-over-year growth 2025-2030 (%)

8.4 Border security - Market size and forecast 2025-2030

Chart on Border security - Market size and forecast 2025-2030 ($ billion)
Data Table on Border security - Market size and forecast 2025-2030 ($ billion)
Chart on Border security - Year-over-year growth 2025-2030 (%)
Data Table on Border security - Year-over-year growth 2025-2030 (%)

8.5 Aviation security - Market size and forecast 2025-2030

Chart on Aviation security - Market size and forecast 2025-2030 ($ billion)
Data Table on Aviation security - Market size and forecast 2025-2030 ($ billion)
Chart on Aviation security - Year-over-year growth 2025-2030 (%)
Data Table on Aviation security - Year-over-year growth 2025-2030 (%)

8.6 Maritime security - Market size and forecast 2025-2030

Chart on Maritime security - Market size and forecast 2025-2030 ($ billion)
Data Table on Maritime security - Market size and forecast 2025-2030 ($ billion)
Chart on Maritime security - Year-over-year growth 2025-2030 (%)
Data Table on Maritime security - Year-over-year growth 2025-2030 (%)

8.7 Others - Market size and forecast 2025-2030

Chart on Others - Market size and forecast 2025-2030 ($ billion)
Data Table on Others - Market size and forecast 2025-2030 ($ billion)
Chart on Others - Year-over-year growth 2025-2030 (%)
Data Table on Others - Year-over-year growth 2025-2030 (%)

8.8 Market opportunity by Type

Market opportunity by Type ($ billion)
Data Table on Market opportunity by Type ($ billion)

9. Market Segmentation by Component

9.1 Market segments

Chart on Component - Market share 2025-2030 (%)
Data Table on Component - Market share 2025-2030 (%)

9.2 Comparison by Component

Chart on Comparison by Component
Data Table on Comparison by Component

9.3 Hardware - Market size and forecast 2025-2030

Chart on Hardware - Market size and forecast 2025-2030 ($ billion)
Data Table on Hardware - Market size and forecast 2025-2030 ($ billion)
Chart on Hardware - Year-over-year growth 2025-2030 (%)
Data Table on Hardware - Year-over-year growth 2025-2030 (%)

9.4 Software - Market size and forecast 2025-2030

Chart on Software - Market size and forecast 2025-2030 ($ billion)
Data Table on Software - Market size and forecast 2025-2030 ($ billion)
Chart on Software - Year-over-year growth 2025-2030 (%)
Data Table on Software - Year-over-year growth 2025-2030 (%)

9.5 Services - Market size and forecast 2025-2030

Chart on Services - Market size and forecast 2025-2030 ($ billion)
Data Table on Services - Market size and forecast 2025-2030 ($ billion)
Chart on Services - Year-over-year growth 2025-2030 (%)
Data Table on Services - Year-over-year growth 2025-2030 (%)

9.6 Market opportunity by Component

Market opportunity by Component ($ billion)
Data Table on Market opportunity by Component ($ billion)

10. Market Segmentation by End-user

10.1 Market segments

Chart on End-user - Market share 2025-2030 (%)
Data Table on End-user - Market share 2025-2030 (%)

10.2 Comparison by End-user

Chart on Comparison by End-user
Data Table on Comparison by End-user

10.3 Public sector - Market size and forecast 2025-2030

Chart on Public sector - Market size and forecast 2025-2030 ($ billion)
Data Table on Public sector - Market size and forecast 2025-2030 ($ billion)
Chart on Public sector - Year-over-year growth 2025-2030 (%)
Data Table on Public sector - Year-over-year growth 2025-2030 (%)

10.4 Private sector - Market size and forecast 2025-2030

Chart on Private sector - Market size and forecast 2025-2030 ($ billion)
Data Table on Private sector - Market size and forecast 2025-2030 ($ billion)
Chart on Private sector - Year-over-year growth 2025-2030 (%)
Data Table on Private sector - Year-over-year growth 2025-2030 (%)

10.5 Market opportunity by End-user

Market opportunity by End-user ($ billion)
Data Table on Market opportunity by End-user ($ billion)

11. Customer Landscape

11.1 Customer landscape overview

Analysis of price sensitivity, lifecycle, customer purchase basket, adoption rates, and purchase criteria

12. Geographic Landscape

12.1 Geographic segmentation

Chart on Market share by geography 2025-2030 (%)
Data Table on Market share by geography 2025-2030 (%)

12.2 Geographic comparison

Chart on Geographic comparison
Data Table on Geographic comparison

12.3 North America - Market size and forecast 2025-2030

Chart on North America - Market size and forecast 2025-2030 ($ billion)
Data Table on North America - Market size and forecast 2025-2030 ($ billion)
Chart on North America - Year-over-year growth 2025-2030 (%)
Data Table on North America - Year-over-year growth 2025-2030 (%)
Chart on Regional Comparison - North America
Data Table on Regional Comparison - North America

12.3.1 US - Market size and forecast 2025-2030

Chart on US - Market size and forecast 2025-2030 ($ billion)
Data Table on US - Market size and forecast 2025-2030 ($ billion)
Chart on US - Year-over-year growth 2025-2030 (%)
Data Table on US - Year-over-year growth 2025-2030 (%)

12.3.2 Canada - Market size and forecast 2025-2030

Chart on Canada - Market size and forecast 2025-2030 ($ billion)
Data Table on Canada - Market size and forecast 2025-2030 ($ billion)
Chart on Canada - Year-over-year growth 2025-2030 (%)
Data Table on Canada - Year-over-year growth 2025-2030 (%)

12.3.3 Mexico - Market size and forecast 2025-2030

Chart on Mexico - Market size and forecast 2025-2030 ($ billion)
Data Table on Mexico - Market size and forecast 2025-2030 ($ billion)
Chart on Mexico - Year-over-year growth 2025-2030 (%)
Data Table on Mexico - Year-over-year growth 2025-2030 (%)

12.4 Europe - Market size and forecast 2025-2030

Chart on Europe - Market size and forecast 2025-2030 ($ billion)
Data Table on Europe - Market size and forecast 2025-2030 ($ billion)
Chart on Europe - Year-over-year growth 2025-2030 (%)
Data Table on Europe - Year-over-year growth 2025-2030 (%)
Chart on Regional Comparison - Europe
Data Table on Regional Comparison - Europe

12.4.1 Germany - Market size and forecast 2025-2030

Chart on Germany - Market size and forecast 2025-2030 ($ billion)
Data Table on Germany - Market size and forecast 2025-2030 ($ billion)
Chart on Germany - Year-over-year growth 2025-2030 (%)
Data Table on Germany - Year-over-year growth 2025-2030 (%)

12.4.2 France - Market size and forecast 2025-2030

Chart on France - Market size and forecast 2025-2030 ($ billion)
Data Table on France - Market size and forecast 2025-2030 ($ billion)
Chart on France - Year-over-year growth 2025-2030 (%)
Data Table on France - Year-over-year growth 2025-2030 (%)

12.4.3 UK - Market size and forecast 2025-2030

Chart on UK - Market size and forecast 2025-2030 ($ billion)
Data Table on UK - Market size and forecast 2025-2030 ($ billion)
Chart on UK - Year-over-year growth 2025-2030 (%)
Data Table on UK - Year-over-year growth 2025-2030 (%)

12.4.4 Italy - Market size and forecast 2025-2030

Chart on Italy - Market size and forecast 2025-2030 ($ billion)
Data Table on Italy - Market size and forecast 2025-2030 ($ billion)
Chart on Italy - Year-over-year growth 2025-2030 (%)
Data Table on Italy - Year-over-year growth 2025-2030 (%)

12.4.5 Spain - Market size and forecast 2025-2030

Chart on Spain - Market size and forecast 2025-2030 ($ billion)
Data Table on Spain - Market size and forecast 2025-2030 ($ billion)
Chart on Spain - Year-over-year growth 2025-2030 (%)
Data Table on Spain - Year-over-year growth 2025-2030 (%)

12.4.6 The Netherlands - Market size and forecast 2025-2030

Chart on The Netherlands - Market size and forecast 2025-2030 ($ billion)
Data Table on The Netherlands - Market size and forecast 2025-2030 ($ billion)
Chart on The Netherlands - Year-over-year growth 2025-2030 (%)
Data Table on The Netherlands - Year-over-year growth 2025-2030 (%)

12.5 APAC - Market size and forecast 2025-2030

Chart on APAC - Market size and forecast 2025-2030 ($ billion)
Data Table on APAC - Market size and forecast 2025-2030 ($ billion)
Chart on APAC - Year-over-year growth 2025-2030 (%)
Data Table on APAC - Year-over-year growth 2025-2030 (%)
Chart on Regional Comparison - APAC
Data Table on Regional Comparison - APAC

12.5.1 China - Market size and forecast 2025-2030

Chart on China - Market size and forecast 2025-2030 ($ billion)
Data Table on China - Market size and forecast 2025-2030 ($ billion)
Chart on China - Year-over-year growth 2025-2030 (%)
Data Table on China - Year-over-year growth 2025-2030 (%)

12.5.2 India - Market size and forecast 2025-2030

Chart on India - Market size and forecast 2025-2030 ($ billion)
Data Table on India - Market size and forecast 2025-2030 ($ billion)
Chart on India - Year-over-year growth 2025-2030 (%)
Data Table on India - Year-over-year growth 2025-2030 (%)

12.5.3 Japan - Market size and forecast 2025-2030

Chart on Japan - Market size and forecast 2025-2030 ($ billion)
Data Table on Japan - Market size and forecast 2025-2030 ($ billion)
Chart on Japan - Year-over-year growth 2025-2030 (%)
Data Table on Japan - Year-over-year growth 2025-2030 (%)

12.5.4 South Korea - Market size and forecast 2025-2030

Chart on South Korea - Market size and forecast 2025-2030 ($ billion)
Data Table on South Korea - Market size and forecast 2025-2030 ($ billion)
Chart on South Korea - Year-over-year growth 2025-2030 (%)
Data Table on South Korea - Year-over-year growth 2025-2030 (%)

12.5.5 Australia - Market size and forecast 2025-2030

Chart on Australia - Market size and forecast 2025-2030 ($ billion)
Data Table on Australia - Market size and forecast 2025-2030 ($ billion)
Chart on Australia - Year-over-year growth 2025-2030 (%)
Data Table on Australia - Year-over-year growth 2025-2030 (%)

12.5.6 Indonesia - Market size and forecast 2025-2030

Chart on Indonesia - Market size and forecast 2025-2030 ($ billion)
Data Table on Indonesia - Market size and forecast 2025-2030 ($ billion)
Chart on Indonesia - Year-over-year growth 2025-2030 (%)
Data Table on Indonesia - Year-over-year growth 2025-2030 (%)

12.6 Middle East and Africa - Market size and forecast 2025-2030

Chart on Middle East and Africa - Market size and forecast 2025-2030 ($ billion)
Data Table on Middle East and Africa - Market size and forecast 2025-2030 ($ billion)
Chart on Middle East and Africa - Year-over-year growth 2025-2030 (%)
Data Table on Middle East and Africa - Year-over-year growth 2025-2030 (%)
Chart on Regional Comparison - Middle East and Africa
Data Table on Regional Comparison - Middle East and Africa

12.6.1 Saudi Arabia - Market size and forecast 2025-2030

Chart on Saudi Arabia - Market size and forecast 2025-2030 ($ billion)
Data Table on Saudi Arabia - Market size and forecast 2025-2030 ($ billion)
Chart on Saudi Arabia - Year-over-year growth 2025-2030 (%)
Data Table on Saudi Arabia - Year-over-year growth 2025-2030 (%)

12.6.2 UAE - Market size and forecast 2025-2030

Chart on UAE - Market size and forecast 2025-2030 ($ billion)
Data Table on UAE - Market size and forecast 2025-2030 ($ billion)
Chart on UAE - Year-over-year growth 2025-2030 (%)
Data Table on UAE - Year-over-year growth 2025-2030 (%)

12.6.3 South Africa - Market size and forecast 2025-2030

Chart on South Africa - Market size and forecast 2025-2030 ($ billion)
Data Table on South Africa - Market size and forecast 2025-2030 ($ billion)
Chart on South Africa - Year-over-year growth 2025-2030 (%)
Data Table on South Africa - Year-over-year growth 2025-2030 (%)

12.6.4 Israel - Market size and forecast 2025-2030

Chart on Israel - Market size and forecast 2025-2030 ($ billion)
Data Table on Israel - Market size and forecast 2025-2030 ($ billion)
Chart on Israel - Year-over-year growth 2025-2030 (%)
Data Table on Israel - Year-over-year growth 2025-2030 (%)

12.6.5 Turkey - Market size and forecast 2025-2030

Chart on Turkey - Market size and forecast 2025-2030 ($ billion)
Data Table on Turkey - Market size and forecast 2025-2030 ($ billion)
Chart on Turkey - Year-over-year growth 2025-2030 (%)
Data Table on Turkey - Year-over-year growth 2025-2030 (%)

12.7 South America - Market size and forecast 2025-2030

Chart on South America - Market size and forecast 2025-2030 ($ billion)
Data Table on South America - Market size and forecast 2025-2030 ($ billion)
Chart on South America - Year-over-year growth 2025-2030 (%)
Data Table on South America - Year-over-year growth 2025-2030 (%)
Chart on Regional Comparison - South America
Data Table on Regional Comparison - South America

12.7.1 Brazil - Market size and forecast 2025-2030

Chart on Brazil - Market size and forecast 2025-2030 ($ billion)
Data Table on Brazil - Market size and forecast 2025-2030 ($ billion)
Chart on Brazil - Year-over-year growth 2025-2030 (%)
Data Table on Brazil - Year-over-year growth 2025-2030 (%)

12.7.2 Argentina - Market size and forecast 2025-2030

Chart on Argentina - Market size and forecast 2025-2030 ($ billion)
Data Table on Argentina - Market size and forecast 2025-2030 ($ billion)
Chart on Argentina - Year-over-year growth 2025-2030 (%)
Data Table on Argentina - Year-over-year growth 2025-2030 (%)

12.7.3 Colombia - Market size and forecast 2025-2030

Chart on Colombia - Market size and forecast 2025-2030 ($ billion)
Data Table on Colombia - Market size and forecast 2025-2030 ($ billion)
Chart on Colombia - Year-over-year growth 2025-2030 (%)
Data Table on Colombia - Year-over-year growth 2025-2030 (%)

12.8 Market opportunity by geography

Market opportunity by geography ($ billion)
Data Tables on Market opportunity by geography ($ billion)

13. Drivers, Challenges, and Opportunity

13.1 Market drivers

Escalation of cyber warfare and necessity for digital sovereignty
Modernization of national border infrastructure and biometric integration
Fortification of critical infrastructure against asymmetric and environmental threats

13.2 Market challenges

Ethical and legal barriers to biometric implementation
System interoperability and the burden of legacy infrastructure
Rapid proliferation of commercial-off-shelf technologies by non-state actors

13.3 Impact of drivers and challenges

Impact of drivers and challenges in 2025 and 2030

13.4 Market opportunities

Proliferation of AI for predictive threat assessment
Adoption of unified zero-trust models for critical infrastructure protection
Deployment of autonomous surveillance and edge analytics in border management

14. Competitive Landscape

14.1 Overview

14.2

Overview on criticality of inputs and factors of differentiation

14.3 Landscape disruption

Overview on factors of disruption

14.4 Industry risks

Impact of key risks on business

15. Competitive Analysis

15.1 Companies profiled

Companies covered

15.2 Company ranking index

15.3 Market positioning of companies

Matrix on companies position and classification

15.4 Airbus SE

Airbus SE - Overview
Airbus SE - Business segments
Airbus SE - Key news
Airbus SE - Key offerings
Airbus SE - Segment focus
SWOT

15.5 Axon Enterprise Inc.

Axon Enterprise Inc. - Overview
Axon Enterprise Inc. - Business segments
Axon Enterprise Inc. - Key news
Axon Enterprise Inc. - Key offerings
Axon Enterprise Inc. - Segment focus
SWOT

15.6 BAE Systems Plc

BAE Systems Plc - Overview
BAE Systems Plc - Business segments
BAE Systems Plc - Key offerings
BAE Systems Plc - Segment focus
SWOT

15.7 Booz Allen Hamilton Corp.

Booz Allen Hamilton Corp. - Overview
Booz Allen Hamilton Corp. - Product / Service
Booz Allen Hamilton Corp. - Key offerings
SWOT

15.8 CACI International Inc.

CACI International Inc. - Overview
CACI International Inc. - Business segments
CACI International Inc. - Key news
CACI International Inc. - Key offerings
CACI International Inc. - Segment focus
SWOT

15.9 Elbit Systems Ltd.

Elbit Systems Ltd. - Overview
Elbit Systems Ltd. - Business segments
Elbit Systems Ltd. - Key offerings
Elbit Systems Ltd. - Segment focus
SWOT

15.10 General Dynamics Corp.

General Dynamics Corp. - Overview
General Dynamics Corp. - Business segments
General Dynamics Corp. - Key offerings
General Dynamics Corp. - Segment focus
SWOT

15.11 Honeywell International Inc.

Honeywell International Inc. - Overview
Honeywell International Inc. - Business segments
Honeywell International Inc. - Key news
Honeywell International Inc. - Key offerings
Honeywell International Inc. - Segment focus
SWOT

15.12 IDEMIA France SAS

IDEMIA France SAS - Overview
IDEMIA France SAS - Product / Service
IDEMIA France SAS - Key offerings
SWOT

15.13 L3Harris Technologies Inc.

L3Harris Technologies Inc. - Overview
L3Harris Technologies Inc. - Business segments
L3Harris Technologies Inc. - Key offerings
L3Harris Technologies Inc. - Segment focus
SWOT

15.14 Leidos Holdings Inc.

Leidos Holdings Inc. - Overview
Leidos Holdings Inc. - Business segments
Leidos Holdings Inc. - Key offerings
Leidos Holdings Inc. - Segment focus
SWOT

15.15 Leonardo S.p.A.

Leonardo S.p.A. - Overview
Leonardo S.p.A. - Business segments
Leonardo S.p.A. - Key offerings
Leonardo S.p.A. - Segment focus
SWOT

15.16 Lockheed Martin Corp.

Lockheed Martin Corp. - Overview
Lockheed Martin Corp. - Business segments
Lockheed Martin Corp. - Key offerings
Lockheed Martin Corp. - Segment focus
SWOT

15.17 Motorola Solutions Inc.

Motorola Solutions Inc. - Overview
Motorola Solutions Inc. - Business segments
Motorola Solutions Inc. - Key news
Motorola Solutions Inc. - Key offerings
Motorola Solutions Inc. - Segment focus
SWOT

15.18 NEC Corp.

NEC Corp. - Overview
NEC Corp. - Business segments
NEC Corp. - Key offerings
NEC Corp. - Segment focus
SWOT

16. Appendix

16.1 Scope of the report

Market definition
Objectives
Notes and caveats

16.2 Inclusions and exclusions checklist

Inclusions checklist
Exclusions checklist

16.3 Currency conversion rates for US$

16.4 Research methodology

16.5 Data procurement

Information sources

16.6 Data validation

16.7 Validation techniques employed for market sizing

16.8 Data synthesis

16.9 360 degree market analysis

16.10 List of abbreviations

Research Methodology

Technavio presents a detailed picture of the market by way of study, synthesis, and summation of data from multiple sources. The analysts have presented the various facets of the market with a particular focus on identifying the key industry influencers. The data thus presented is comprehensive, reliable, and the result of extensive research, both primary and secondary.

INFORMATION SOURCES

Primary sources

  • Manufacturers and suppliers
  • Channel partners
  • Industry experts
  • Strategic decision makers

Secondary sources

  • Industry journals and periodicals
  • Government data
  • Financial reports of key industry players
  • Historical data
  • Press releases

DATA ANALYSIS

Data Synthesis

  • Collation of data
  • Estimation of key figures
  • Analysis of derived insights

Data Validation

  • Triangulation with data models
  • Reference against proprietary databases
  • Corroboration with industry experts

REPORT WRITING

Qualitative

  • Market drivers
  • Market challenges
  • Market trends
  • Five forces analysis

Quantitative

  • Market size and forecast
  • Market segmentation
  • Geographical insights
  • Competitive landscape

Interested in this report?

Get your sample now to see our research methodology and insights!

Download Now

Frequently Asked Questions

Homeland Security market growth will increase by USD 202.2 billion during 2026-2030.

The Homeland Security market is expected to grow at a CAGR of 5.8% during 2026-2030.

Homeland Security market is segmented by Type (Cybersecurity, Border security, Aviation security, Maritime security, Others) Component (Hardware, Software, Services) End-user (Public sector, Private sector)

Airbus SE, Axon Enterprise Inc., BAE Systems Plc, Booz Allen Hamilton Corp., CACI International Inc., Elbit Systems Ltd., General Dynamics Corp., Honeywell International Inc., IDEMIA France SAS, L3Harris Technologies Inc., Leidos Holdings Inc., Leonardo S.p.A., Lockheed Martin Corp., Motorola Solutions Inc., NEC Corp., Northrop Grumman Corp., Palantir Technologies Inc., RTX Corp., Smiths Detection Group Ltd., Thales Group are a few of the key vendors in the Homeland Security market.

North America will register the highest growth rate of 35.7% among the other regions. Therefore, the Homeland Security market in North America is expected to garner significant business opportunities for the vendors during the forecast period.

US, Canada, Mexico, Germany, France, UK, Italy, Spain, The Netherlands, China, India, Japan, South Korea, Australia, Indonesia, Saudi Arabia, UAE, South Africa, Israel, Turkey, Brazil, Argentina, Colombia

  • Escalation of cyber warfare and necessity for digital sovereignty is the driving factor this market.

The Homeland Security market vendors should focus on grabbing business opportunities from the Type segment as it accounted for the largest market share in the base year.
RIA - Research AI Assistant
Ask RIA