Hospital Beds Market Size 2025-2029
The hospital beds market size is forecast to increase by USD 2.69 billion, at a CAGR of 9.9% between 2024 and 2029.
- The market is experiencing significant growth due to the rising number of medical emergencies and the increase in infectious diseases. The global health crisis has highlighted the importance of having an adequate supply of hospital beds to manage the influx of patients. However, the high cost of automated hospital beds poses a challenge for healthcare providers, as they seek to balance the need for advanced technology with budget constraints. Moreover, the growing prevalence of chronic diseases, such as diabetes and cardiovascular diseases, necessitates long-term hospitalization, further increasing the demand for hospital beds. Additionally, the aging population and their subsequent healthcare needs are also contributing to market growth.
- To capitalize on these opportunities, companies can focus on developing cost-effective solutions that offer advanced features, ensuring they cater to the evolving needs of healthcare providers while remaining competitive in the market. Navigating the challenges of cost and affordability will be crucial for market success, as providers seek to optimize their budgets while maintaining the highest level of patient care.
What will be the Size of the Hospital Beds Market during the forecast period?

Explore in-depth regional segment analysis with market size data - historical 2019-2023 and forecasts 2025-2029 - in the full report.
Request Free Sample
The hospital bed market continues to evolve, with dynamic shifts in market trends and applications across various healthcare sectors. Hospital bed frames, a fundamental component of patient care, undergo constant innovation to enhance ergonomics and support systems. Mattresses with advanced pressure distribution technology cater to the unique needs of bariatric patients, while ICU beds integrate intravenous pole systems and height adjustment mechanisms for intensive care. Bedside safety features, such as fall prevention systems and bedside rails, are increasingly integrated into hospital bed designs. Bedside monitors, lighting, and call systems further enhance patient safety and comfort. Hospital bed sustainability is a growing concern, with a focus on recycling and disposal methods, as well as the use of eco-friendly materials in bed covers and linens.
Anti-embolism stockings and durability are essential considerations in hospital bed design, ensuring patient safety and longevity. Hospital bed certification standards continue to evolve, driving innovation in bedside safety and maintenance. The market for hospital bed accessories, such as overbed tables and height adjustment mechanisms, is expanding to cater to diverse patient needs. Ergonomics and aesthetics are increasingly important in hospital bed design, with a focus on patient comfort and satisfaction. The integration of electric actuators and sterilization systems further enhances the functionality and efficiency of hospital beds. The ongoing development of pressure relief systems and anti-decubitus mattresses underscores the continuous pursuit of innovation in this dynamic market.
How is this Hospital Beds Industry segmented?
The hospital beds industry research report provides comprehensive data (region-wise segment analysis), with forecasts and estimates in "USD million" for the period 2025-2029, as well as historical data from 2019-2023 for the following segments.
- Product
- Manual beds
- Semi-automated beds
- Automated beds
- Application
- Intensive care
- Acute care
- Home care
- End-user
- Hospitals
- Home healthcare
- Elderly care facilities
- Ambulatory surgical centers
- Geography
- North America
- US
- Canada
- Europe
- France
- Germany
- UK
- APAC
- China
- India
- Japan
- South Korea
- South America
- Brazil
- Rest of World (ROW)
- North America
.
By Product Insights
The manual beds segment is estimated to witness significant growth during the forecast period.
The market encompasses a range of products designed for healthcare settings, including manual and electric beds, bariatric beds, ICU beds, and recovery room beds. These beds prioritize ergonomics, offering mattress support systems, adjustable frames, and pressure distribution systems to ensure patient comfort and support. Hospital bed sustainability is a growing concern, leading to the development of eco-friendly materials and recycling programs for bed components. Bedside tables, rails, and lighting provide added functionality, while certifications ensure safety and compliance. Hospital bed linens and covers, along with anti-embolism stockings, contribute to patient care and hygiene. Fall prevention systems and repair services ensure patient safety and bed longevity.
Operating room tables and electric actuators facilitate efficient surgical procedures, while hospital bed sterilization and pressure relief systems address infection control and patient comfort. Innovations in hospital bed technology include height adjustment mechanisms, bedside monitors, and call systems, enhancing patient care and convenience. The manual beds segment dominates the market due to their widespread use in healthcare facilities, particularly in less developed regions. Their affordability and adaptability make them suitable for both acute care and home care settings. The growing demand for post-surgery care and the expansion of medical facilities further fuel the market's growth. Despite the prevalence of manual beds, electric beds are gaining traction due to their advanced features and increased patient comfort.
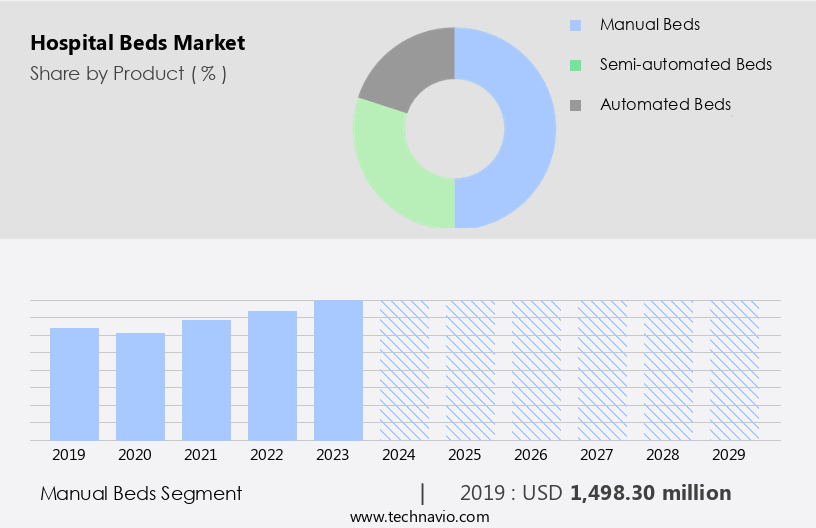
The Manual beds segment was valued at USD 1.5 billion in 2019 and showed a gradual increase during the forecast period.
Regional Analysis
Asia is estimated to contribute 33% to the growth of the global market during the forecast period. Technavio's analysts have elaborately explained the regional trends and drivers that shape the market during the forecast period.

The market in Europe is shaped by demographic and geographic factors, with developed countries like the UK, Germany, and France leading the region's growth. The increasing patient pool, driven by the rise in surgeries and chronic diseases, fuels the demand for hospital beds. Hospitals, clinics, and diagnostics centers are expanding their facilities to accommodate more patients, leading to an increase in the number of hospital beds, medical staff, laboratories, and patient care rooms. Hospital bed ergonomics and sustainability are key considerations in the market, with mattress support systems and bedside tables designed for optimal patient comfort and safety.
Bariatric beds and ICU beds cater to specific patient needs, while fall prevention systems ensure safety for elderly patients. Hospital bed frames and height adjustment mechanisms offer flexibility and convenience for healthcare providers. Hospital bed certifications, such as those for fire safety and infection control, ensure quality and compliance with regulations. Hospital bed linens, covers, and disposal systems maintain hygiene and reduce the risk of infection. Bedside call systems and repair services ensure efficient communication and maintenance. Innovations in hospital beds include electric actuators, bedside monitors, and pressure relief systems, which enhance patient care and improve patient outcomes.
Operating room tables and anti-decubitus mattresses are essential for surgical procedures and patient comfort. Hospital bed sterilization and recycling contribute to sustainability efforts in the healthcare industry. Anti-embolism stockings and bedside safety features, such as bedside rails and lighting, further enhance patient care and safety. Geriatric beds and recovery room beds cater to the unique needs of elderly patients and those recovering from illnesses or surgeries. Overbed tables and hospital bed accessories offer added convenience and functionality. In summary, the market in Europe is driven by demographic and geographic factors, with a focus on patient comfort, safety, and sustainability.
Innovations in hospital bed technology continue to shape the market, offering improved patient outcomes and enhanced healthcare services.
Market Dynamics
Our researchers analyzed the data with 2024 as the base year, along with the key drivers, trends, and challenges. A holistic analysis of drivers will help companies refine their marketing strategies to gain a competitive advantage.
What are the key market drivers leading to the rise in the adoption of Hospital Beds Industry?
- The prevalence of infectious diseases serves as the primary growth factor for the market.
- The global hospital bed market is witnessing significant growth due to the increasing prevalence of various infectious diseases, such as tuberculosis (TB) and COVID-19. For instance, the World Health Organization (WHO) estimates that there are approximately 10.4 million new TB cases and 1.7 million TB-related deaths annually. In the US, the Centers for Disease Control and Prevention (CDC) reports that 7,882 people were diagnosed with tuberculosis between 2021 and 2023. Additionally, Salmonella infections lead to approximately 1.35 million illnesses, 26,500 hospitalizations, and 420 deaths in the US each year. The increasing incidence of such diseases can result in severe illness and hospital admissions, thereby fueling the demand for hospital beds.
- Moreover, the growing aging population, particularly in developed countries, is another significant factor driving the market growth. Geriatric beds, which cater to the unique needs of elderly patients, are gaining popularity. Hospital bed accessories, such as bedside rails, overbed tables, fall prevention systems, bedside lighting, and hospital bed linens, are essential add-ons that enhance the functionality and comfort of hospital beds. Hospital beds are subjected to rigorous use and require regular maintenance to ensure their longevity and optimal performance. The market for hospital bed accessories is expected to grow in tandem with the hospital bed market, as they cater to the evolving needs of patients and healthcare providers.
- Hospital beds are subjected to stringent regulations and certifications to ensure patient safety and quality. Compliance with these certifications is crucial for market players to gain market acceptance and maintain their market position. The market for hospital beds and accessories is highly competitive, with several players vying for market share. The focus on innovation and product development is a key strategy adopted by market players to differentiate themselves and cater to the evolving needs of healthcare providers and patients.
What are the market trends shaping the Hospital Beds Industry?
- The increasing prevalence of medical emergencies represents a significant market trend. This trend underscores the growing demand for efficient and effective healthcare solutions.
- The healthcare industry's response to the increasing prevalence of medical emergencies and life-threatening diseases has led to the demand for advanced hospital equipment, including electric and innovative hospital bed frames. These beds offer height adjustment mechanisms, bedside safety features, and bedside monitors to cater to the intensive care, critical care, acute care, and surgical treatment facilities. The market for hospital bed frames is driven by the growing number of medical emergencies, such as strokes and heart attacks, which account for approximately 795,000 cases in the US each year.
- Additionally, the need for advanced care during treatment increases the demand for durable hospital beds with features like anti-embolism stockings and bed covers. The focus on hospital bed innovation continues, with an emphasis on height adjustment mechanisms and bedside monitors to improve patient care. Hospital bed disposal and recycling are also gaining importance to reduce environmental impact and conserve resources.
What challenges does the Hospital Beds Industry face during its growth?
- The escalating costs of automated hospital beds poses a significant challenge to the growth of the healthcare industry.
- The hospital bed market in the US is subject to stringent regulatory requirements, which necessitate significant investments in ensuring product quality and adherence to operational standards. These regulations aim to minimize risks associated with the manufacturing and use of hospital beds. Consequently, the cost of production for manufacturers increases, leading them to adopt a premium pricing strategy. For example, automated beds offered by leading market players can cost between USD 800 and USD 2,000, while other prominent players price their products at USD 500 and above. Furthermore, weak distribution channels in rural areas, primarily operated and controlled by local suppliers, add to the product costs due to lower order values and consumption volumes.
- Despite these challenges, the market remains dynamic, with ongoing advancements in technology driving demand for features such as hospital bed cleaning systems, bedside call systems, hospital bed repair, operating room tables, electric actuators, hospital bed sterilization, pressure relief systems, and anti-decubitus mattresses. These innovations enhance patient comfort and safety, making them essential components of modern healthcare facilities.
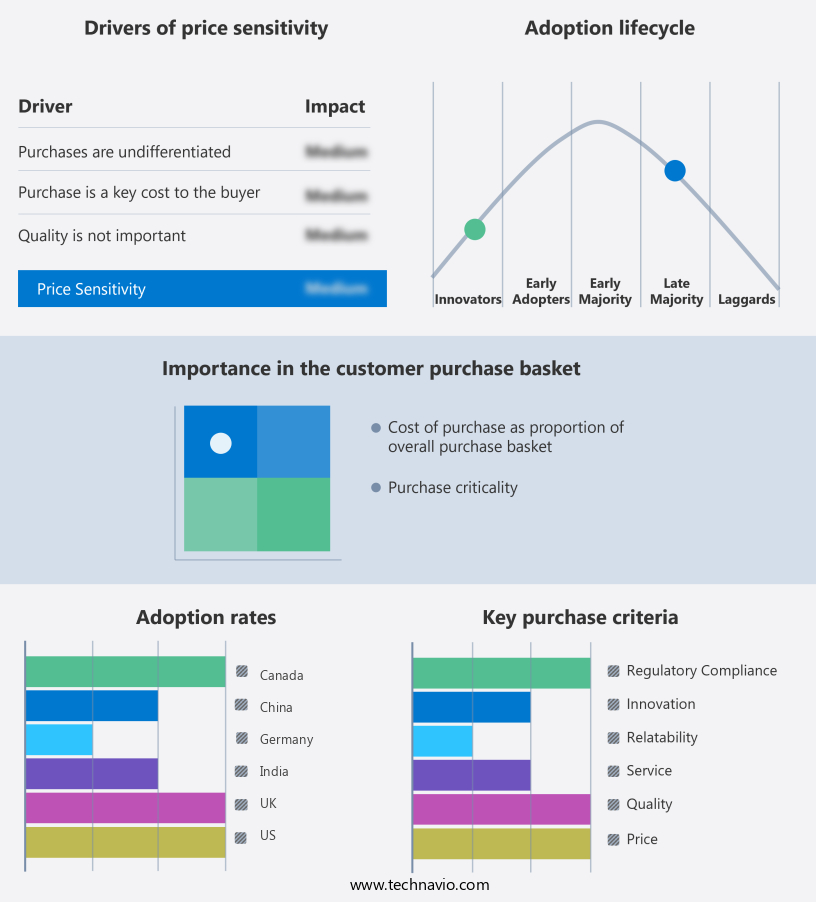
Exclusive Customer Landscape
The hospital beds market forecasting report includes the adoption lifecycle of the market, covering from the innovator's stage to the laggard's stage. It focuses on adoption rates in different regions based on penetration. Furthermore, the hospital beds market report also includes key purchase criteria and drivers of price sensitivity to help companies evaluate and develop their market growth analysis strategies.
Customer Landscape
Key Companies & Market Insights
Companies are implementing various strategies, such as strategic alliances, hospital beds market forecast, partnerships, mergers and acquisitions, geographical expansion, and product/service launches, to enhance their presence in the industry.
Agiliti Inc. - The company introduces the Evolution bed, an advanced hospital solution designed for enhanced mobility, catering to geriatric patients.
The industry research and growth report includes detailed analyses of the competitive landscape of the market and information about key companies, including:
- Agiliti Inc.
- Amico Group of Companies
- ANTANO GROUP S.R.L.
- Baxter International Inc.
- Besco Medical Ltd.
- Getinge AB
- GF Health Products Inc.
- Invacare Corp.
- Joerns Healthcare LLC
- Lojer Oy
- Malvestio Spa
- Medline Industries LP
- PARAMOUNT BED HOLDINGS CO. LTD.
- Savaria Corp.
- Savion Industries
- Stiegelmeyer GmbH and Co. KG
- Stryker Corp.
- Taleb Medical
Qualitative and quantitative analysis of companies has been conducted to help clients understand the wider business environment as well as the strengths and weaknesses of key industry players. Data is qualitatively analyzed to categorize companies as pure play, category-focused, industry-focused, and diversified; it is quantitatively analyzed to categorize companies as dominant, leading, strong, tentative, and weak.
Recent Development and News in Hospital Beds Market
- In February 2023, Stryker Corporation, a leading medical technology company, announced the launch of their new iBed Intensive Care (IC) hospital bed, designed to improve patient safety and clinical workflow efficiency. This innovative bed includes features such as automatic weight redistribution and a 30-degree tilt function, making it an essential addition to intensive care units (ICUs) (Stryker Corporation Press Release, 2023).
- In March 2024, Philips and Royal Philips Medical Systems entered into a strategic partnership with Google Health to develop integrated health solutions, including smart hospital beds. This collaboration aims to leverage Google's advanced analytics capabilities and Philips' expertise in healthcare technology to improve patient care and outcomes (Google and Philips Press Release, 2024).
- In July 2024, Hill-Rom Holdings, Inc. completed the acquisition of Stryker's Hospital Beds business for approximately USD1.8 billion. This acquisition significantly expanded Hill-Rom's product portfolio and strengthened its position as a leading provider of hospital beds and related technologies (Hill-Rom Holdings, Inc. Press Release, 2024).
- In January 2025, the European Union (EU) announced the implementation of new regulations for the manufacturing and sale of hospital beds, focusing on patient safety and environmental sustainability. These regulations include stricter quality standards and increased energy efficiency requirements (European Commission Press Release, 2025).
Research Analyst Overview
- The market is characterized by continuous innovation and adaptation to healthcare facility requirements. Patient monitoring integration and cost-effectiveness analysis are key trends, with hospitals seeking beds that comply with biocompatibility standards and offer user-friendly controls. Adjustable bed frames with anti-slip surfaces and ergonomic design principles ensure patient comfort and safety. Hospital bed robotics and remote control systems streamline operations, while load bearing standards and weight capacity testing ensure durability and reliability. Hydraulic lift systems and adjustable backrests offer flexibility for end-of-life treatment and rehabilitation. Telemedicine integration and smart hospital solutions enable efficient healthcare delivery, with energy-efficient components reducing operational costs.
- Infection control protocols and wireless connectivity are essential for maintaining hygiene and facilitating communication between healthcare providers. Anti-shear technology and recyclable materials contribute to sustainable material sourcing and adherence to home healthcare regulations. Hospital bed automation and material durability testing ensure long-term performance and cost savings for healthcare facilities.
Dive into Technavio's robust research methodology, blending expert interviews, extensive data synthesis, and validated models for unparalleled Hospital Beds Market insights. See full methodology.
|
Market Scope |
|
|
Report Coverage |
Details |
|
Page number |
222 |
|
Base year |
2024 |
|
Historic period |
2019-2023 |
|
Forecast period |
2025-2029 |
|
Growth momentum & CAGR |
Accelerate at a CAGR of 9.9% |
|
Market growth 2025-2029 |
USD 2693.5 million |
|
Market structure |
Fragmented |
|
YoY growth 2024-2025(%) |
8.8 |
|
Key countries |
US, China, Germany, Canada, France, Brazil, Japan, India, UK, and South Korea |
|
Competitive landscape |
Leading Companies, Market Positioning of Companies, Competitive Strategies, and Industry Risks |
What are the Key Data Covered in this Hospital Beds Market Research and Growth Report?
- CAGR of the Hospital Beds industry during the forecast period
- Detailed information on factors that will drive the growth and forecasting between 2025 and 2029
- Precise estimation of the size of the market and its contribution of the industry in focus to the parent market
- Accurate predictions about upcoming growth and trends and changes in consumer behaviour
- Growth of the market across Europe, North America, Asia, and Rest of World (ROW)
- Thorough analysis of the market's competitive landscape and detailed information about companies
- Comprehensive analysis of factors that will challenge the hospital beds market growth of industry companies
We can help! Our analysts can customize this hospital beds market research report to meet your requirements.
 RIA -
RIA - 
