Hydraulic Fluid Connectors Market Analysis, Size, and Forecast 2026-2030: North America (US, Canada, and Mexico), APAC (China, Japan, and India), Europe (Germany, France, and UK), South America (Brazil, Argentina, and Colombia), Middle East and Africa (Saudi Arabia, UAE, and Turkey), and Rest of World (ROW)

Hydraulic Fluid Connectors Market Analysis, Size, and Forecast 2026-2030:
North America (US, Canada, and Mexico), APAC (China, Japan, and India), Europe (Germany, France, and UK), South America (Brazil, Argentina, and Colombia), Middle East and Africa (Saudi Arabia, UAE, and Turkey), and Rest of World (ROW)

Published: Dec 2025 307 Pages SKU: IRTNTR81194

Market Overview at a Glance

$1.96 B
Market Opportunity
6.1%
CAGR 2025 - 2030
36.6%
APAC Growth
$2.56 B
Hydraulic hose segment 2024

Hydraulic Fluid Connectors Market Size 2026-2030

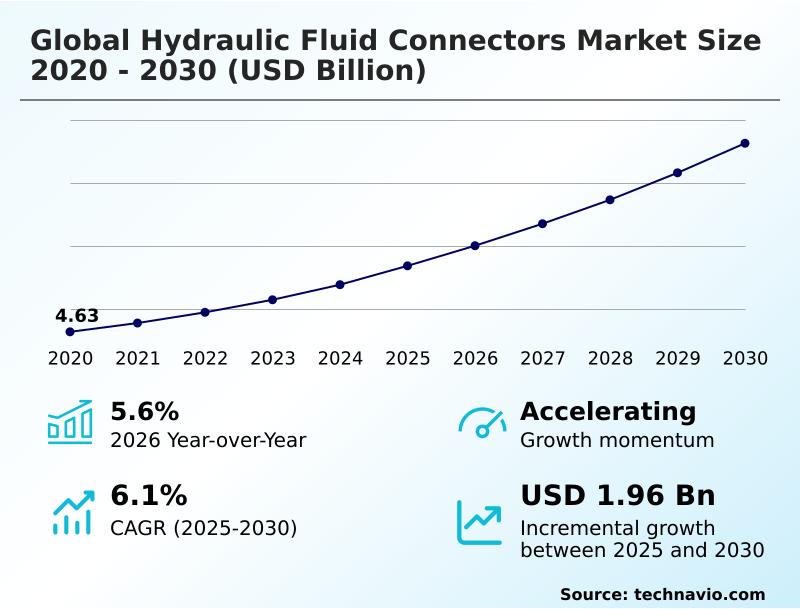
The hydraulic fluid connectors market size is valued to increase by USD 1.96 billion, at a CAGR of 6.1% from 2025 to 2030. Escalating infrastructure development and construction activities will drive the hydraulic fluid connectors market.

Major Market Trends & Insights

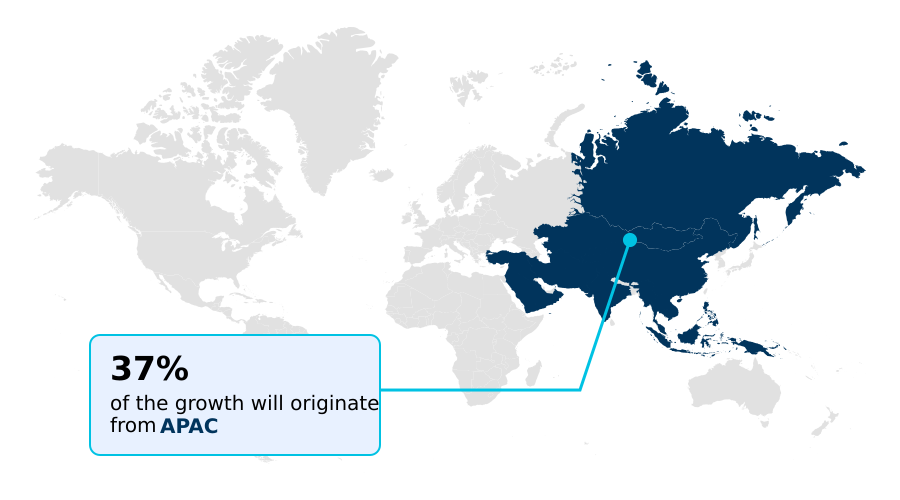
  • APAC dominated the market and accounted for a 36.6% growth during the forecast period.
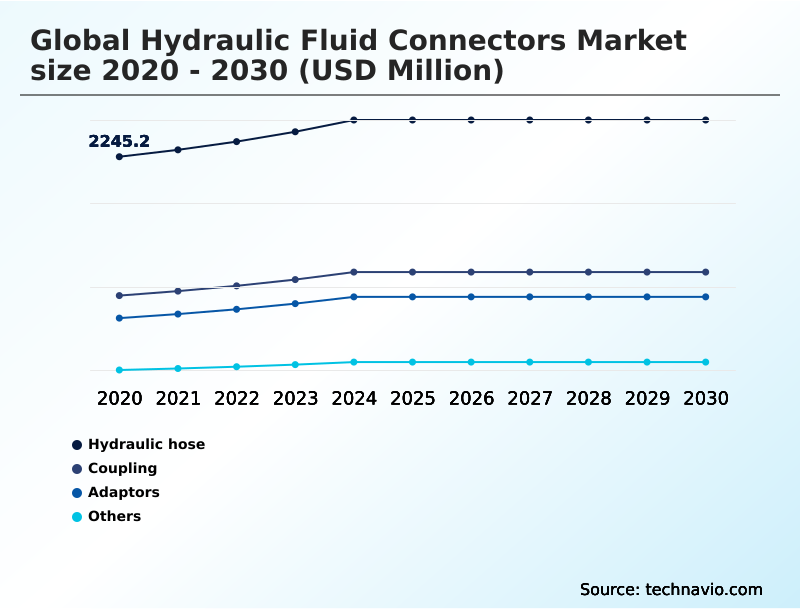
  • By Product - Hydraulic hose segment was valued at USD 2.56 billion in 2024
  • By Material - Steel segment accounted for the largest market revenue share in 2024

Market Size & Forecast

  • Market Opportunities: USD 3.01 billion
  • Market Future Opportunities: USD 1.96 billion
  • CAGR from 2025 to 2030 : 6.1%

Market Summary

  • The hydraulic fluid connectors market is integral to the functionality of modern industrial and mobile machinery, where ensuring secure fluid power transmission is paramount. Growth is driven by the expansion of industrial automation and major infrastructure projects, which demand robust components like high-pressure tube fittings and steel tube fittings capable of withstanding rigorous operational cycles.
  • A significant trend is the integration of smart technologies, with components featuring iot-enabled hydraulic monitoring systems becoming more prevalent. These advancements support predictive maintenance strategies, enabling operators to anticipate failures and optimize schedules. For instance, a heavy equipment OEM can leverage data from smart fittings to proactively replace parts, significantly reducing costly field failures and enhancing overall equipment reliability.
  • However, the market also navigates challenges from raw material price volatility and intense competition, which push manufacturers toward innovations in corrosion-resistant coatings and more efficient hydraulic circuit designs. The focus remains on enhancing performance through advancements in leak-free sealing technology and materials like advanced rubber compounds.

What will be the Size of the Hydraulic Fluid Connectors Market during the forecast period?

Get Key Insights on Market Forecast (PDF) Request Free Sample

How is the Hydraulic Fluid Connectors Market Segmented?

The hydraulic fluid connectors industry research report provides comprehensive data (region-wise segment analysis), with forecasts and estimates in "USD million" for the period 2026-2030, as well as historical data from 2020-2024 for the following segments.

  • Product
    • Hydraulic hose
    • Coupling
    • Adaptors
    • Others
  • Material
    • Steel
    • Stainless steel
    • Aluminum
    • Brass
    • Others
  • Application
    • Manufacturing
    • Oil and gas
    • Automotive
    • Others
  • Geography
    • North America
      • US
      • Canada
      • Mexico
    • APAC
      • China
      • Japan
      • India
    • Europe
      • Germany
      • France
      • UK
    • South America
      • Brazil
      • Argentina
      • Colombia
    • Middle East and Africa
      • Saudi Arabia
      • UAE
      • Turkey
    • Rest of World (ROW)

By Product Insights

The hydraulic hose segment is estimated to witness significant growth during the forecast period.

The hydraulic hose segment is foundational to fluid power transmission, with demand shaped by evolving industrial requirements.

A key trend is the adoption of advanced materials like thermoplastic hydraulic hose and sophisticated synthetic rubber compounds, often featuring high-tensile steel wire braiding for reinforcement.

These innovations deliver superior temperature and chemical resistance, which is critical in heavy-duty industrial applications.

The integration of predictive maintenance sensors into these components aligns with Industry 4.0 objectives, enabling operators to monitor hydraulic system integrity and reduce unplanned downtime by over 25%.

This shift toward intelligent, durable fluid conveyance systems, including high-pressure hose assembly, is essential for optimizing the operational efficiency metrics of modern industrial automation machinery and mobile hydraulic applications.

Request Free Sample

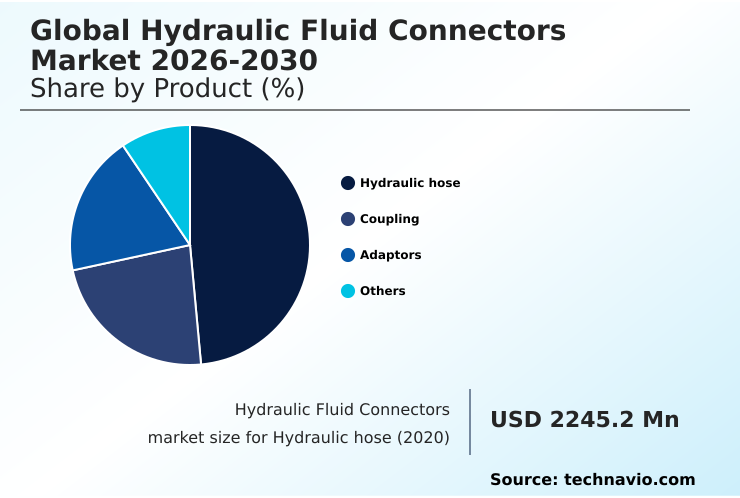
The Hydraulic hose segment was valued at USD 2.56 billion in 2024 and showed a gradual increase during the forecast period.

Request Free Sample

Regional Analysis

APAC is estimated to contribute 36.6% to the growth of the global market during the forecast period.Technavio’s analysts have elaborately explained the regional trends and drivers that shape the market during the forecast period.

See How Hydraulic Fluid Connectors Market Demand is Rising in APAC Request Free Sample

The global market landscape is characterized by diverse regional dynamics. APAC is poised to be the primary growth engine, projected to contribute over 36% of the market’s incremental growth, fueled by massive infrastructure development and industrial expansion.

This contrasts with mature markets in North America and Europe, where growth is driven by technological upgrades and modernization.

For example, stringent European regulations drive adoption of systems using flat-face couplings that improve fluid leakage prevention by over 15%, enhancing environmental compliance.

Meanwhile, developing economies in South America and the Middle East and Africa show steady demand linked to the mining equipment systems and offshore drilling equipment sectors.

The need for reliable fluid power components in these regions supports the market for corrosion-resistant hydraulic adapters and hydraulic workover rigs.

Market Dynamics

Our researchers analyzed the data with 2025 as the base year, along with the key drivers, trends, and challenges. A holistic analysis of drivers will help companies refine their marketing strategies to gain a competitive advantage.

  • Strategic decisions in the hydraulic fluid connectors market hinge on a detailed analysis of application-specific requirements and total lifecycle costs. For OEMs, selecting between high-pressure vs low-pressure hydraulic fittings is a fundamental design choice, while the debate over flat face vs threaded quick couplers often centers on balancing connection speed with system integrity.
  • In harsh environments, the benefits of corrosion-resistant hydraulic adapters and stainless steel quick connect couplings become paramount for ensuring longevity and safety. The commitment to a leak-free hydraulic hose assembly process is no longer optional, as it directly impacts both operational expenses and environmental compliance.
  • For instance, OEMs using pre-tested hydraulic tube assembly for manufacturing report assembly line error rates that are half those of companies sourcing individual parts, significantly improving production throughput. The demand for compact hydraulic fittings for mobile equipment continues to grow, pushing innovation in materials and design.
  • This focus on specialization is also evident in the need for custom hydraulic solutions for oems and high-impulse hydraulic hose applications. Ultimately, optimizing a hydraulic system's energy efficiency and understanding the hydraulic component lifecycle cost analysis are critical for maintaining a competitive edge.
  • Educating end-users through resources like a hydraulic fitting thread identification guide is crucial for ensuring proper maintenance and performance across sectors, from systems for renewable energy to vibration-resistant fittings for heavy machinery.

What are the key market drivers leading to the rise in the adoption of Hydraulic Fluid Connectors Industry?

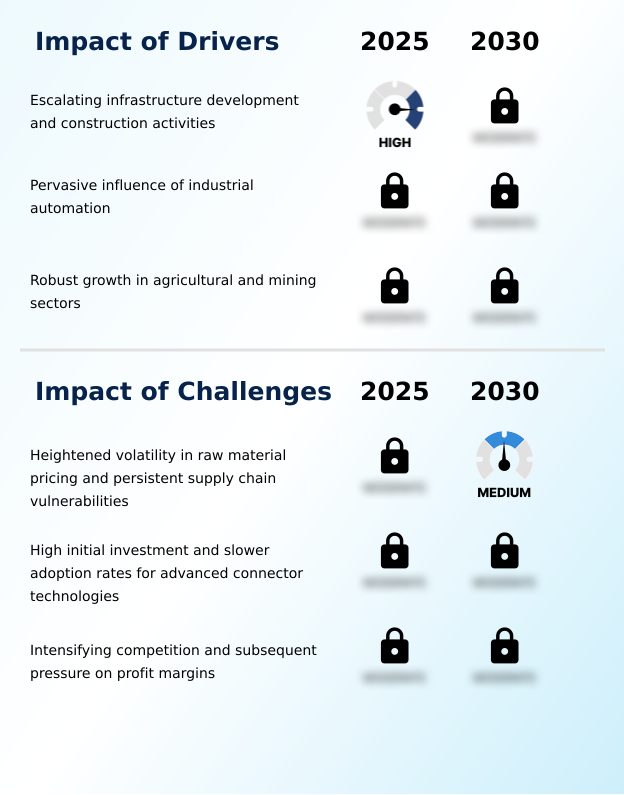
  • Escalating infrastructure development and a corresponding rise in construction activities are key drivers propelling market growth.

  • Market growth is fundamentally driven by expansion across key industrial sectors. Sustained investment in heavy construction equipment for global infrastructure projects creates continuous demand for robust fluid power components.
  • The pervasive influence of industrial automation has led to a 20% increase in the need for high-performance hydraulic actuator control systems in production line automation and automotive manufacturing robotics.
  • In parallel, the modernization of agriculture and mining stimulates demand for specialized machinery. Advanced agricultural machinery hydraulics, integral to precision agriculture technology, can improve crop yields by over 10%.
  • This mechanization trend, coupled with growth in the mining equipment systems sector, ensures a strong and growing need for reliable hydraulic connectors capable of functioning in demanding high-pressure applications and contributing to greater high-performance fluid power.

What are the market trends shaping the Hydraulic Fluid Connectors Industry?

  • The market is increasingly influenced by the proliferation of smart technologies. This includes deeper integration with Industry 4.0 principles, driving demand for intelligent components.

  • Key market trends are reshaping the performance and application of hydraulic fluid connectors. The integration of smart technologies is paramount, with predictive maintenance sensors enabling a reduction in unplanned machinery downtime by up to 30%.
  • This shift toward Industry 4.0 is complemented by a strong focus on sustainability, driving demand for biodegradable hydraulic fluids and components with advanced, leak-free sealing technology. Innovations in push-to-connect fittings and high-pressure quick disconnects are enhancing operational efficiency metrics in material handling equipment.
  • Concurrently, the use of advanced materials, such as lightweight alloy components and corrosion-resistant coatings, is critical for meeting the demands of aerospace fluid systems and subsea hydraulic systems, where both weight and durability are essential for performance and achieving a lower total cost of ownership.

What challenges does the Hydraulic Fluid Connectors Industry face during its growth?

  • Heightened volatility in raw material pricing, coupled with persistent supply chain vulnerabilities, presents a key challenge to industry growth.

  • The market faces several persistent challenges that impact profitability and operational planning. Heightened raw material price volatility, particularly for steel and specialized polymers, has caused 15-20% fluctuations in manufacturing costs, directly pressuring margins for aftermarket replacement parts. In tandem, supply chain vulnerabilities continue to pose a risk to production schedules.
  • The high initial investment required for advanced technologies, such as smart factory integration, presents a barrier for smaller enterprises, potentially extending the capital recovery period by up to two years.
  • Furthermore, intense competition among suppliers forces a focus on oem integration support and cost control, as pricing pressures limit the ability to pass on increased costs to end-users, especially in price-sensitive sectors.

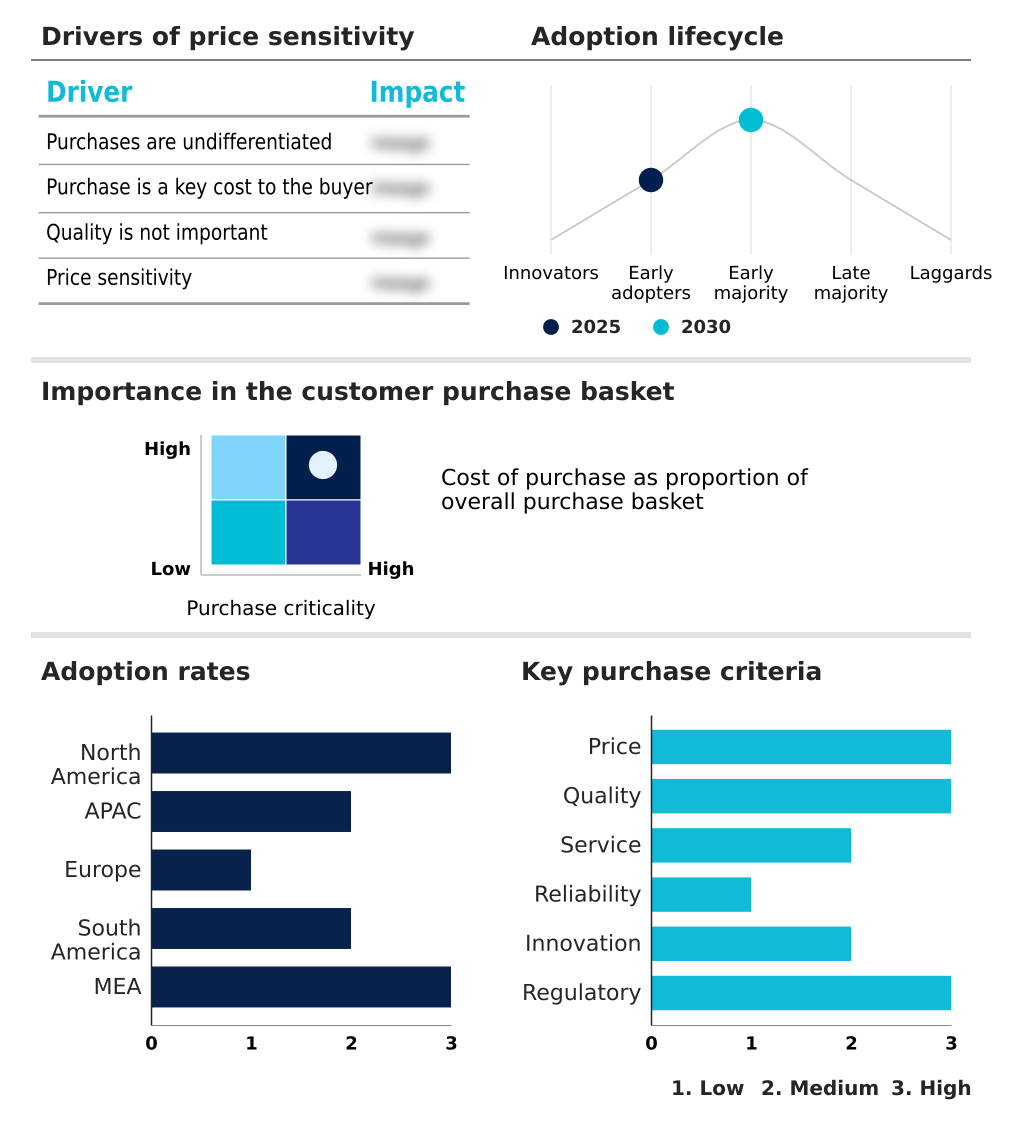
Exclusive Technavio Analysis on Customer Landscape

The hydraulic fluid connectors market forecasting report includes the adoption lifecycle of the market, covering from the innovator’s stage to the laggard’s stage. It focuses on adoption rates in different regions based on penetration. Furthermore, the hydraulic fluid connectors market report also includes key purchase criteria and drivers of price sensitivity to help companies evaluate and develop their market growth analysis strategies.

Customer Landscape of Hydraulic Fluid Connectors Industry

Competitive Landscape

Companies are implementing various strategies, such as strategic alliances, hydraulic fluid connectors market forecast, partnerships, mergers and acquisitions, geographical expansion, and product/service launches, to enhance their presence in the industry.

Aerocom Specialty Fittings Inc. - Specialized stainless steel fluid connectors, including custom assemblies, address high-pressure and corrosive environments in critical industrial and aerospace applications.

The industry research and growth report includes detailed analyses of the competitive landscape of the market and information about key companies, including:

  • Aerocom Specialty Fittings Inc.
  • Alfa Gomma S.p.A.
  • Bosch Rexroth AG
  • Eaton Corp. Plc
  • Gates Corp.
  • Kurt Manufacturing Co.
  • Manuli Hydraulics Group
  • Parker Hannifin Corp.
  • RG Industries Inc.
  • RW Connection
  • Ryco Hydraulics Pty. Ltd.
  • Smiths Group Plc
  • Staubli International
  • Stauffenberg GmbH and Co. KG
  • Swagelok Co.
  • VOSS Group

Qualitative and quantitative analysis of companies has been conducted to help clients understand the wider business environment as well as the strengths and weaknesses of key industry players. Data is qualitatively analyzed to categorize companies as pure play, category-focused, industry-focused, and diversified; it is quantitatively analyzed to categorize companies as dominant, leading, strong, tentative, and weak.

Recent Development and News in Hydraulic fluid connectors market

  • In August 2025, Parker Hannifin Corp. announced modifications to its compression union and female elbow fittings, a move designed to improve installation efficiency in compact industrial spaces.
  • In August 2025, Swagelok Co. introduced new components specifically designed for hydrogen refueling stations, addressing the growing needs of the clean energy sector with high-pressure fluid handling solutions.
  • In October 2024, the Manuli Ryco group announced the acquisition of Cardiff Hydraulics Ltd., a strategic move to strengthen its service and distribution capabilities in the United Kingdom.
  • In April 2025, an engine supply agreement was established between Kobelco Construction Machinery USA and both Yanmar and Isuzu to facilitate the construction of excavators within North America, signaling sustained demand for heavy machinery and their hydraulic systems.

Dive into Technavio’s robust research methodology, blending expert interviews, extensive data synthesis, and validated models for unparalleled Hydraulic Fluid Connectors Market insights. See full methodology.

Market Scope
Page number 307
Base year 2025
Historic period 2020-2024
Forecast period 2026-2030
Growth momentum & CAGR Accelerate at a CAGR of 6.1%
Market growth 2026-2030 USD 1957.8 million
Market structure Fragmented
YoY growth 2025-2026(%) 5.6%
Key countries US, Canada, Mexico, China, Japan, India, South Korea, Australia, Indonesia, Germany, France, UK, Italy, Spain, The Netherlands, Brazil, Argentina, Colombia, Saudi Arabia, UAE, Turkey, South Africa and Egypt
Competitive landscape Leading Companies, Market Positioning of Companies, Competitive Strategies, and Industry Risks

Request Free Sample

Research Analyst Overview

  • The hydraulic fluid connectors market ensures the integrity of fluid power transmission in critical industrial and mobile applications. Its performance is defined by components like din 2353 tube fittings, quick release coupling devices, and high-pressure hose assembly, which must meet stringent standards for reliability.
  • The adoption of advanced sealing technology has been shown to extend component service life by up to 40% in high-cycle industrial automation settings. The market's evolution is driven by material science, including the use of thermoplastic hydraulic hose and advanced rubber compounds, along with tools like the hydraulic hose crimper.
  • A key trend impacting boardroom-level strategy is the integration of iot-enabled hydraulic monitoring. The decision to invest in these smart systems, which enable predictive maintenance, represents a strategic trade-off between higher initial capital expenditure and long-term ROI from reduced downtime and enhanced hydraulic system integrity.
  • This shift towards intelligent, data-driven fluid conveyance systems is reshaping component design and selection criteria across all sectors.

What are the Key Data Covered in this Hydraulic Fluid Connectors Market Research and Growth Report?

  • What is the expected growth of the Hydraulic Fluid Connectors Market between 2026 and 2030?

    • USD 1.96 billion, at a CAGR of 6.1%

  • What segmentation does the market report cover?

    • The report is segmented by Product (Hydraulic hose, Coupling, Adaptors, and Others), Material (Steel, Stainless steel, Aluminum, Brass, and Others), Application (Manufacturing, Oil and gas, Automotive, and Others) and Geography (North America, APAC, Europe, South America, Middle East and Africa)

  • Which regions are analyzed in the report?

    • North America, APAC, Europe, South America and Middle East and Africa

  • What are the key growth drivers and market challenges?

    • Escalating infrastructure development and construction activities, Heightened volatility in raw material pricing and persistent supply chain vulnerabilities

  • Who are the major players in the Hydraulic Fluid Connectors Market?

    • Aerocom Specialty Fittings Inc., Alfa Gomma S.p.A., Bosch Rexroth AG, Eaton Corp. Plc, Gates Corp., Kurt Manufacturing Co., Manuli Hydraulics Group, Parker Hannifin Corp., RG Industries Inc., RW Connection, Ryco Hydraulics Pty. Ltd., Smiths Group Plc, Staubli International, Stauffenberg GmbH and Co. KG, Swagelok Co. and VOSS Group

Market Research Insights

  • The market's dynamics are shaped by relentless demands for higher operational efficiency and system reliability. The implementation of advanced connectors with non-spill characteristics can reduce fluid loss by over 90%, directly impacting environmental compliance standards and lowering operational costs.
  • In parallel, systems utilizing smart fittings with predictive maintenance analytics report a 25% reduction in unplanned downtime compared to those with reactive service schedules, a critical factor for industries focused on maximizing uptime. Furthermore, the adoption of lightweight alloy components in certain mobile hydraulic applications contributes to a 5-7% improvement in fuel efficiency, aligning with sustainability goals.
  • These measurable outcomes underscore the strategic importance of component selection in achieving a lower total cost of ownership and improving performance in high-pressure applications.

We can help! Our analysts can customize this hydraulic fluid connectors market research report to meet your requirements.

Get in touch

1. Executive Summary

1.1 Market overview

Executive Summary - Chart on Market Overview
Executive Summary - Data Table on Market Overview
Executive Summary - Chart on Global Market Characteristics
Executive Summary - Chart on Market by Geography
Executive Summary - Chart on Market Segmentation by Product
Executive Summary - Chart on Market Segmentation by Material
Executive Summary - Chart on Market Segmentation by Application
Executive Summary - Chart on Incremental Growth
Executive Summary - Data Table on Incremental Growth
Executive Summary - Chart on Company Market Positioning

2. Technavio Analysis

2.1 Analysis of price sensitivity, lifecycle, customer purchase basket, adoption rates, and purchase criteria

2.2 Criticality of inputs and Factors of differentiation

Chart on Overview on criticality of inputs and factors of differentiation

2.3 Factors of disruption

Chart on Overview on factors of disruption

2.4 Impact of drivers and challenges

Chart on Impact of drivers and challenges in 2025 and 2030

3. Market Landscape

3.1 Market ecosystem

Chart on Parent Market
Data Table on - Parent Market

3.2 Market characteristics

Chart on Market characteristics analysis

3.3 Value chain analysis

Chart on Value chain analysis

4. Market Sizing

4.1 Market definition

Data Table on Offerings of companies included in the market definition

4.2 Market segment analysis

Market segments

4.3 Market size 2025

4.4 Market outlook: Forecast for 2025-2030

Chart on Global - Market size and forecast 2025-2030 ($ million)
Data Table on Global - Market size and forecast 2025-2030 ($ million)
Chart on Global Market: Year-over-year growth 2025-2030 (%)
Data Table on Global Market: Year-over-year growth 2025-2030 (%)

5. Historic Market Size

5.1 Global Hydraulic Fluid Connectors Market 2020 - 2024

Historic Market Size - Data Table on Global Hydraulic Fluid Connectors Market 2020 - 2024 ($ million)

5.2 Product segment analysis 2020 - 2024

Historic Market Size - Product Segment 2020 - 2024 ($ million)

5.3 Material segment analysis 2020 - 2024

Historic Market Size - Material Segment 2020 - 2024 ($ million)

5.4 Application segment analysis 2020 - 2024

Historic Market Size - Application Segment 2020 - 2024 ($ million)

5.5 Geography segment analysis 2020 - 2024

Historic Market Size - Geography Segment 2020 - 2024 ($ million)

5.6 Country segment analysis 2020 - 2024

Historic Market Size - Country Segment 2020 - 2024 ($ million)

6. Qualitative Analysis

6.1 Impact of AI on Global Hydraulic Fluid Connectors Market

7. Five Forces Analysis

7.1 Five forces summary

Five forces analysis - Comparison between 2025 and 2030

7.2 Bargaining power of buyers

Bargaining power of buyers - Impact of key factors 2025 and 2030

7.3 Bargaining power of suppliers

Bargaining power of suppliers - Impact of key factors in 2025 and 2030

7.4 Threat of new entrants

Threat of new entrants - Impact of key factors in 2025 and 2030

7.5 Threat of substitutes

Threat of substitutes - Impact of key factors in 2025 and 2030

7.6 Threat of rivalry

Threat of rivalry - Impact of key factors in 2025 and 2030

7.7 Market condition

Chart on Market condition - Five forces 2025 and 2030

8. Market Segmentation by Product

8.1 Market segments

Chart on Product - Market share 2025-2030 (%)
Data Table on Product - Market share 2025-2030 (%)

8.2 Comparison by Product

Chart on Comparison by Product
Data Table on Comparison by Product

8.3 Hydraulic hose - Market size and forecast 2025-2030

Chart on Hydraulic hose - Market size and forecast 2025-2030 ($ million)
Data Table on Hydraulic hose - Market size and forecast 2025-2030 ($ million)
Chart on Hydraulic hose - Year-over-year growth 2025-2030 (%)
Data Table on Hydraulic hose - Year-over-year growth 2025-2030 (%)

8.4 Coupling - Market size and forecast 2025-2030

Chart on Coupling - Market size and forecast 2025-2030 ($ million)
Data Table on Coupling - Market size and forecast 2025-2030 ($ million)
Chart on Coupling - Year-over-year growth 2025-2030 (%)
Data Table on Coupling - Year-over-year growth 2025-2030 (%)

8.5 Adaptors - Market size and forecast 2025-2030

Chart on Adaptors - Market size and forecast 2025-2030 ($ million)
Data Table on Adaptors - Market size and forecast 2025-2030 ($ million)
Chart on Adaptors - Year-over-year growth 2025-2030 (%)
Data Table on Adaptors - Year-over-year growth 2025-2030 (%)

8.6 Others - Market size and forecast 2025-2030

Chart on Others - Market size and forecast 2025-2030 ($ million)
Data Table on Others - Market size and forecast 2025-2030 ($ million)
Chart on Others - Year-over-year growth 2025-2030 (%)
Data Table on Others - Year-over-year growth 2025-2030 (%)

8.7 Market opportunity by Product

Market opportunity by Product ($ million)
Data Table on Market opportunity by Product ($ million)

9. Market Segmentation by Material

9.1 Market segments

Chart on Material - Market share 2025-2030 (%)
Data Table on Material - Market share 2025-2030 (%)

9.2 Comparison by Material

Chart on Comparison by Material
Data Table on Comparison by Material

9.3 Steel - Market size and forecast 2025-2030

Chart on Steel - Market size and forecast 2025-2030 ($ million)
Data Table on Steel - Market size and forecast 2025-2030 ($ million)
Chart on Steel - Year-over-year growth 2025-2030 (%)
Data Table on Steel - Year-over-year growth 2025-2030 (%)

9.4 Stainless steel - Market size and forecast 2025-2030

Chart on Stainless steel - Market size and forecast 2025-2030 ($ million)
Data Table on Stainless steel - Market size and forecast 2025-2030 ($ million)
Chart on Stainless steel - Year-over-year growth 2025-2030 (%)
Data Table on Stainless steel - Year-over-year growth 2025-2030 (%)

9.5 Aluminum - Market size and forecast 2025-2030

Chart on Aluminum - Market size and forecast 2025-2030 ($ million)
Data Table on Aluminum - Market size and forecast 2025-2030 ($ million)
Chart on Aluminum - Year-over-year growth 2025-2030 (%)
Data Table on Aluminum - Year-over-year growth 2025-2030 (%)

9.6 Brass - Market size and forecast 2025-2030

Chart on Brass - Market size and forecast 2025-2030 ($ million)
Data Table on Brass - Market size and forecast 2025-2030 ($ million)
Chart on Brass - Year-over-year growth 2025-2030 (%)
Data Table on Brass - Year-over-year growth 2025-2030 (%)

9.7 Others - Market size and forecast 2025-2030

Chart on Others - Market size and forecast 2025-2030 ($ million)
Data Table on Others - Market size and forecast 2025-2030 ($ million)
Chart on Others - Year-over-year growth 2025-2030 (%)
Data Table on Others - Year-over-year growth 2025-2030 (%)

9.8 Market opportunity by Material

Market opportunity by Material ($ million)
Data Table on Market opportunity by Material ($ million)

10. Market Segmentation by Application

10.1 Market segments

Chart on Application - Market share 2025-2030 (%)
Data Table on Application - Market share 2025-2030 (%)

10.2 Comparison by Application

Chart on Comparison by Application
Data Table on Comparison by Application

10.3 Manufacturing - Market size and forecast 2025-2030

Chart on Manufacturing - Market size and forecast 2025-2030 ($ million)
Data Table on Manufacturing - Market size and forecast 2025-2030 ($ million)
Chart on Manufacturing - Year-over-year growth 2025-2030 (%)
Data Table on Manufacturing - Year-over-year growth 2025-2030 (%)

10.4 Oil and gas - Market size and forecast 2025-2030

Chart on Oil and gas - Market size and forecast 2025-2030 ($ million)
Data Table on Oil and gas - Market size and forecast 2025-2030 ($ million)
Chart on Oil and gas - Year-over-year growth 2025-2030 (%)
Data Table on Oil and gas - Year-over-year growth 2025-2030 (%)

10.5 Automotive - Market size and forecast 2025-2030

Chart on Automotive - Market size and forecast 2025-2030 ($ million)
Data Table on Automotive - Market size and forecast 2025-2030 ($ million)
Chart on Automotive - Year-over-year growth 2025-2030 (%)
Data Table on Automotive - Year-over-year growth 2025-2030 (%)

10.6 Others - Market size and forecast 2025-2030

Chart on Others - Market size and forecast 2025-2030 ($ million)
Data Table on Others - Market size and forecast 2025-2030 ($ million)
Chart on Others - Year-over-year growth 2025-2030 (%)
Data Table on Others - Year-over-year growth 2025-2030 (%)

10.7 Market opportunity by Application

Market opportunity by Application ($ million)
Data Table on Market opportunity by Application ($ million)

11. Customer Landscape

11.1 Customer landscape overview

Analysis of price sensitivity, lifecycle, customer purchase basket, adoption rates, and purchase criteria

12. Geographic Landscape

12.1 Geographic segmentation

Chart on Market share by geography 2025-2030 (%)
Data Table on Market share by geography 2025-2030 (%)

12.2 Geographic comparison

Chart on Geographic comparison
Data Table on Geographic comparison

12.3 North America - Market size and forecast 2025-2030

Chart on North America - Market size and forecast 2025-2030 ($ million)
Data Table on North America - Market size and forecast 2025-2030 ($ million)
Chart on North America - Year-over-year growth 2025-2030 (%)
Data Table on North America - Year-over-year growth 2025-2030 (%)
Chart on Regional Comparison - North America
Data Table on Regional Comparison - North America

12.3.1 US - Market size and forecast 2025-2030

Chart on US - Market size and forecast 2025-2030 ($ million)
Data Table on US - Market size and forecast 2025-2030 ($ million)
Chart on US - Year-over-year growth 2025-2030 (%)
Data Table on US - Year-over-year growth 2025-2030 (%)

12.3.2 Canada - Market size and forecast 2025-2030

Chart on Canada - Market size and forecast 2025-2030 ($ million)
Data Table on Canada - Market size and forecast 2025-2030 ($ million)
Chart on Canada - Year-over-year growth 2025-2030 (%)
Data Table on Canada - Year-over-year growth 2025-2030 (%)

12.3.3 Mexico - Market size and forecast 2025-2030

Chart on Mexico - Market size and forecast 2025-2030 ($ million)
Data Table on Mexico - Market size and forecast 2025-2030 ($ million)
Chart on Mexico - Year-over-year growth 2025-2030 (%)
Data Table on Mexico - Year-over-year growth 2025-2030 (%)

12.4 APAC - Market size and forecast 2025-2030

Chart on APAC - Market size and forecast 2025-2030 ($ million)
Data Table on APAC - Market size and forecast 2025-2030 ($ million)
Chart on APAC - Year-over-year growth 2025-2030 (%)
Data Table on APAC - Year-over-year growth 2025-2030 (%)
Chart on Regional Comparison - APAC
Data Table on Regional Comparison - APAC

12.4.1 China - Market size and forecast 2025-2030

Chart on China - Market size and forecast 2025-2030 ($ million)
Data Table on China - Market size and forecast 2025-2030 ($ million)
Chart on China - Year-over-year growth 2025-2030 (%)
Data Table on China - Year-over-year growth 2025-2030 (%)

12.4.2 Japan - Market size and forecast 2025-2030

Chart on Japan - Market size and forecast 2025-2030 ($ million)
Data Table on Japan - Market size and forecast 2025-2030 ($ million)
Chart on Japan - Year-over-year growth 2025-2030 (%)
Data Table on Japan - Year-over-year growth 2025-2030 (%)

12.4.3 India - Market size and forecast 2025-2030

Chart on India - Market size and forecast 2025-2030 ($ million)
Data Table on India - Market size and forecast 2025-2030 ($ million)
Chart on India - Year-over-year growth 2025-2030 (%)
Data Table on India - Year-over-year growth 2025-2030 (%)

12.4.4 South Korea - Market size and forecast 2025-2030

Chart on South Korea - Market size and forecast 2025-2030 ($ million)
Data Table on South Korea - Market size and forecast 2025-2030 ($ million)
Chart on South Korea - Year-over-year growth 2025-2030 (%)
Data Table on South Korea - Year-over-year growth 2025-2030 (%)

12.4.5 Australia - Market size and forecast 2025-2030

Chart on Australia - Market size and forecast 2025-2030 ($ million)
Data Table on Australia - Market size and forecast 2025-2030 ($ million)
Chart on Australia - Year-over-year growth 2025-2030 (%)
Data Table on Australia - Year-over-year growth 2025-2030 (%)

12.4.6 Indonesia - Market size and forecast 2025-2030

Chart on Indonesia - Market size and forecast 2025-2030 ($ million)
Data Table on Indonesia - Market size and forecast 2025-2030 ($ million)
Chart on Indonesia - Year-over-year growth 2025-2030 (%)
Data Table on Indonesia - Year-over-year growth 2025-2030 (%)

12.5 Europe - Market size and forecast 2025-2030

Chart on Europe - Market size and forecast 2025-2030 ($ million)
Data Table on Europe - Market size and forecast 2025-2030 ($ million)
Chart on Europe - Year-over-year growth 2025-2030 (%)
Data Table on Europe - Year-over-year growth 2025-2030 (%)
Chart on Regional Comparison - Europe
Data Table on Regional Comparison - Europe

12.5.1 Germany - Market size and forecast 2025-2030

Chart on Germany - Market size and forecast 2025-2030 ($ million)
Data Table on Germany - Market size and forecast 2025-2030 ($ million)
Chart on Germany - Year-over-year growth 2025-2030 (%)
Data Table on Germany - Year-over-year growth 2025-2030 (%)

12.5.2 France - Market size and forecast 2025-2030

Chart on France - Market size and forecast 2025-2030 ($ million)
Data Table on France - Market size and forecast 2025-2030 ($ million)
Chart on France - Year-over-year growth 2025-2030 (%)
Data Table on France - Year-over-year growth 2025-2030 (%)

12.5.3 UK - Market size and forecast 2025-2030

Chart on UK - Market size and forecast 2025-2030 ($ million)
Data Table on UK - Market size and forecast 2025-2030 ($ million)
Chart on UK - Year-over-year growth 2025-2030 (%)
Data Table on UK - Year-over-year growth 2025-2030 (%)

12.5.4 Italy - Market size and forecast 2025-2030

Chart on Italy - Market size and forecast 2025-2030 ($ million)
Data Table on Italy - Market size and forecast 2025-2030 ($ million)
Chart on Italy - Year-over-year growth 2025-2030 (%)
Data Table on Italy - Year-over-year growth 2025-2030 (%)

12.5.5 Spain - Market size and forecast 2025-2030

Chart on Spain - Market size and forecast 2025-2030 ($ million)
Data Table on Spain - Market size and forecast 2025-2030 ($ million)
Chart on Spain - Year-over-year growth 2025-2030 (%)
Data Table on Spain - Year-over-year growth 2025-2030 (%)

12.5.6 The Netherlands - Market size and forecast 2025-2030

Chart on The Netherlands - Market size and forecast 2025-2030 ($ million)
Data Table on The Netherlands - Market size and forecast 2025-2030 ($ million)
Chart on The Netherlands - Year-over-year growth 2025-2030 (%)
Data Table on The Netherlands - Year-over-year growth 2025-2030 (%)

12.6 South America - Market size and forecast 2025-2030

Chart on South America - Market size and forecast 2025-2030 ($ million)
Data Table on South America - Market size and forecast 2025-2030 ($ million)
Chart on South America - Year-over-year growth 2025-2030 (%)
Data Table on South America - Year-over-year growth 2025-2030 (%)
Chart on Regional Comparison - South America
Data Table on Regional Comparison - South America

12.6.1 Brazil - Market size and forecast 2025-2030

Chart on Brazil - Market size and forecast 2025-2030 ($ million)
Data Table on Brazil - Market size and forecast 2025-2030 ($ million)
Chart on Brazil - Year-over-year growth 2025-2030 (%)
Data Table on Brazil - Year-over-year growth 2025-2030 (%)

12.6.2 Argentina - Market size and forecast 2025-2030

Chart on Argentina - Market size and forecast 2025-2030 ($ million)
Data Table on Argentina - Market size and forecast 2025-2030 ($ million)
Chart on Argentina - Year-over-year growth 2025-2030 (%)
Data Table on Argentina - Year-over-year growth 2025-2030 (%)

12.6.3 Colombia - Market size and forecast 2025-2030

Chart on Colombia - Market size and forecast 2025-2030 ($ million)
Data Table on Colombia - Market size and forecast 2025-2030 ($ million)
Chart on Colombia - Year-over-year growth 2025-2030 (%)
Data Table on Colombia - Year-over-year growth 2025-2030 (%)

12.7 Middle East and Africa - Market size and forecast 2025-2030

Chart on Middle East and Africa - Market size and forecast 2025-2030 ($ million)
Data Table on Middle East and Africa - Market size and forecast 2025-2030 ($ million)
Chart on Middle East and Africa - Year-over-year growth 2025-2030 (%)
Data Table on Middle East and Africa - Year-over-year growth 2025-2030 (%)
Chart on Regional Comparison - Middle East and Africa
Data Table on Regional Comparison - Middle East and Africa

12.7.1 Saudi Arabia - Market size and forecast 2025-2030

Chart on Saudi Arabia - Market size and forecast 2025-2030 ($ million)
Data Table on Saudi Arabia - Market size and forecast 2025-2030 ($ million)
Chart on Saudi Arabia - Year-over-year growth 2025-2030 (%)
Data Table on Saudi Arabia - Year-over-year growth 2025-2030 (%)

12.7.2 UAE - Market size and forecast 2025-2030

Chart on UAE - Market size and forecast 2025-2030 ($ million)
Data Table on UAE - Market size and forecast 2025-2030 ($ million)
Chart on UAE - Year-over-year growth 2025-2030 (%)
Data Table on UAE - Year-over-year growth 2025-2030 (%)

12.7.3 Turkey - Market size and forecast 2025-2030

Chart on Turkey - Market size and forecast 2025-2030 ($ million)
Data Table on Turkey - Market size and forecast 2025-2030 ($ million)
Chart on Turkey - Year-over-year growth 2025-2030 (%)
Data Table on Turkey - Year-over-year growth 2025-2030 (%)

12.7.4 South Africa - Market size and forecast 2025-2030

Chart on South Africa - Market size and forecast 2025-2030 ($ million)
Data Table on South Africa - Market size and forecast 2025-2030 ($ million)
Chart on South Africa - Year-over-year growth 2025-2030 (%)
Data Table on South Africa - Year-over-year growth 2025-2030 (%)

12.7.5 Egypt - Market size and forecast 2025-2030

Chart on Egypt - Market size and forecast 2025-2030 ($ million)
Data Table on Egypt - Market size and forecast 2025-2030 ($ million)
Chart on Egypt - Year-over-year growth 2025-2030 (%)
Data Table on Egypt - Year-over-year growth 2025-2030 (%)

12.8 Market opportunity by geography

Market opportunity by geography ($ million)
Data Tables on Market opportunity by geography ($ million)

13. Drivers, Challenges, and Opportunity

13.1 Market drivers

Escalating infrastructure development and construction activities
Pervasive influence of industrial automation
Robust growth in agricultural and mining sectors

13.2 Market challenges

Heightened volatility in raw material pricing and persistent supply chain vulnerabilities
High initial investment and slower adoption rates for advanced connector technologies
Intensifying competition and subsequent pressure on profit margins

13.3 Impact of drivers and challenges

Impact of drivers and challenges in 2025 and 2030

13.4 Market opportunities

Proliferation of smart technologies and industry 4.0 integration
Heightened focus on sustainability and environmental compliance
Innovations in advanced materials and high performance design

14. Competitive Landscape

14.1 Overview

14.2

Overview on criticality of inputs and factors of differentiation

14.3 Landscape disruption

Overview on factors of disruption

14.4 Industry risks

Impact of key risks on business

15. Competitive Analysis

15.1 Companies profiled

Companies covered

15.2 Company ranking index

15.3 Market positioning of companies

Matrix on companies position and classification

15.4 Aerocom Specialty Fittings Inc.

Aerocom Specialty Fittings Inc. - Overview
Aerocom Specialty Fittings Inc. - Product / Service
Aerocom Specialty Fittings Inc. - Key offerings
SWOT

15.5 Alfa Gomma S.p.A.

Alfa Gomma S.p.A. - Overview
Alfa Gomma S.p.A. - Product / Service
Alfa Gomma S.p.A. - Key offerings
SWOT

15.6 Bosch Rexroth AG

Bosch Rexroth AG - Overview
Bosch Rexroth AG - Product / Service
Bosch Rexroth AG - Key offerings
SWOT

15.7 Eaton Corp. Plc

Eaton Corp. Plc - Overview
Eaton Corp. Plc - Business segments
Eaton Corp. Plc - Key news
Eaton Corp. Plc - Key offerings
Eaton Corp. Plc - Segment focus
SWOT

15.8 Gates Corp.

Gates Corp. - Overview
Gates Corp. - Business segments
Gates Corp. - Key offerings
Gates Corp. - Segment focus
SWOT

15.9 Kurt Manufacturing Co.

Kurt Manufacturing Co. - Overview
Kurt Manufacturing Co. - Product / Service
Kurt Manufacturing Co. - Key offerings
SWOT

15.10 Manuli Hydraulics Group

Manuli Hydraulics Group - Overview
Manuli Hydraulics Group - Product / Service
Manuli Hydraulics Group - Key offerings
SWOT

15.11 Parker Hannifin Corp.

Parker Hannifin Corp. - Overview
Parker Hannifin Corp. - Business segments
Parker Hannifin Corp. - Key offerings
Parker Hannifin Corp. - Segment focus
SWOT

15.12 RG Industries Inc.

RG Industries Inc. - Overview
RG Industries Inc. - Product / Service
RG Industries Inc. - Key offerings
SWOT

15.13 RW Connection

RW Connection - Overview
RW Connection - Product / Service
RW Connection - Key offerings
SWOT

15.14 Ryco Hydraulics Pty. Ltd.

Ryco Hydraulics Pty. Ltd. - Overview
Ryco Hydraulics Pty. Ltd. - Product / Service
Ryco Hydraulics Pty. Ltd. - Key offerings
SWOT

15.15 Smiths Group Plc

Smiths Group Plc - Overview
Smiths Group Plc - Business segments
Smiths Group Plc - Key news
Smiths Group Plc - Key offerings
Smiths Group Plc - Segment focus
SWOT

15.16 Staubli International

Staubli International - Overview
Staubli International - Product / Service
Staubli International - Key offerings
SWOT

15.17 Stauffenberg GmbH and Co. KG

Stauffenberg GmbH and Co. KG - Overview
Stauffenberg GmbH and Co. KG - Product / Service
Stauffenberg GmbH and Co. KG - Key offerings
SWOT

15.18 VOSS Group

VOSS Group - Overview
VOSS Group - Product / Service
VOSS Group - Key offerings
SWOT

16. Appendix

16.1 Scope of the report

Market definition
Objectives
Notes and caveats

16.2 Inclusions and exclusions checklist

Inclusions checklist
Exclusions checklist

16.3 Currency conversion rates for US$

16.4 Research methodology

16.5 Data procurement

Information sources

16.6 Data validation

16.7 Validation techniques employed for market sizing

16.8 Data synthesis

16.9 360 degree market analysis

16.10 List of abbreviations

Research Methodology

Technavio presents a detailed picture of the market by way of study, synthesis, and summation of data from multiple sources. The analysts have presented the various facets of the market with a particular focus on identifying the key industry influencers. The data thus presented is comprehensive, reliable, and the result of extensive research, both primary and secondary.

INFORMATION SOURCES

Primary sources

  • Manufacturers and suppliers
  • Channel partners
  • Industry experts
  • Strategic decision makers

Secondary sources

  • Industry journals and periodicals
  • Government data
  • Financial reports of key industry players
  • Historical data
  • Press releases

DATA ANALYSIS

Data Synthesis

  • Collation of data
  • Estimation of key figures
  • Analysis of derived insights

Data Validation

  • Triangulation with data models
  • Reference against proprietary databases
  • Corroboration with industry experts

REPORT WRITING

Qualitative

  • Market drivers
  • Market challenges
  • Market trends
  • Five forces analysis

Quantitative

  • Market size and forecast
  • Market segmentation
  • Geographical insights
  • Competitive landscape

Interested in this report?

Get your sample now to see our research methodology and insights!

Download Now

Frequently Asked Questions

Hydraulic Fluid Connectors market growth will increase by USD 1957.8 million during 2026-2030 .

The Hydraulic Fluid Connectors market is expected to grow at a CAGR of 6.1% during 2026-2030 .

Hydraulic Fluid Connectors market is segmented by Product (Hydraulic hose, Coupling, Adaptors, Others) Material (Steel, Stainless steel, Aluminum, Brass, Others) Application (Manufacturing, Oil and gas, Automotive, Others)

Aerocom Specialty Fittings Inc., Alfa Gomma S.p.A., Bosch Rexroth AG, Eaton Corp. Plc, Gates Corp., Kurt Manufacturing Co., Manuli Hydraulics Group, Parker Hannifin Corp., RG Industries Inc., RW Connection, Ryco Hydraulics Pty. Ltd., Smiths Group Plc, Staubli International, Stauffenberg GmbH and Co. KG, Swagelok Co., VOSS Group are a few of the key vendors in the Hydraulic Fluid Connectors market.

APAC will register the highest growth rate of 36.6% among the other regions. Therefore, the Hydraulic Fluid Connectors market in APAC is expected to garner significant business opportunities for the vendors during the forecast period.

US, Canada, Mexico, China, Japan, India, South Korea, Australia, Indonesia, Germany, France, UK, Italy, Spain, The Netherlands, Brazil, Argentina, Colombia, Saudi Arabia, UAE, Turkey, South Africa, Egypt

  • Escalating infrastructure development and construction activities is the driving factor this market.

The Hydraulic Fluid Connectors market vendors should focus on grabbing business opportunities from the Product segment as it accounted for the largest market share in the base year.