
Connectors Market Size 2025-2029
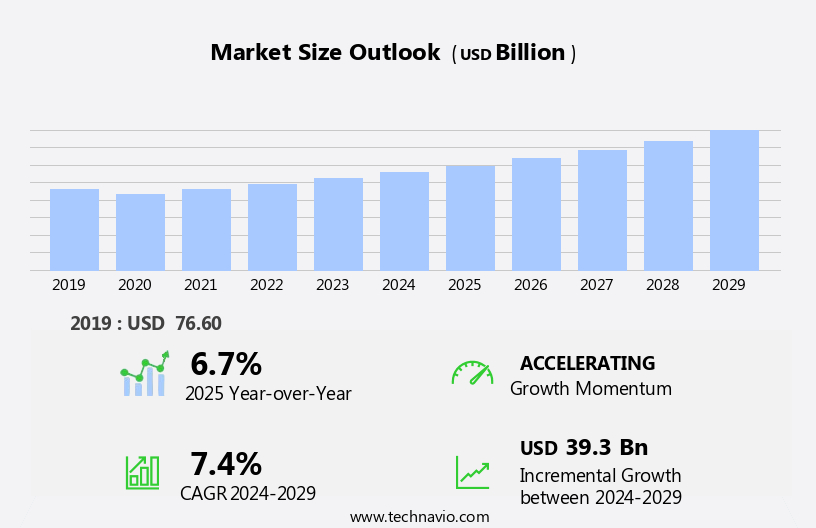
The connectors market size is forecast to increase by USD 39.3 billion at a CAGR of 7.4% between 2024 and 2029.
- The market is experiencing significant growth, driven by the miniaturization trend in electronic devices and the increasing adoption of automotive electronics. The demand for smaller, more efficient connectors is escalating as technology advances and consumers seek more compact, portable devices. In the automotive sector, the proliferation of advanced driver assistance systems (ADAS) and electric vehicles (EVs) is fueling the need for robust, reliable connectors to support these complex systems. However, challenges persist in the market. Additionally, the emergence of 5G technology networks is expected to fuel market growth, as these networks require advanced connectors to support high-speed data transfer and low latency. Regulatory hurdles impact adoption, particularly in the automotive sector, where stringent safety standards necessitate rigorous testing and certification processes. Additionally, supply chain inconsistencies temper growth potential as demand for specific connector types fluctuates, necessitating agile supply chain management strategies.
- To capitalize on market opportunities and navigate these challenges effectively, companies must focus on innovation, regulatory compliance, and supply chain resilience. By investing in research and development to create smaller, more reliable connectors, and collaborating with regulatory bodies to streamline certification processes, market participants can stay competitive and meet the evolving needs of their customers. The demand for connectors in telecommunications is driven by the increasing use of RCA cables and quick connectors in smartphones and electrical appliances. The telecommunications sector's shift towards 5G technology is also fueling the growth of the connector market. The connector market caters to diverse applications, including radar equipment, infotainment systems in vehicles, and electronic components in electric vehicles.
What will be the Size of the Connectors Market during the forecast period?
- The market encompasses a diverse range of products, including crimp connectors, wire-to-wire connectors, D-sub connectors, miniature connectors, rectangular connectors, modular connectors, BNC connectors, screw-type connectors, N connectors, SMA connectors, coaxial connectors, M8 connectors, solder connectors, M17 connectors, PCB connectors, HDMI connectors, and various customization options. Market trends indicate a growing demand for smaller, more efficient connectors, such as M12 connectors and micro connectors, as well as waterproof and circular connectors for outdoor applications. Additionally, connector customization and modular designs are gaining popularity in the industry. The automotive industry is witnessing significant growth in the use of connectors, driven by advancements in automotive technologies like autonomous vehicles, electric vehicles, and sophisticated cruise controls. Terminal blocks, Din connectors, wire-to-board connectors, M23 connectors, USB connectors, and push-pull connectors are also integral components of the market.
- Overall, the market is dynamic and evolving, with a focus on miniaturization, durability, and versatility.
How is this Connectors Industry segmented?
The connectors industry research report provides comprehensive data (region-wise segment analysis), with forecasts and estimates in "USD billion" for the period 2025-2029, as well as historical data from 2019-2023 for the following segments.
- End-user
- Automotive
- IT
- Telecom or datacom
- Others
- Type
- PCB connectors
- I/O rectangular
- Application-specific
- Others
- Material
- Copper
- Aluminum
- Plastic
- Stainless steel
- Others
- Geography
- North America
- US
- Canada
- Europe
- France
- Germany
- Italy
- UK
- APAC
- Australia
- China
- India
- Japan
- Rest of World (ROW)
- North America
By End-user Insights
The automotive segment is estimated to witness significant growth during the forecast period. The connector market encompasses a diverse range of applications, from consumer electronics to industrial and automotive sectors. Interoperability is a significant factor driving the connector industry, with the need for seamless compatibility between various devices and systems. In consumer electronics, the demand for smaller, more advanced devices has led to the development of miniaturized connectors, such as USB-C and Lightning connectors. Customization is another key trend, with connector manufacturers offering bespoke solutions for specific applications. In the industrial sector, electrical and power connectors are essential components in various applications, including renewable energy systems, data centers, and manufacturing plants. The OSI model's physical interface layer requires strong and reliable connectors for seamless data transfer. Safety and security are crucial factors in the connector market, especially in applications such as airbags and GPS navigation systems. The focus on reliability, durability, and safety is paramount, with high-performance connectors and advanced plating technologies playing a crucial role.
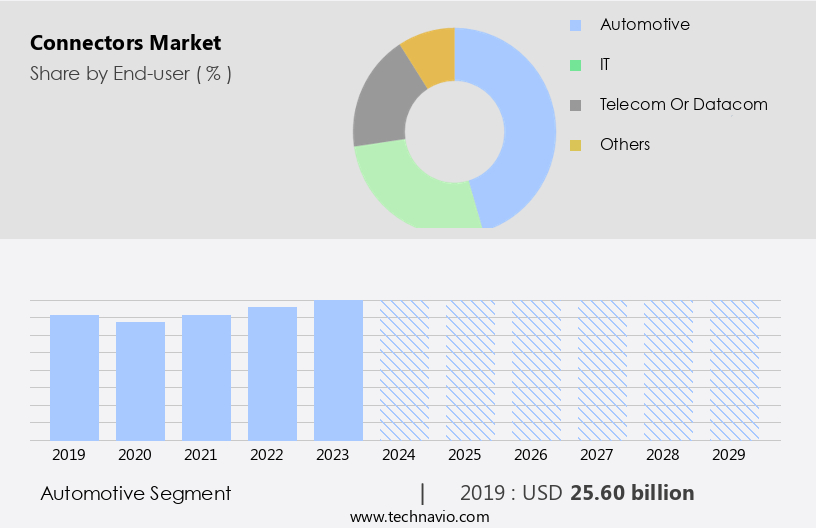
The Automotive segment was valued at USD 25.60 billion in 2019 and showed a gradual increase during the forecast period. Industrial connectors must also meet stringent standards, such as UL, IEC, and IP ratings. In the automotive sector, the use of connectors is expected to witness steady growth due to the increasing adoption of advanced technologies, such as driverless cars, EVs, and high-tech cruise controls. The need for reliable, standard, and affordable connectors is essential to ensure the smooth functioning of these systems. The miniaturization of automotive devices, such as audio controls, ABS, and navigation systems, has been made possible by advancements in micro connectors and intelligent bus technologies. High-voltage connectors and shielding are also critical in the automotive sector, ensuring the safety and efficiency of electrical systems. Connector suppliers offer a range of services, from design and manufacturing to testing and certification. The market for connectors is continuously evolving, with new innovations and advancements in materials, manufacturing processes, and design. Connector certification and sealing technologies are essential to ensure the reliability and durability of connectors in various applications. Overall, the connector market is a dynamic and innovative industry, with a focus on meeting the unique needs of various sectors and applications.
Regional Analysis
APAC is estimated to contribute 56% to the growth of the global market during the forecast period. Technavio's analysts have elaborately explained the regional trends and drivers that shape the market during the forecast period.
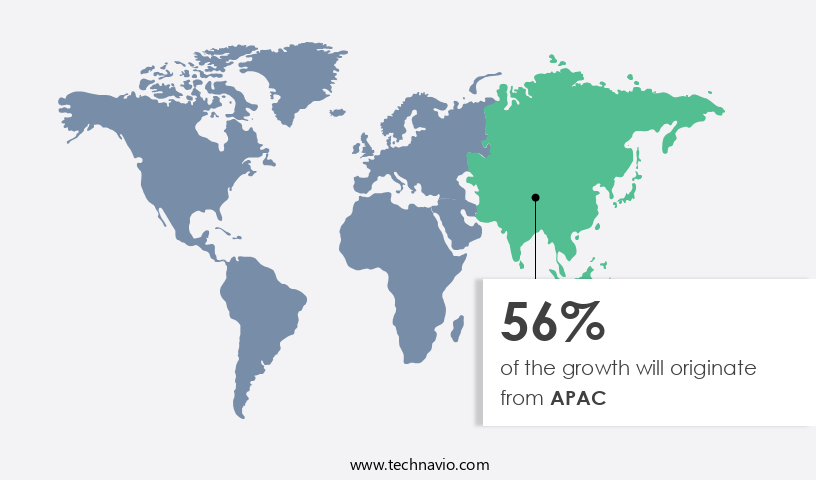
The market in Asia Pacific (APAC) is experiencing significant growth, driven by developing economies such as China and India. China, a major connector manufacturing hub, plays a pivotal role in the global connectors industry. Urbanization and industrialization in these countries are fueling economic transformation, leading to increased demand for various connector types. Automotive, consumer electronics, and communication networks are among the sectors witnessing substantial growth. For instance, China's Gross National Income (GNI) per capita in 2023 was approximately USD 12,000, indicating rising purchasing power. This trend is propelling the demand for advanced connector solutions, including fiber optic connectors, electrical connectors, power connectors, and high-speed connectors.
Customization, reliability, and compatibility are key focus areas for connector design and manufacturing. Connector suppliers are also investing in innovation, such as connector plating, shielding, and certification, to cater to diverse applications. The market is further influenced by trends like connector integration, durability, and cable assembly solutions. Military, aerospace, and industrial sectors are also significant consumers of connectors. Despite the challenges, the market is expected to continue its growth trajectory, driven by technological advancements and evolving industry requirements.
Market Dynamics
Our researchers analyzed the data with 2024 as the base year, along with the key drivers, trends, and challenges. A holistic analysis of drivers will help companies refine their marketing strategies to gain a competitive advantage.
What are the Connectors market drivers leading to the rise in the adoption of Industry?
- The miniaturization of electronic devices serves as a primary catalyst for market growth. The connector market has experienced significant growth due to the advancements in technology and the increasing demand for compact, reliable electronic devices. The miniaturization of electronic devices has been a key trend in the industry, driven by the need to reduce raw material costs and the increasing requirement for smaller assemblies in various applications. This trend has been particularly notable in the areas of fiber optic connectors and consumer electronics connectors. Connector manufacturing has evolved to meet the demands of this market, with a focus on connector customization, interoperability, and high performance. Connector design has become increasingly sophisticated, with an emphasis on connector contacts and connector manufacturing processes that can accommodate the smaller form factors of modern electronic devices.
- Electrical connectors and power connectors continue to play a crucial role in the functionality and reliability of electronic devices. The performance of these connectors is a critical consideration, with factors such as current carrying capacity, voltage rating, and temperature resistance all important considerations. Connector distributors have emerged as key players in the market, providing a vital link between connector manufacturers and end users. They offer a wide range of connectors, ensuring that customers have access to the right connector for their specific application. With the ongoing technological advancements and the increasing demand for compact, reliable electronic devices, the connector market is expected to continue its growth trajectory.
What are the Connectors market trends shaping the Industry?
- The trend in the automotive industry is shifting towards the increased adoption of electronics. This development is driven by advancements in technology and the growing demand for enhanced vehicle features and improved performance. The market is witnessing significant growth due to the increasing adoption of connectors in various automotive electronic applications. Connectors play a crucial role in enabling seamless communication and power transfer between different components in automobiles, including navigation, steering, brake, and cruise control systems. With the rise of advanced electronic systems such as driver assistance, audio controls, cruise control, diagnostic, and infotainment systems, the demand for connectors has surged. Furthermore, stringent government regulations on carbon emissions have fueled the use of emission sensors, which in turn, necessitates the use of reliable connectors.
- Connector solutions must adhere to various standards for compatibility and reliability to ensure optimal performance in harsh automotive environments. Innovations in connector technologies, such as advanced plating techniques and high-voltage connector designs, are driving the market forward. Cable assemblies and connector housings are integral components of these connector solutions, ensuring efficient and secure connectivity.
How does Connectors market faces challenges face during its growth?
- The connectors' reliability and durability concerns represent a significant challenge to the industry's expansion, as these issues can negatively impact product performance and consumer trust. The market faces challenges related to reliability and durability due to various field conditions. Connectors are susceptible to damage from voltage fluctuations, temperature extremes, and mechanical forces. Additionally, connector failures such as broken latches, separation of mating joints, and overheating can occur without external causes, often due to poor design. These issues pose significant risks, not only to the safety of the connected device but also to the end user. Reliability and durability concerns are major hurdles for the market. Voltage surges, temperature variations, and mechanical stresses can compromise connector performance and lead to failure. Moreover, design flaws can result in issues such as latches breaking, mating joints separating, or overheating due to misalignments.
- These problems not only impact the functionality and safety of the connected devices but also put the end user at risk. Connector suppliers are addressing these challenges by implementing advanced technologies such as connector shielding, which protects against electromagnetic interference and voltage surges. Medical connectors, signal connectors, automotive connectors, and low-voltage connectors are also being developed with enhanced mechanical designs and materials to improve durability and reliability. Additionally, connector testing is becoming increasingly important to ensure the quality and performance of connectors before they are used in applications. Connector trends include the development of more compact, lightweight, and high-performance connectors for various industries, including medical, automotive, and telecommunications. Mechanical connectors and wire harnesses are also being designed to be more robust and resilient to harsh environments. As the demand for reliable and durable connectors continues to grow, connector suppliers are investing in research and development to meet the evolving needs of their customers.
Exclusive Customer Landscape
The connectors market forecasting report includes the adoption lifecycle of the market, covering from the innovator's stage to the laggard's stage. It focuses on adoption rates in different regions based on penetration. Furthermore, the connectors market report also includes key purchase criteria and drivers of price sensitivity to help companies evaluate and develop their market growth analysis strategies.

Customer Landscape
Key Companies & Market Insights
Companies are implementing various strategies, such as strategic alliances, connectors market forecast, partnerships, mergers and acquisitions, geographical expansion, and product/service launches, to enhance their presence in the industry.
3M Co. - This company specializes in providing industrial-grade connectors for various applications.
The industry research and growth report includes detailed analyses of the competitive landscape of the market and information about key companies, including:
- 3M Co.
- ABB Ltd.
- ALLIED ELECTRONICS CORP.
- AMETEK Inc.
- Amphenol Corp.
- Aptiv Plc
- Elcom International Pvt. Ltd.
- HIROSE ELECTRIC Co. Ltd.
- Hon Hai Precision Industry Co. Ltd.
- Huawei Technologies Co. Ltd.
- J.S.T. MFG. Co. Ltd.
- Japan Aviation Electronics Industry Ltd.
- Luxshare Precision Industry Co. Ltd.
- METZ CONNECT GmbH
- Molex LLC
- Nexans SA
- Prysmian SpA
- Rosenberger Hochfrequenztechnik GmbH and Co. KG
- TE Connectivity Ltd.
- Yazaki Corp.
Qualitative and quantitative analysis of companies has been conducted to help clients understand the wider business environment as well as the strengths and weaknesses of key industry players. Data is qualitatively analyzed to categorize companies as pure play, category-focused, industry-focused, and diversified; it is quantitatively analyzed to categorize companies as dominant, leading, strong, tentative, and weak.
Recent Development and News in Connectors Market
- In February 2024, TE Connectivity, a leading connector manufacturer, announced the launch of their new high-speed USB Type-C connector series, designed to support data transfer rates of up to 40Gbps and power delivery up to 100W (TE Connectivity Press Release, 2024). This new product development addresses the growing demand for faster and more powerful connectivity solutions in various industries, including consumer electronics and automotive.
- In September 2024, Amphenol Corporation completed the acquisition of CTS Corporation, a leading supplier of connector and sensor solutions, for approximately USD 3.8 billion (Amphenol Corporation Press Release, 2024). This acquisition significantly expanded Amphenol's product portfolio and broadened its customer base, enabling the company to cater to a wider range of industries and applications.
- In March 2025, the European Union announced the adoption of the European Chip Act, a USD 48.10 billion initiative to boost Europe's semiconductor industry and reduce its reliance on imports (European Commission, 2025). This policy change is expected to create new opportunities for connector manufacturers, as the production of advanced semiconductors requires sophisticated interconnect solutions.
Research Analyst Overview
The connector market continues to evolve, driven by advancements in technology and the expanding application scope across various sectors. Fiber optic connectors, electrical connectors, and high-voltage connectors are integral components in telecommunications, consumer electronics, and power transmission systems, respectively. The need for connector customization and compatibility is paramount, as industries demand solutions tailored to their specific requirements. Connector design and manufacturing processes are continually refined, with an emphasis on reliability and performance. Connector housings, cable assemblies, and connector advancements play a crucial role in ensuring seamless integration and functionality. Innovation is a constant theme, with ongoing developments in connector plating, shielding, and certification.
Connector applications span industries, from medical and automotive to military and aerospace. Each sector poses unique challenges, necessitating specialized connector solutions. Connector compatibility and durability are essential factors in connector selection. Connector testing and certification processes ensure the highest standards of quality and safety. Market trends reflect a growing focus on connector integration, with an increasing demand for wire harnesses and connector services. The future of the connector market promises continued dynamism and innovation.
Dive into Technavio's strong research methodology, blending expert interviews, extensive data synthesis, and validated models for unparalleled Connectors Market insights. See full methodology.
|
Market Scope |
|
|
Report Coverage |
Details |
|
Page number |
236 |
|
Base year |
2024 |
|
Historic period |
2019-2023 |
|
Forecast period |
2025-2029 |
|
Growth momentum & CAGR |
Accelerate at a CAGR of 7.4% |
|
Market growth 2025-2029 |
USD 39.3 billion |
|
Market structure |
Fragmented |
|
YoY growth 2024-2025(%) |
6.7 |
|
Key countries |
China, US, Japan, India, Germany, UK, Australia, Canada, Italy, and France |
|
Competitive landscape |
Leading Companies, Market Positioning of Companies, Competitive Strategies, and Industry Risks |
What are the Key Data Covered in this Connectors Market Research and Growth Report?
- CAGR of the Connectors industry during the forecast period
- Detailed information on factors that will drive the growth and forecasting between 2025 and 2029
- Precise estimation of the size of the market and its contribution of the industry in focus to the parent market
- Accurate predictions about upcoming growth and trends and changes in consumer behaviour
- Growth of the market across APAC, Europe, North America, South America, and Middle East and Africa
- Thorough analysis of the market's competitive landscape and detailed information about companies
- Comprehensive analysis of factors that will challenge the connectors market growth of industry companies
We can help! Our analysts can customize this connectors market research report to meet your requirements.
 RIA -
RIA - 
