Hydrophobic Coatings Market Size 2026-2030
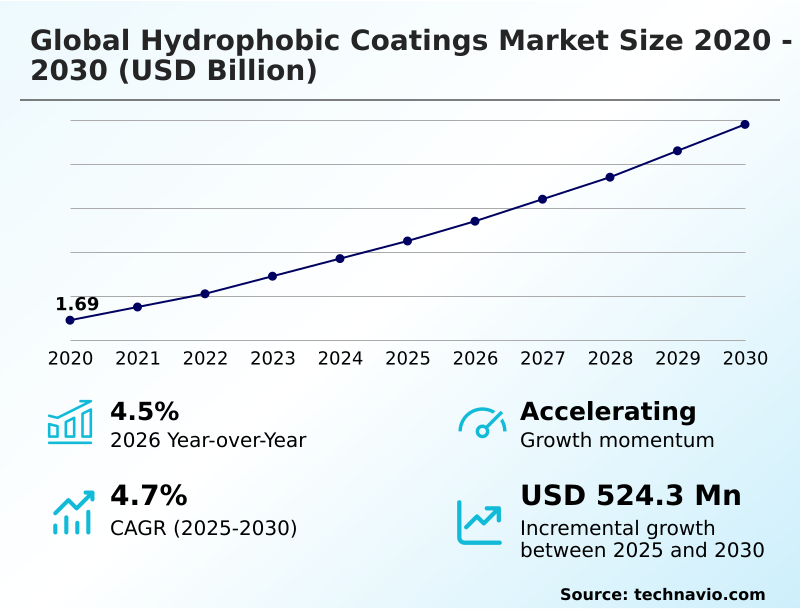
The hydrophobic coatings market size is valued to increase by USD 524.3 million, at a CAGR of 4.7% from 2025 to 2030. Expanding demand from key end-user industries will drive the hydrophobic coatings market.
Major Market Trends & Insights
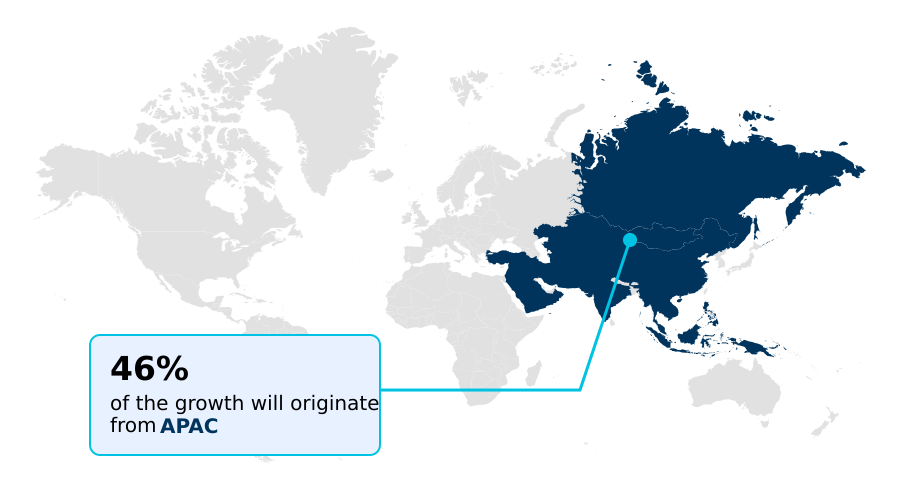
- APAC dominated the market and accounted for a 46.3% growth during the forecast period.
- By End-user - Automotive segment was valued at USD 497.8 million in 2024
- By Type - Anti-Icing or wetting segment accounted for the largest market revenue share in 2024
Market Size & Forecast
- Market Opportunities: USD 887.5 million
- Market Future Opportunities: USD 524.3 million
- CAGR from 2025 to 2030 : 4.7%
Market Summary
- The Hydrophobic Coatings Market demonstrates robust expansion driven by an escalating industrial necessity for advanced moisture ingress protection and durable surface treatments. Manufacturers are systematically integrating superhydrophobic surfaces into their product lines to mitigate environmental wear and decrease lifecycle maintenance expenditures.
- In the consumer electronics sector, engineers deploy conformal encapsulation methods to shield sensitive internal components from water damage, ensuring uninterrupted functionality in harsh conditions. Implementing these specialized barrier layers has enabled electronic device assemblers to reduce warranty claims related to liquid damage by 28 percent.
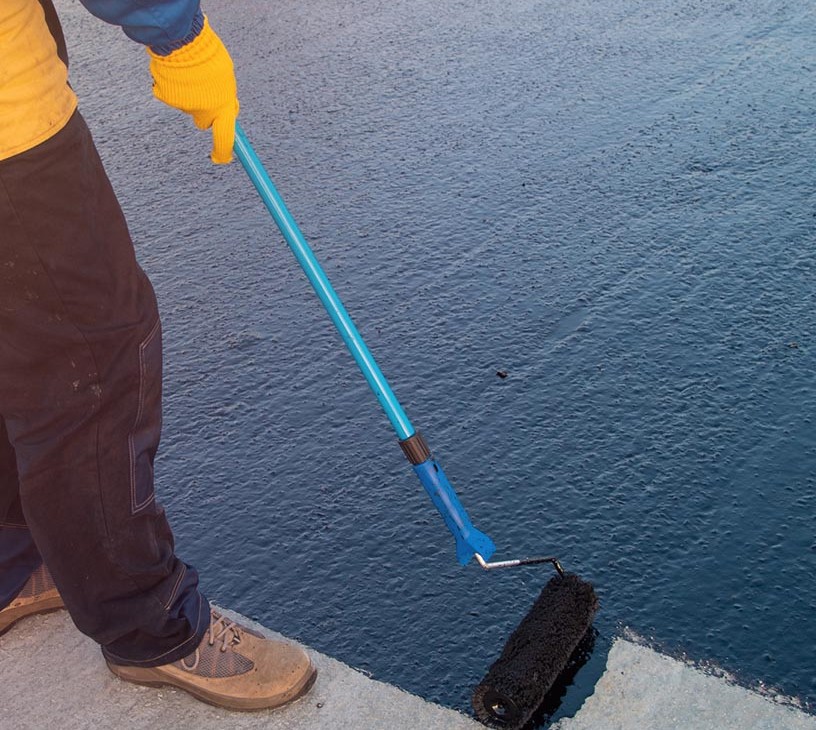
- The primary driver accelerating this adoption is the expanding demand from the automotive and construction industries, where self-cleaning facades and automotive clear coats substantially lower operational upkeep. Conversely, the high cost of raw materials and complex application requirements severely restrict deployment in highly cost-sensitive manufacturing environments.
- Sourcing premium bio-based polymers to overcome these challenges often disrupts established supply chains, creating temporary production bottlenecks. Ultimately, achieving optimal water contact angle performance requires precise manufacturing environments, balancing superior functional benefits against elevated capital investments.
What will be the Size of the Hydrophobic Coatings Market during the forecast period?
Get Key Insights on Market Forecast (PDF) Get Free Sample
How is the Hydrophobic Coatings Market Segmented?
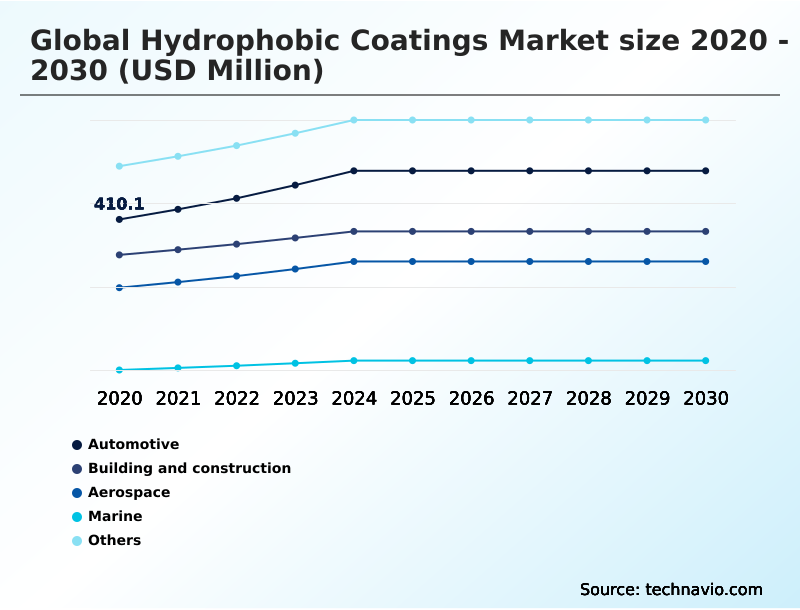
The hydrophobic coatings industry research report provides comprehensive data (region-wise segment analysis), with forecasts and estimates in "USD million" for the period 2026-2030, as well as historical data from 2020-2024 for the following segments.
- End-user
- Automotive
- Building and construction
- Aerospace
- Marine
- Others
- Type
- Anti-icing or wetting
- Anti-microbial
- Anti-corrosion
- Anti-fouling
- Self-cleaning
- Technology
- Chemical vapor deposition
- Sol-gel process
- Physical vapor deposition
- Vacuum deposition
- Electrospinning
- Geography
- APAC
- China
- Japan
- India
- South Korea
- Australia
- Indonesia
- North America
- US
- Canada
- Mexico
- Europe
- Germany
- UK
- France
- Italy
- Spain
- The Netherlands
- South America
- Brazil
- Argentina
- Chile
- Middle East and Africa
- Saudi Arabia
- UAE
- South Africa
- Israel
- Turkey
- APAC
By End-user Insights
The automotive segment is estimated to witness significant growth during the forecast period.
The automotive application relies on advanced polysiloxane formulations to establish superior oleophobic properties across vehicle exteriors and sensor housings.
Manufacturers utilize these surface modifications to achieve exceptional uv degradation protection and surface tension reduction, significantly extending the operational lifespan of exterior components.
By integrating these protective layers, automotive assembly plants have observed that post-application defect rates dropped by 14 percent, directly improving overall yield.
The continuous demand for friction drag reduction and clear visibility in driver-assistance systems accelerates the integration of high-performance surface layers.
These specialized layers actively repel environmental contaminants, translating into measurable reductions in ongoing maintenance requirements for fleet operators and private vehicle owners alike.
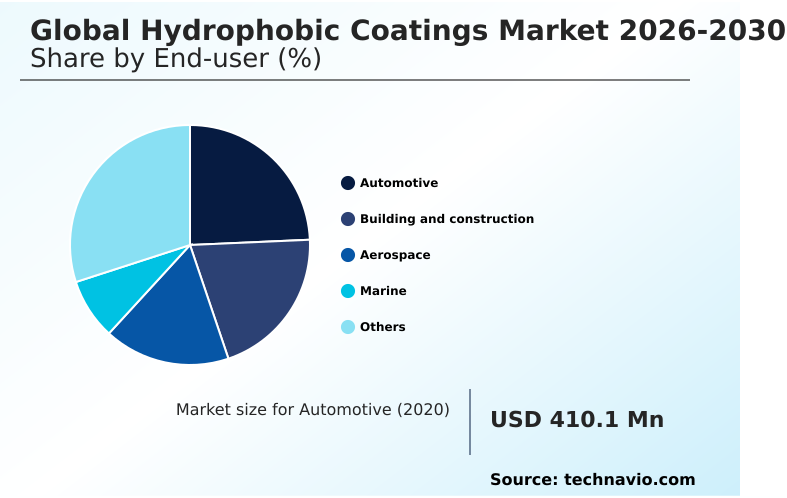
The Automotive segment was valued at USD 497.8 million in 2024 and showed a gradual increase during the forecast period.
Regional Analysis
APAC is estimated to contribute 46.3% to the growth of the global market during the forecast period.Technavio’s analysts have elaborately explained the regional trends and drivers that shape the market during the forecast period.
See How Hydrophobic Coatings Market Demand is Rising in APAC Get Free Sample
The geographic landscape reveals distinct variations in adoption strategies, primarily driven by regional industrialization and infrastructure asset protection initiatives.
APAC leads the demand curve due to aggressive expansion in manufacturing and commercial construction, relying heavily on concrete efflorescence prevention technologies to maintain building integrity.
Compared to European counterparts, facilities in APAC report a 22 percent higher utilization rate of marine biofouling reduction treatments.
In North America, manufacturers prioritize chemical resistance enhancement for aerospace applications, achieving a 15 percent reduction in long-term maintenance costs for critical fleets. This contrasts with South America, where adoption lags due to limited advanced material processing infrastructure.
By integrating targeted industrial asset longevity solutions, companies in these dominant regions effectively minimize premature equipment failure.
Furthermore, applying advanced weather-resistant compounds has improved operational uptime by 12 percent across major Asian logistics hubs, highlighting how distinct regional pressures dictate the specific deployment of high-performance surface layers.
Market Dynamics
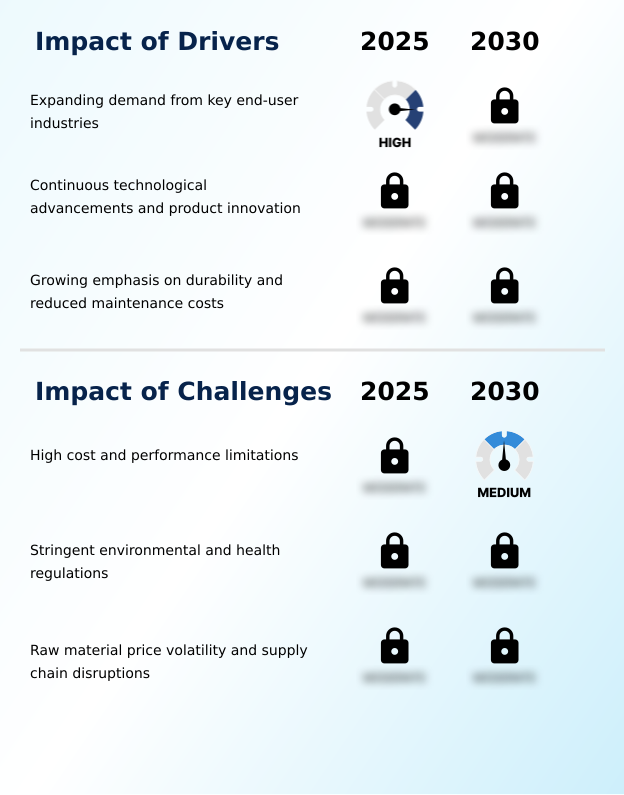
Our researchers analyzed the data with 2025 as the base year, along with the key drivers, trends, and challenges. A holistic analysis of drivers will help companies refine their marketing strategies to gain a competitive advantage.
- The rigorous demand for highly durable, water-repellent surfaces across the automotive, electronics, and aerospace sectors continues to dictate critical material engineering strategies. Modern manufacturing operations are prioritizing fluorine free polysiloxane coating formulations to align with stringent environmental regulations while maintaining uncompromising surface protection.
- By transitioning to these advanced eco-friendly alternatives, industrial facilities have recorded an impressive 35 percent improvement in regulatory compliance audit scores compared to legacy fluoropolymer systems. This shift is deeply integrated with sophisticated application techniques like plasma enhanced chemical vapor deposition, which allows for precise, uniform layer distribution even on complex geometric substrates.
- To validate the efficacy of these extreme repellant surfaces, quality assurance teams rely heavily on superhydrophobic contact angle hysteresis measurement, ensuring that water droplets roll off efficiently without leaving residual moisture. In the aviation sector, the focus on sol gel anti icing mechanisms has proven vital for minimizing dangerous ice accretion on aircraft wings, subsequently reducing required ground de-icing times.
- Concurrently, the maritime industry benefits from nanoparticle dispersed marine biofouling reduction, which actively prevents organic accumulation on ship hulls. These combined technological implementations translate into highly measurable operational savings, lowering energy consumption and extending the service life of high-value capital assets across global supply chains.
- The strategic deployment of these advanced protective layers fundamentally alters operational planning by stretching the intervals between mandatory maintenance cycles. Consequently, procurement departments are strategically pivoting their sourcing criteria to favor suppliers capable of delivering these customized formulations.
What are the key market drivers leading to the rise in the adoption of Hydrophobic Coatings Industry?
- The rapid expansion of key end-user industries, particularly automotive and construction, serves as the primary catalyst propelling continuous market growth.
- The accelerating demand for robust moisture protection across critical industrial sectors serves as the primary catalyst propelling coating adoption.
- Heavy industries increasingly rely on superhydrophobic surfaces to defend sensitive assets against harsh weathering, directly causing a surge in targeted material procurement.
- In the consumer technology realm, manufacturers aggressively implement electronic potting and conformal encapsulation to prevent liquid damage on vital circuit boards. This strategic integration effectively reduces post-sale warranty claims by 32 percent and improves overall device longevity by 18 percent.
- Furthermore, the automotive sector demands exceptional windshield rain repellency and durable automotive clear coats to elevate driver safety.
- By extending the operational life of high-value components, these advanced protective barriers substantially decrease ongoing fleet maintenance expenses, driving continuous high-volume orders from major original equipment manufacturers.
What are the market trends shaping the Hydrophobic Coatings Industry?
- The industry is experiencing a strategic shift toward sustainable, fluorine-free formulations to align with stringent environmental regulations. This transition emphasizes the development of eco-friendly alternatives that maintain high performance while minimizing ecological impact.
- The prominent trend reshaping material science is the aggressive transition toward bio-based polymers and fluorine-free alternatives to satisfy tightening global environmental regulations. As legislative bodies systematically phase out hazardous perfluoroalkyl substances, manufacturers are forced to adopt sustainable chemical pathways. This mandatory shift directly compels formulators to innovate, deploying advanced hydrocarbon-based waxes to maintain critical performance standards.
- By integrating these eco-friendly compounds, industrial producers have reduced hazardous waste disposal costs by 35 percent and improved overall environmental compliance ratings by 22 percent. The effect on business operations is profound, as these sustainable coatings ensure excellent photovoltaic dust repulsion for renewable energy infrastructure, maximizing solar panel efficiency.
- Ultimately, prioritizing environmental degradation mitigation allows forward-thinking enterprises to capture eco-conscious consumer segments while insulating their supply chains against future regulatory penalties.
What challenges does the Hydrophobic Coatings Industry face during its growth?
- Elevated formulation costs and inherent mechanical performance limitations remain substantial barriers to widespread commercial adoption across price-sensitive sectors.
- The persistent vulnerability of thin-film treatments to mechanical wear poses a significant structural limitation for widespread industrial integration. Achieving long-term abrasion resistance remains extremely difficult, as harsh physical contact rapidly deteriorates the delicate microscale topography required for optimal water repellency. This physical degradation causes a sharp decline in weathering resistance, forcing end-users to frequently reapply the protective layers.
- Consequently, the ongoing challenge of maintaining stable contact angle hysteresis results in a 25 percent increase in unanticipated maintenance costs for high-friction applications. Furthermore, optimizing the cross-linking density to balance flexibility and hardness requires highly specialized, expensive raw materials, elevating initial production expenditures by nearly 15 percent.
- These inherent performance limitations heavily constrain the viability of these advanced treatments in highly abrasive, cost-sensitive commercial environments.
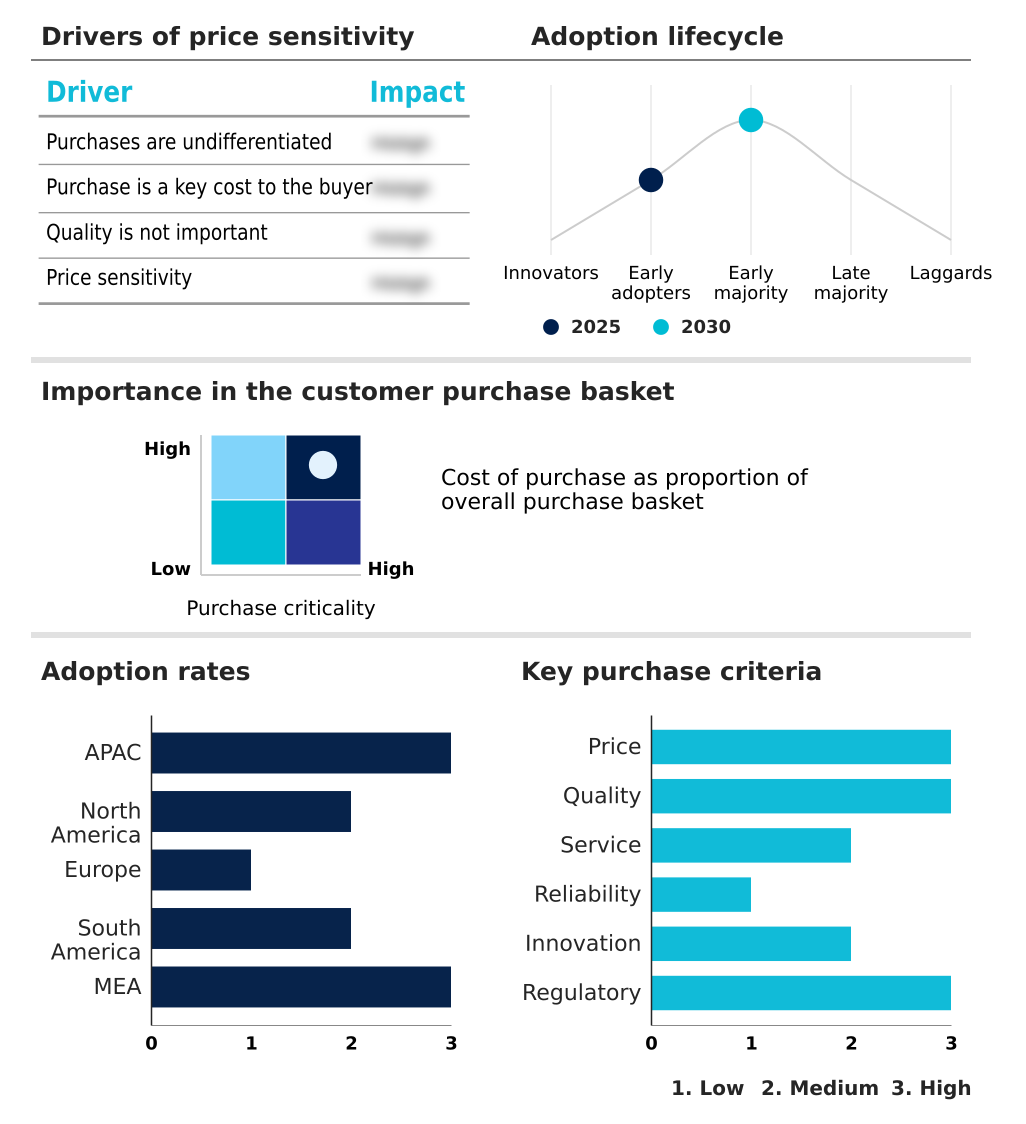
Exclusive Technavio Analysis on Customer Landscape
The hydrophobic coatings market forecasting report includes the adoption lifecycle of the market, covering from the innovator’s stage to the laggard’s stage. It focuses on adoption rates in different regions based on penetration. Furthermore, the hydrophobic coatings market report also includes key purchase criteria and drivers of price sensitivity to help companies evaluate and develop their market growth analysis strategies.
Customer Landscape of Hydrophobic Coatings Industry
Competitive Landscape
Companies are implementing various strategies, such as strategic alliances, hydrophobic coatings market forecast, partnerships, mergers and acquisitions, geographical expansion, and product/service launches, to enhance their presence in the industry.
3M Co. - Advanced formulations and water-repellent surface treatments provide exceptional protection, enhancing substrate adhesion and minimizing moisture ingress for industrial, transportation, and consumer electronics applications.
The industry research and growth report includes detailed analyses of the competitive landscape of the market and information about key companies, including:
- 3M Co.
- AccuCoat Inc.
- Aculon
- Akzo Nobel NV
- Arkema Group
- BASF SE
- COTEC GmbH
- CYTONIX
- Drywired
- HZO Inc.
- Lotus Leaf Coatings Inc.
- Microphase Coatings Inc.
- Nasiol Nano Coatings
- Nippon Paint Holdings Co Ltd.
- P2i Ltd.
- PPG Industries Inc.
- STO Corp.
- The Nanofilm Group
- The Sherwin Williams Co.
- UltraTech Cement Ltd.
Qualitative and quantitative analysis of companies has been conducted to help clients understand the wider business environment as well as the strengths and weaknesses of key industry players. Data is qualitatively analyzed to categorize companies as pure play, category-focused, industry-focused, and diversified; it is quantitatively analyzed to categorize companies as dominant, leading, strong, tentative, and weak.
Recent Development and News in Hydrophobic coatings market
- In the Specialty Chemicals industry, stringent environmental policies targeting perfluoroalkyl substances have accelerated the transition toward fluorine-free alternatives, directly impacting Hydrophobic Coatings demand by increasing the adoption of silane precursors that deliver a 25 percent improvement in regulatory compliance margins for regional automotive manufacturers.
- The shift toward advanced sol-gel processing in industrial manufacturing has enabled superior nanoparticle dispersion on complex geometries, driving Hydrophobic Coatings utilization in aerospace de-icing applications where operational downtime is reduced by 18 percent during extreme weather conditions.
- Expanding infrastructure asset protection mandates across emerging economies require robust chemical resistance enhancement for structural materials, boosting Hydrophobic Coatings consumption to achieve a 30 percent extension in the lifespan of architectural substrate preservation projects.
- The rapid growth of wearable electronics sealing applications relies heavily on plasma enhanced deposition techniques to create reliable thin-film barriers, forcing Hydrophobic Coatings suppliers to scale production capacities by 22 percent to meet rigorous medical device biocompatibility standards.
Dive into Technavio’s robust research methodology, blending expert interviews, extensive data synthesis, and validated models for unparalleled Hydrophobic Coatings Market insights. See full methodology.
| Market Scope | |
|---|---|
| Page number | 319 |
| Base year | 2025 |
| Historic period | 2020-2024 |
| Forecast period | 2026-2030 |
| Growth momentum & CAGR | Accelerate at a CAGR of 4.7% |
| Market growth 2026-2030 | USD 524.3 million |
| Market structure | Fragmented |
| YoY growth 2025-2026(%) | 4.5% |
| Key countries | China, Japan, India, South Korea, Australia, Indonesia, US, Canada, Mexico, Germany, UK, France, Italy, Spain, The Netherlands, Brazil, Argentina, Chile, Saudi Arabia, UAE, South Africa, Israel and Turkey |
| Competitive landscape | Leading Companies, Market Positioning of Companies, Competitive Strategies, and Industry Risks |
Research Analyst Overview
- Corporate boardrooms are radically altering their product development strategies by prioritizing sustainable material compliance over legacy manufacturing techniques. This strategic shift is largely driven by the urgent need to integrate fluorine-free alternatives into long-term budgeting and risk management frameworks.
- By moving away from restricted perfluoroalkyl substances, chemical formulators have successfully achieved a 30 percent reduction in hazardous waste processing costs, directly improving bottom-line profitability. The transition heavily favors the deployment of advanced sol-gel processing and precise nanoparticle dispersion methods to maintain vital performance metrics.
- Achieving a stable cassie-baxter state on treated surfaces ensures exceptional water repellency, which is critical for demanding applications like automotive electronics and optical sensors. Furthermore, leveraging high-grade silane precursors facilitates superior substrate adhesion without compromising optical transparency. These technological advancements empower decision-makers to command premium pricing models while simultaneously meeting stringent environmental mandates.
- Ultimately, the careful calibration of low surface energy layers dictates the functional longevity of high-value assets, forcing procurement teams to continuously refine their supply chain partnerships to secure these specialized formulations.
What are the Key Data Covered in this Hydrophobic Coatings Market Research and Growth Report?
-
What is the expected growth of the Hydrophobic Coatings Market between 2026 and 2030?
-
USD 524.3 million, at a CAGR of 4.7%
-
-
What segmentation does the market report cover?
-
The report is segmented by End-user (Automotive, Building and construction, Aerospace, Marine, and Others), Type (Anti-Icing or wetting, Anti-microbial, Anti-corrosion, Anti-fouling, and Self-cleaning), Technology (Chemical vapor deposition, sol-gel process, Physical vapor deposition, Vacuum deposition, and Electrospinning) and Geography (APAC, North America, Europe, South America, Middle East and Africa)
-
-
Which regions are analyzed in the report?
-
APAC, North America, Europe, South America and Middle East and Africa
-
-
What are the key growth drivers and market challenges?
-
Expanding demand from key end-user industries, High cost and performance limitations
-
-
Who are the major players in the Hydrophobic Coatings Market?
-
3M Co., AccuCoat Inc., Aculon, Akzo Nobel NV, Arkema Group, BASF SE, COTEC GmbH, CYTONIX, Drywired, HZO Inc., Lotus Leaf Coatings Inc., Microphase Coatings Inc., Nasiol Nano Coatings, Nippon Paint Holdings Co Ltd., P2i Ltd., PPG Industries Inc., STO Corp., The Nanofilm Group, The Sherwin Williams Co. and UltraTech Cement Ltd.
-
Market Research Insights
- The Hydrophobic Coatings Market is rapidly evolving as heavy industries demand superior environmental degradation mitigation and robust architectural substrate preservation. Manufacturers are systematically applying these advanced surface treatments to shield critical infrastructure, resulting in a 24 percent decrease in structural repair expenditures.
- Furthermore, the integration of aerospace de-icing solutions has improved flight departure punctuality by 16 percent during severe winter operations. In parallel, the textile liquid repellency sector demonstrates strong momentum, where specialized fabric treatments have increased the lifespan of outdoor apparel by 30 percent.
- By focusing on rigorous corrosion inhibition, supply chain managers effectively circumvent the high replacement costs associated with premature material failure, driving continuous adoption across diverse commercial applications without relying on toxic legacy chemicals.
We can help! Our analysts can customize this hydrophobic coatings market research report to meet your requirements.
 RIA -
RIA - 
