Hydroponic Nutrients Market Size 2024-2028
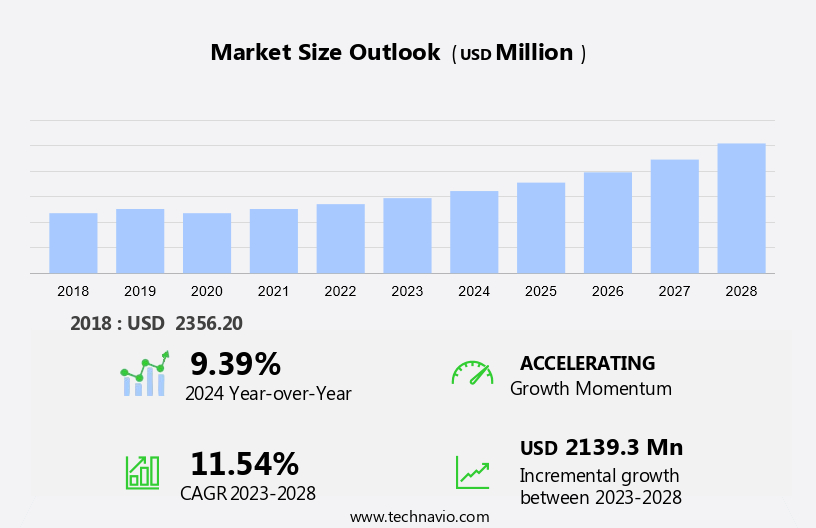
The hydroponic nutrients market size is forecast to increase by USD 2.14 billion, at a CAGR of 11.54% between 2023 and 2028.
- The market is experiencing significant growth due to several key trends. The reduction in arable land and the increasing scarcity of water resources are driving the demand for hydroponic farming as it requires less land and water compared to traditional farming methods. Another trend is the growing application of hydroponics in vertical farming, which is becoming increasingly popular due to its space-saving advantages and ability to produce crops year-round. This market caters to a diverse range of clients, including farmers, home gardeners, professional growers, restaurants, and greenhouse operations. However, the availability of traditional farming practices and the high initial investment required for setting up hydroponic systems remain challenges for market growth. Overall, the market is expected to witness steady growth In the coming years as more farmers adopt this sustainable and efficient farming method.
What will be the Size of the Hydroponic Nutrients Market During the Forecast Period?
- The market encompasses the production and distribution of nutrients essential for soil-less agriculture, primarily consisting of nitrogenous, phosphatic, and potassic compounds, as well as micronutrients. Hydroponic nutrients are used to cultivate various crops, such as tomatoes, cucumbers, and even cannabis, in a controlled environment, enabling higher yields and productivity. The market's growth is driven by several factors, including the increasing demand for nutritionally superior vegetables, indoor cultivation in response to climatic changes, and the operational simplicity and cost-effectiveness of hydroponic agriculture compared to traditional farming methods.
- Additionally, the use of polymer hydrogel films and advanced nutrient delivery systems further enhances the market's appeal. However, the market faces challenges such as installation costs and the need for precise nutrient management. The integration of synthetic and organic nutrient solutions, as well as the reduction of reliance on pesticides and artificial ripening agents, represents ongoing trends In the hydroponics market.
How is this Hydroponic Nutrients Industry segmented and which is the largest segment?
The hydroponic nutrients industry research report provides comprehensive data (region-wise segment analysis), with forecasts and estimates in "USD billion" for the period 2024-2028, as well as historical data from 2018-2022 for the following segments.
- Type
- Macronutrients
- Micronutrients
- Geography
- APAC
- India
- Japan
- North America
- US
- Europe
- South America
- Middle East and Africa
- APAC
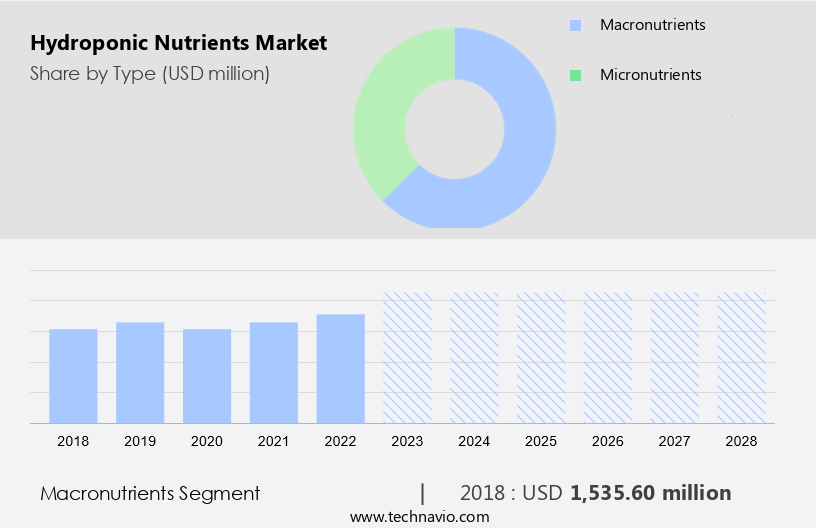
By Type Insights
- The macronutrients segment is estimated to witness significant growth during the forecast period. The market is primarily driven by the demand for macronutrients, which constitute the largest market share. Macronutrients, including carbon, hydrogen, oxygen, nitrogen (N), phosphorus (P), and potassium (K), are essential for plant growth and metabolism. Nitrogen, for instance, plays a crucial role in cell multiplication and protein synthesis, while phosphorus is vital for energy transfer and photosynthesis. The high consumption of these nutrients, which make up over 90% of a plant's dry weight, fuels market growth. Hydroponic farming, which excludes the use of soil, has gained popularity due to climate changes, water scarcity, and the need for higher yields and productivity.
- Hydroponic systems, such as nutrient film technique, deep water culture, and aggregate systems, use mineral solutions to supply plants with essential nutrients. These systems require advanced infrastructure, including HVAC systems, fans, ventilation, irrigation systems, control systems, rails, lights, and sensing technologies. Market players include companies offering organic and synthetic nutrients, such as Advanced Nutrients, Nutrifield, and others. The market is expected to grow in urban areas due to the increasing demand for locally grown, nutritionally superior vegetables, fruits, and berries. Installation costs and operational simplicity are key considerations for farmers, home gardeners, professional growers, restaurants, and commercial hydroponic growers.
Get a glance at the market report of share of various segments Request Free Sample
The Macronutrients segment was valued at USD 1.54 billion in 2018 and showed a gradual increase during the forecast period.
Regional Analysis
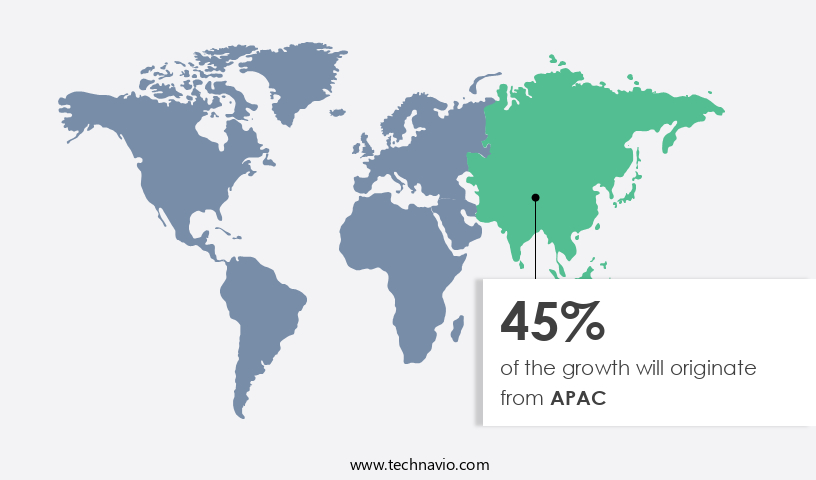
- APAC is estimated to contribute 45% to the growth of the global market during the forecast period. Technavio’s analysts have elaborately explained the regional trends and drivers that shape the market during the forecast period.
For more insights on the market size of various regions, Request Free Sample
The APAC region led The market in 2023 due to limited arable land, advanced farming techniques, and technological innovations. Population growth, with the Asian Development Bank predicting a population of 5.1 billion in APAC by 2050, necessitates increased crop production. Hydroponic nutrients are essential for these farming methods, which exclude soil. Nitrogen, phosphorus, and potassium are key components of these nutrient solutions for crops such as tomatoes, cucumbers, leafy greens, peppers, and strawberries. Hydroponic systems, including nutrient film technique, deep water culture, and aggregate systems, require climate control, irrigation, and control systems, which increase energy requirements and costs. However, the benefits of hydroponics, such as higher yields and productivity, make it an attractive option for farmers, home gardeners, professional growers, restaurants, and commercial operations in urban areas.
Market Dynamics
Our researchers analyzed the data with 2023 as the base year, along with the key drivers, trends, and challenges. A holistic analysis of drivers will help companies refine their marketing strategies to gain a competitive advantage.
What are the key market drivers leading to the rise In the adoption of Hydroponic Nutrients Industry?
- Reduction in arable land is the key driver of the market. The Global Hydroponics Market is gaining momentum due to the diminishing arable land and the need to increase food production to cater to the growing population. By 2050, the global arable land per person is projected to decrease from 0.19 hectares to 0.17 hectares. To meet the anticipated 70% increase in food grain demand by 2030, an additional 34 million square kilometers of new arable land is required. Hydroponics, a soil-less agriculture technique, offers a solution to this challenge. This method uses nutrient solutions containing essential elements like Nitrogenous, Phosphatic, and Potassic, as well as Micronutrients, to feed crops. Synthetic and Organic nutrients are available, catering to various grower preferences.
- Hydroponic systems, such as Nutrient Film Technique and Deep Water Culture, are used for growing a variety of crops, including Tomato, Cucumber, Leafy Greens, Pepper, Strawberries, and Fruits. These systems require minimal water and can be set up in urban areas, making them suitable for Indoor farming systems, Phytoponics, and Greenhouse crop production. Commercial hydroponic growers, Farmers, Home gardeners, Restaurants, and Professional growers benefit from the high yield and productivity these systems offer. Despite the initial installation costs, hydroponic agriculture's operational simplicity, energy requirements, and the use of advanced technologies like HVAC systems, Fans, Ventilation, Irrigation systems, Control systems, Rails, Lights, and Sensing technologies, make it a viable alternative to traditional farming.
What are the market trends shaping the Hydroponic Nutrients Industry?
- The growing application of hydroponics in vertical farming is the upcoming market trend. The market is experiencing growth due to the increasing adoption of hydroponic systems in vertical farming. In vertical farming, plants are grown in stacked trays, limiting access to natural sunlight. To compensate, these farms rely heavily on energy-intensive LED lighting for photosynthesis. However, hydroponic systems used in vertical greenhouses offer an advantage, allowing plants to access natural sunlight when available, reducing electricity consumption. Researchers at Eden Green Technology are currently exploring hydroponic systems for the vertical cultivation of tomatoes, peppers, cucumbers, and other crops. This trend is expected to present new opportunities for companies In the market. With the focus on climate control, sensing technologies, and advanced indoor farming systems like phytoponics, polymer hydrogel films, and aggregate systems, the market is poised for expansion.
- Hydroponic agriculture, which utilizes mineral solutions instead of soil, offers yield and productivity benefits, especially in urban areas with limited arable land and in areas affected by climate change and water scarcity. The market caters to farmers, home gardeners, professional growers, restaurants, and commercial hydroponic growers, providing a range of nutrient solutions for various crops, including fruits, berries, and leafy greens. Installation costs and operational simplicity are key considerations for market participants. Hydroponic systems employ various technologies like deep water culture, nutrient film technique, and liquid systems. Energy requirements for hydroponic systems include HVAC systems, fans, ventilation, irrigation systems, and control systems.
What challenges does the Hydroponic Nutrients Industry face during its growth?
- The availability of traditional farming is a key challenge affecting the industry growth. The market is experiencing growth due to the demand for nutrient-rich crops in response to climate changes and water scarcity. However, competition from traditional soil-based farming methods persists. The depletion of essential nutrients like nitrogen, phosphorus, and potassium In the soil has resulted In the increased use of synthetic and organic hydroponic nutrients. These nutrients are essential for various crops, including tomatoes, cucumbers, leafy greens, peppers, and strawberries.
- Hydroponic agriculture, which includes advanced systems like Nutrifield, Phytoponics, and soil-less agriculture, is gaining popularity among farmers, home gardeners, professional growers, restaurants, and commercial hydroponic growers. The use of hydroponic nutrients allows for higher yields and productivity, even in urban areas with limited space. However, the energy requirements for hydroponic systems, including HVAC systems, fans, ventilation, irrigation systems, and control systems, can be significant. The installation costs and operational simplicity of hydroponic systems are important considerations for potential users. Despite these challenges, the market for hydroponic nutrients is expected to continue growing as the demand for nutritionally superior vegetables and fruits increases.
Exclusive Customer Landscape
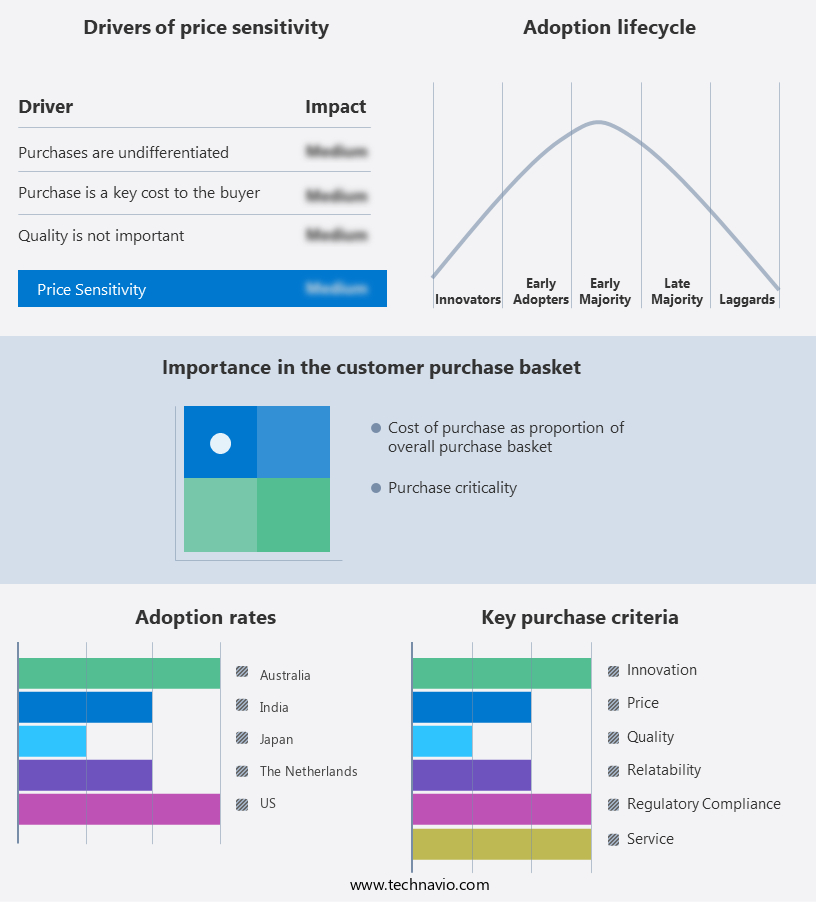
The hydroponic nutrients market forecasting report includes the adoption lifecycle of the market, covering from the innovator’s stage to the laggard’s stage. It focuses on adoption rates in different regions based on penetration. Furthermore, the hydroponic nutrients market report also includes key purchase criteria and drivers of price sensitivity to help companies evaluate and develop their market growth analysis strategies.
Customer Landscape
Key Companies & Market Insights
Companies are implementing various strategies, such as strategic alliances, hydroponic nutrients market forecast, partnerships, mergers and acquisitions, geographical expansion, and product/service launches, to enhance their presence In the industry.
The industry research and growth report includes detailed analyses of the competitive landscape of the market and information about key companies, including:
- 3G Green Garden Group LLC
- Advanced Nutrients Ltd.
- Better Organix OU
- BrightFarms Inc.
- Canna Continental
- FoxFarm Soil and Fertilizer Co.
- Growth Technology Ltd.
- HGI Worldwide Inc.
- HS Supplies LLC
- Hydrodynamics International Inc.
- LumiGrow Inc
- Master Garden Nutrients Ltd.
- Masterblend International Tyler Enterprises
- Nutriculture UK Ltd.
- The Scotts Miracle Gro Co.
- Village Farms International Inc.
Qualitative and quantitative analysis of companies has been conducted to help clients understand the wider business environment as well as the strengths and weaknesses of key industry players. Data is qualitatively analyzed to categorize companies as pure play, category-focused, industry-focused, and diversified; it is quantitatively analyzed to categorize companies as dominant, leading, strong, tentative, and weak.
Research Analyst Overview
The market encompasses a wide range of nutrient solutions designed to facilitate the growth of crops in soil-less environments. These nutrients cater to various plant requirements, including nitrogenous, phosphatic, and potassic elements, as well as micronutrients essential for optimal plant development. Hydroponic systems have gained significant traction in recent years due to the increasing demand for sustainable agricultural practices. With arable land becoming a scarce resource and climate change posing challenges to traditional farming methods, hydroponics offers a viable solution to address these issues. Nutrient solutions In the hydroponics market can be categorized as synthetic and organic.
Further, synthetic nutrients are chemically formulated to provide plants with essential nutrients, while organic nutrients are derived from natural sources. Both types cater to various crop types, including tomatoes, cucumbers, leafy greens, peppers, and strawberries. The adoption of hydroponics is not limited to commercial growers but also extends to home gardeners and farmers seeking to optimize crop yield and productivity. Indoor farming systems, such as phytoponics and nutrient film technique, have gained popularity due to their ability to produce high-quality crops in urban areas with minimal space requirements. Hydroponic systems require various energy-intensive components, such as HVAC systems, fans, ventilation, irrigation systems, control systems, rails, and lights.
These systems enable precise climate control, sensing technologies, and optimized nutrient delivery, leading to increased crop productivity. Organic certification is a critical consideration for some growers In the hydroponics market. While synthetic nutrients offer uniform nutrient delivery and ease of use, organic nutrients cater to the growing demand for nutritionally superior vegetables and fruits, free from artificial ripening agents and pesticides. The hydroponics market is diverse, with various nutrient delivery systems, including liquid systems and deep water culture. Deep water culture, for instance, allows plants to grow with their roots submerged in a nutrient solution, while nutrient film technique involves circulating a thin film of nutrient solution over the roots.
|
Market Scope |
|
|
Report Coverage |
Details |
|
Page number |
128 |
|
Base year |
2023 |
|
Historic period |
2018-2022 |
|
Forecast period |
2024-2028 |
|
Growth momentum & CAGR |
Accelerate at a CAGR of 11.54% |
|
Market Growth 2024-2028 |
USD 2.14 billion |
|
Market structure |
Fragmented |
|
YoY growth 2023-2024(%) |
9.39 |
|
Key countries |
US, India, Japan, Australia, and The Netherlands |
|
Competitive landscape |
Leading Companies, Market Positioning of Companies, Competitive Strategies, and Industry Risks |
What are the Key Data Covered in this Hydroponic Nutrients Market Research and Growth Report?
- CAGR of the Hydroponic Nutrients industry during the forecast period
- Detailed information on factors that will drive the market growth and forecasting between 2024 and 2028
- Precise estimation of the size of the market and its contribution of the industry in focus to the parent market
- Accurate predictions about upcoming growth and trends and changes in consumer behaviour
- Growth of the market across APAC, North America, Europe, South America, and Middle East and Africa
- Thorough analysis of the market’s competitive landscape and detailed information about companies
- Comprehensive analysis of factors that will challenge the hydroponic nutrients market growth of industry companies
We can help! Our analysts can customize this hydroponic nutrients market research report to meet your requirements.
 RIA -
RIA - 
