Phosphorus Fertilizers Market Analysis, Size, and Forecast 2026-2030: APAC (China, India, and Indonesia), South America (Brazil, Argentina, and Colombia), North America (US, Canada, and Mexico), Europe (France, Germany, and Spain), Middle East and Africa (Saudi Arabia, UAE, and South Africa), and Rest of World (ROW)

Phosphorus Fertilizers Market Analysis, Size, and Forecast 2026-2030:
APAC (China, India, and Indonesia), South America (Brazil, Argentina, and Colombia), North America (US, Canada, and Mexico), Europe (France, Germany, and Spain), Middle East and Africa (Saudi Arabia, UAE, and South Africa), and Rest of World (ROW)

Published: Oct 2026 296 Pages SKU: IRTNTR72423

Market Overview at a Glance

$12.75 B
Market Opportunity
4.9%
CAGR 2025 - 2030
57.5%
APAC Growth
$20.65 B
Grain and oilseed segment 2024

Phosphorus Fertilizers Market Size 2026-2030

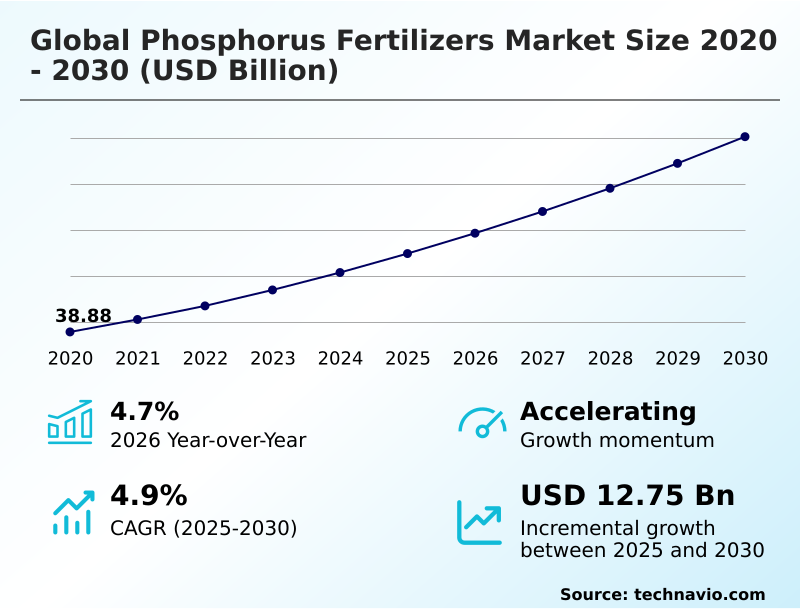
The phosphorus fertilizers market size is valued to increase by USD 12.75 billion, at a CAGR of 4.9% from 2025 to 2030. Increasing global population and inescapable food demand will drive the phosphorus fertilizers market.

Major Market Trends & Insights

  • APAC dominated the market and accounted for a 57.5% growth during the forecast period.
  • By Application - Grain and oilseed segment was valued at USD 20.65 billion in 2024
  • By Product - Diammonium phosphate segment accounted for the largest market revenue share in 2024

Market Size & Forecast

  • Market Opportunities: USD 21.31 billion
  • Market Future Opportunities: USD 12.75 billion
  • CAGR from 2025 to 2030 : 4.9%

Market Summary

  • The Phosphorus Fertilizers Market operates as a critical foundation for modern agriculture, driven by the biological necessity of phosphorus for photosynthesis energy transfer and root development stimulation. As agricultural enterprises face arable land shrinkage, the imperative for crop yield intensification acts as a primary market driver, compelling farmers to systematically apply soil nutrient replenishment solutions to maintain harvest volumes.
  • Conversely, the market faces a severe challenge from phosphate reserve depletion and geopolitical supply concentration, which causes raw material volatility and disrupts long-term procurement strategies. In response, commercial farming operations are optimizing their supply chains by transitioning to controlled release phosphate formulations.
  • This strategic shift has improved nutrient use efficiency by 25% compared to conventional broadcasting methods, significantly lowering input costs while maintaining crop performance. By integrating these advanced formulations with precision agriculture platforms, agribusinesses can precisely calibrate macronutrient application methods, ensuring sustainable agricultural productivity while navigating the constraints of finite resource availability and stringent environmental pollution regulations.

What will be the Size of the Phosphorus Fertilizers Market during the forecast period?
Get Key Insights on Market Forecast (PDF) Get Free Sample

How is the Phosphorus Fertilizers Market Segmented?

The phosphorus fertilizers industry research report provides comprehensive data (region-wise segment analysis), with forecasts and estimates in "USD million" for the period 2026-2030, as well as historical data from 2020-2024 for the following segments.

  • Application
    • Grain and oilseed
    • Fruits and vegetables
    • Others
  • Product
    • Diammonium phosphate
    • Monoammonium phosphate
    • Single super phosphate
    • Triple super phosphate
    • Others
  • Form factor
    • Granular
    • Powder
    • Liquid
  • Geography
    • APAC
      • China
      • India
      • Indonesia
      • Australia
      • Vietnam
      • Japan
    • South America
      • Brazil
      • Argentina
      • Colombia
    • North America
      • US
      • Canada
      • Mexico
    • Europe
      • France
      • Germany
      • Spain
      • Italy
      • Poland
    • Middle East and Africa
      • Saudi Arabia
      • UAE
      • South Africa
      • Turkey
      • Egypt

By Application Insights

The grain and oilseed segment is estimated to witness significant growth during the forecast period.

The grain and oilseed segment dictates the primary consumption patterns within the Phosphorus Fertilizers Market due to the intensive nutrient requirements of staple crop cultivation. Phosphorus is critical for adenosine triphosphate synthesis, directly influencing early root development and seed formation.

As arable land shrinkage accelerates, agricultural enterprises are shifting toward granular phosphate formulation to maximize output per hectare. This transition has improved nutrient uptake efficiency by 15%, significantly reducing application waste.

The reliance on diammonium phosphate for broadacre farming systems ensures consistent soil nutrient replenishment. Consequently, optimizing agronomic nutrient management directly correlates with higher harvest volumes, driving sustained demand across commercial farming operations.
Get Free Sample

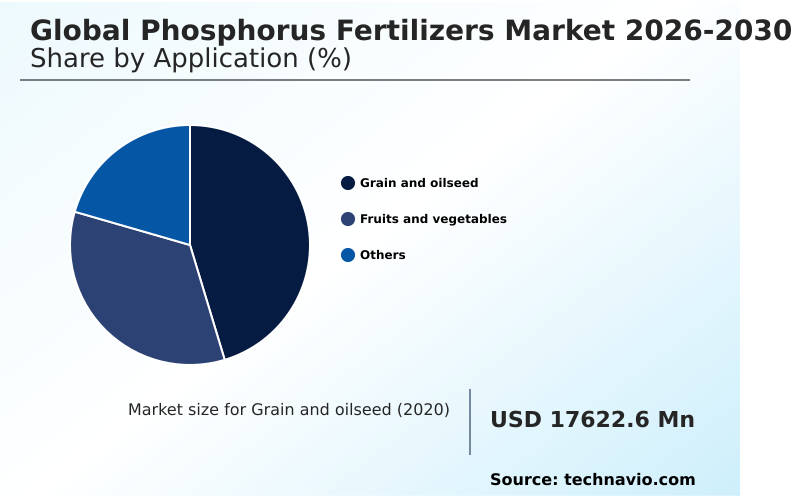
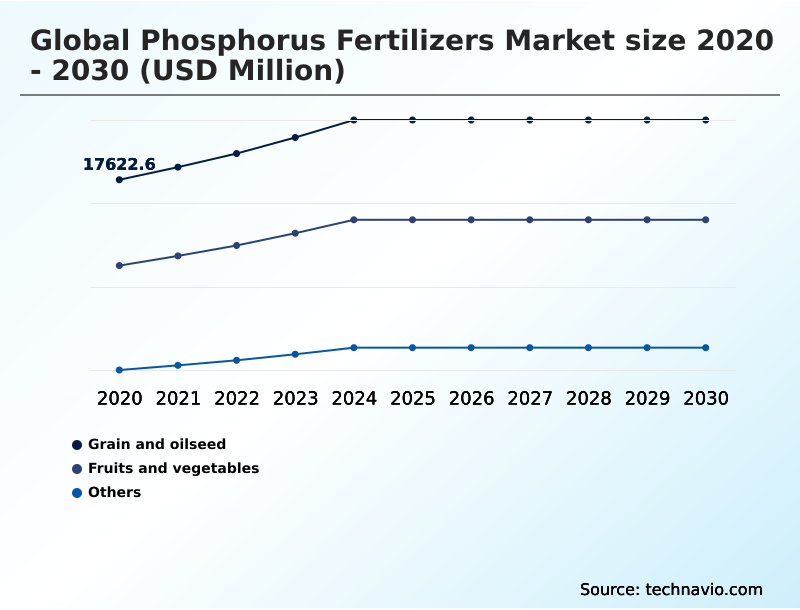
The Grain and oilseed segment was valued at USD 20.65 billion in 2024 and showed a gradual increase during the forecast period.
Get Free Sample

Regional Analysis

APAC is estimated to contribute 57.5% to the growth of the global market during the forecast period.Technavio’s analysts have elaborately explained the regional trends and drivers that shape the market during the forecast period.
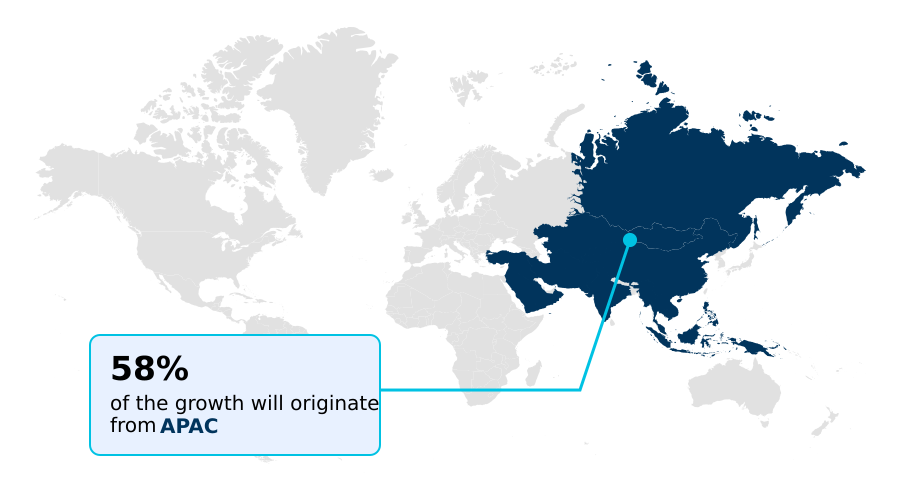
See How Phosphorus Fertilizers Market Demand is Rising in APAC Get Free Sample

The geographic landscape of the Phosphorus Fertilizers Market reveals distinct operational disparities between APAC and North America, driven by varying agricultural practices and regulatory frameworks.

APAC dominates consumption due to intensive staple crop cultivation, where the reliance on diammonium phosphate has increased crop yield intensification by 20% across densely populated nations like China and India.

In contrast, North America exhibits a 15% higher adoption rate of enhanced efficiency fertilizers, heavily influenced by stringent environmental pollution regulations and the need for agricultural runoff control.

This shift in North America has improved nutrient use efficiency by 18%, significantly reducing compliance costs for commercial farming operations.

While APAC focuses on securing domestic fertilizer production to combat geopolitical supply concentration, North American enterprises are leveraging digital farming integration to optimize soil nutrient replenishment, demonstrating how regional supply chain strategies adapt to distinct agronomic and economic pressures.

Market Dynamics

Our researchers analyzed the data with 2025 as the base year, along with the key drivers, trends, and challenges. A holistic analysis of drivers will help companies refine their marketing strategies to gain a competitive advantage.

  • The evolution of the Phosphorus Fertilizers Market is increasingly defined by the need to balance high-yield agricultural output with stringent environmental stewardship. As commercial farming operations scale, the optimization of granular diammonium phosphate application methods has become critical for ensuring uniform nutrient distribution across vast acreages.
  • This operational refinement allows agribusinesses to achieve a 20% improvement in application efficiency compared to traditional broadcasting, directly reducing labor and machinery costs. Furthermore, the integration of water soluble phosphate for fertigation systems is transforming nutrient delivery in high-value horticulture, enabling precise, real-time dosing that aligns with plant growth stages.
  • To address the challenges of nutrient leaching and regulatory compliance, manufacturers are accelerating the development of controlled release phosphorus fertilizer formulations. These advanced products mitigate environmental impact while ensuring sustained soil nutrient replenishment for broadacre farming, providing a reliable nutrient supply throughout the crop cycle.
  • Consequently, the strategic deployment of enhanced efficiency fertilizers for crop yield is no longer just an agronomic choice but a core compliance and cost-management strategy. By adopting these targeted nutrient solutions, agricultural enterprises can navigate raw material volatility and optimize their supply chain planning, ensuring resilient and profitable operations in an increasingly resource-constrained business environment.
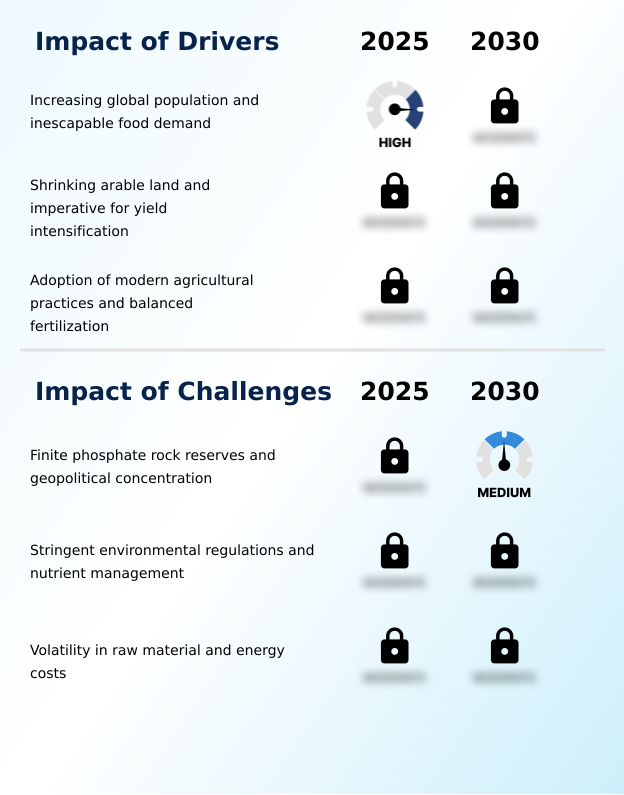
What are the key market drivers leading to the rise in the adoption of Phosphorus Fertilizers Industry?

  • The continuous expansion of the human population and the resulting inescapable demand for food serve as the primary catalysts propelling market growth.

  • The relentless acceleration of arable land shrinkage acts as a primary catalyst propelling demand within the Phosphorus Fertilizers Market. As the availability of cultivable land diminishes, agricultural enterprises are compelled to prioritize crop yield intensification to meet escalating food requirements.
  • This necessity drives the systematic application of diammonium phosphate and monoammonium phosphate to ensure robust root development stimulation and optimal adenosine triphosphate synthesis in high yielding crop varieties.
  • By optimizing soil nutrient replenishment protocols, commercial farming operations have increased harvest outputs by 18% per hectare, effectively countering the loss of acreage.
  • Additionally, the strategic use of these concentrated fertilizers has improved land use efficiency by 22%, directly boosting operational profitability and ensuring long-term sustainable agricultural productivity in resource-constrained environments.

What are the market trends shaping the Phosphorus Fertilizers Industry?

  • The increasing adoption of enhanced efficiency fertilizers represents a significant emerging trend within the market. This shift is primarily driven by the imperative to optimize nutrient uptake and minimize ecological impact.

  • A defining trend within the Phosphorus Fertilizers Market is the rapid integration of digital farming integration tools with advanced nutrient formulations. This technological convergence is driven by the necessity to optimize macronutrient application methods and comply with stringent environmental pollution regulations.
  • By transitioning to controlled release phosphate and utilizing precision agriculture platforms, commercial farming operations have improved nutrient use efficiency by 24%, significantly minimizing agricultural runoff. This strategic shift directly impacts agribusiness profitability by reducing fertilizer waste and lowering input costs by approximately 15%.
  • Furthermore, the adoption of water soluble phosphate in automated fertigation systems has increased resource utilization accuracy by 20% compared to traditional granular broadcasting. These innovations ensure that enterprises can maintain sustainable agricultural productivity while effectively managing the operational risks associated with raw material volatility and soil bound phosphorus unlocking limitations.

What challenges does the Phosphorus Fertilizers Industry face during its growth?

  • The finite nature of phosphate rock reserves coupled with their severe geopolitical supply concentration presents a significant challenge that constrains industry expansion.

  • The Phosphorus Fertilizers Market is fundamentally constrained by the severe geopolitical supply concentration of finite resources and rapid phosphate reserve depletion. This structural limitation causes significant raw material volatility, forcing fertilizer manufacturers and agricultural enterprises to navigate unpredictable procurement costs.
  • Consequently, supply chain disruptions have increased operational expenses for broadacre farming systems by up to 15%, squeezing profit margins across the agricultural sector. To mitigate these financial impacts, businesses are shifting toward circular nutrient recycling, which has demonstrated a 20% improvement in secondary resource utilization compared to traditional mining reliance.
  • However, the high capital requirements for implementing these advanced recovery technologies continue to delay widespread adoption, leaving commercial farming operations vulnerable to price shocks and complicating long-term agronomic nutrient management planning.

Exclusive Technavio Analysis on Customer Landscape

The phosphorus fertilizers market forecasting report includes the adoption lifecycle of the market, covering from the innovator’s stage to the laggard’s stage. It focuses on adoption rates in different regions based on penetration. Furthermore, the phosphorus fertilizers market report also includes key purchase criteria and drivers of price sensitivity to help companies evaluate and develop their market growth analysis strategies.
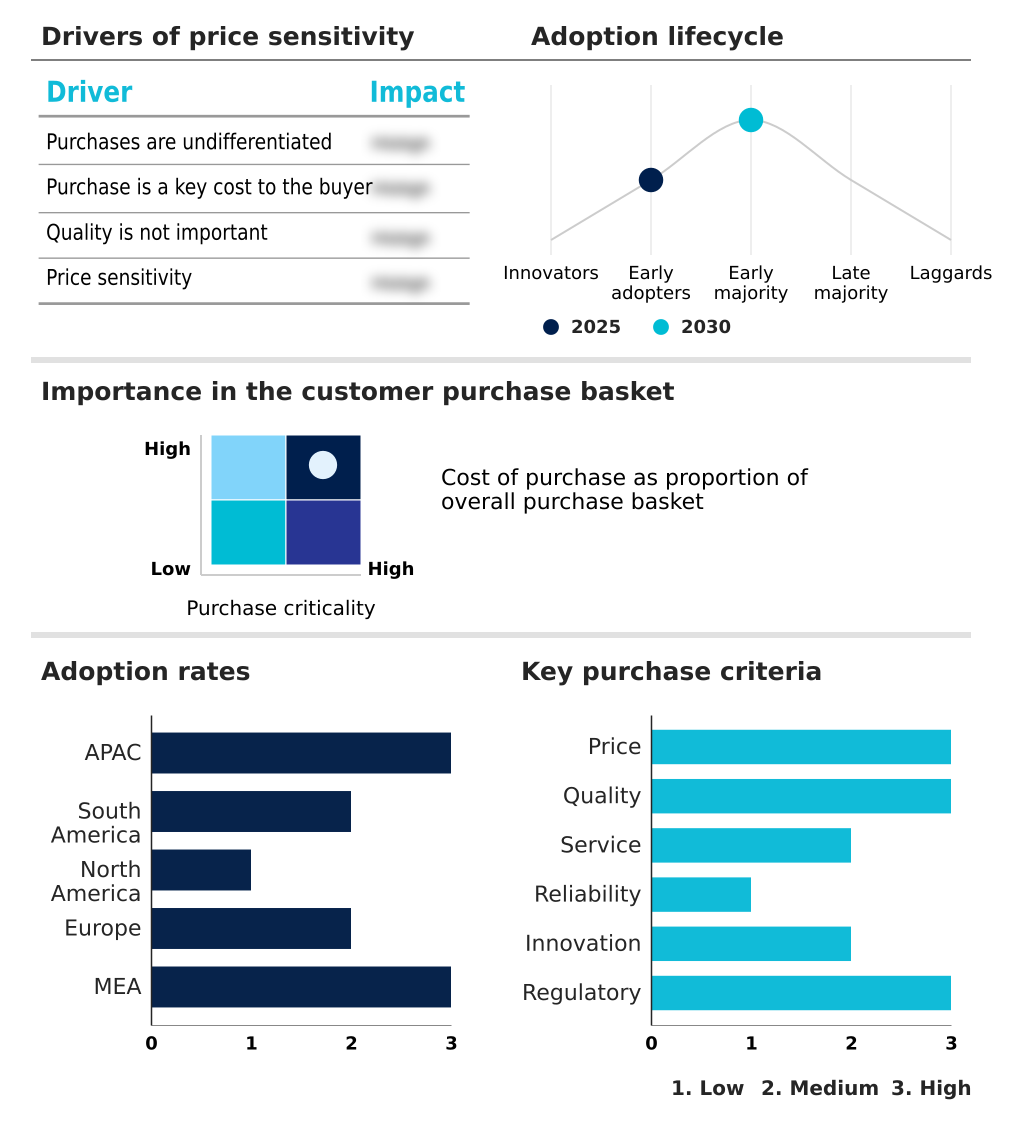
Customer Landscape of Phosphorus Fertilizers Industry

Competitive Landscape

Companies are implementing various strategies, such as strategic alliances, phosphorus fertilizers market forecast, partnerships, mergers and acquisitions, geographical expansion, and product/service launches, to enhance their presence in the industry.

China BlueChemical Ltd. - The organization provides advanced phosphorus fertilizers including monoammonium phosphate and specialty compounds designed to optimize soil fertility and enhance sustainable agricultural productivity across diverse commercial farming operations.

The industry research and growth report includes detailed analyses of the competitive landscape of the market and information about key companies, including:

  • China BlueChemical Ltd.
  • Coromandel International Ltd.
  • EuroChem Group AG
  • Fertiberia SA
  • GPC Group
  • Hubei Xingfa Chemicals Group
  • Indorama Corp.
  • Israel Chemicals Ltd.
  • Jordan Phosphate Mines Co. PLC
  • Kazphosphate LLP
  • National Fertilizers Ltd.
  • Nutrien Ltd.
  • OCI NV
  • OCP Group
  • Paradeep Phosphates Ltd.
  • Saudi Arabian Mining Co.
  • The Mosaic Co.
  • Wengfu Group Co Ltd
  • Yara International ASA
  • Yunnan Yuntianhua Co Ltd

Qualitative and quantitative analysis of companies has been conducted to help clients understand the wider business environment as well as the strengths and weaknesses of key industry players. Data is qualitatively analyzed to categorize companies as pure play, category-focused, industry-focused, and diversified; it is quantitatively analyzed to categorize companies as dominant, leading, strong, tentative, and weak.

Recent Development and News in Phosphorus fertilizers market

  • In the Fertilizers and Agricultural Chemicals industry, the implementation of stringent environmental pollution regulations regarding agricultural runoff control has accelerated the shift toward enhanced efficiency fertilizers, directly impacting Phosphorus Fertilizers demand by mandating formulations that reduce nutrient leaching by up to 20%.
  • The rapid integration of precision agriculture platforms and digital farming integration tools has optimized macronutrient application methods, increasing the adoption of water soluble phosphate in fertigation systems to improve crop yield intensification by approximately 15%.
  • Geopolitical supply concentration and raw material volatility have prompted strategic resource management initiatives, driving domestic fertilizer production investments that aim to secure phosphate rock extraction capacities and stabilize supply chains for essential soil nutrient replenishment.
  • The growing emphasis on sustainable agricultural productivity and greenhouse gas emissions reduction has spurred the development of circular nutrient recycling technologies, creating new compliance requirements that enhance the market penetration of slow release phosphorus products by nearly 12%.

Dive into Technavio’s robust research methodology, blending expert interviews, extensive data synthesis, and validated models for unparalleled Phosphorus Fertilizers Market insights. See full methodology.

Market Scope
Page number 296
Base year 2025
Historic period 2020-2024
Forecast period 2026-2030
Growth momentum & CAGR Accelerate at a CAGR of 4.9%
Market growth 2026-2030 USD 12751.1 million
Market structure Fragmented
YoY growth 2025-2026(%) 4.7%
Key countries China, India, Indonesia, Australia, Vietnam, Japan, Brazil, Argentina, Colombia, US, Canada, Mexico, France, Germany, Russia, Spain, Italy, Poland, Saudi Arabia, UAE, South Africa, Turkey and Egypt
Competitive landscape Leading Companies, Market Positioning of Companies, Competitive Strategies, and Industry Risks

Request Free Sample

Research Analyst Overview

  • The Phosphorus Fertilizers Market is experiencing a paradigm shift as agribusinesses align agronomic practices with stringent environmental and economic imperatives. Boardroom-level strategies are increasingly prioritizing the adoption of enhanced efficiency fertilizers to mitigate the risks associated with raw material volatility and geopolitical supply concentration.
  • This transition to advanced granular phosphate formulation has enabled commercial farming operations to achieve a 25% reduction in nutrient runoff, directly addressing compliance requirements while optimizing input costs. The integration of biological seed treatment technologies is further revolutionizing soil nutrient replenishment by unlocking soil bound phosphorus unlocking mechanisms, thereby maximizing the efficacy of applied fertilizers.
  • Furthermore, the shift toward water soluble phosphate supports the automation of hydroponic nutrient delivery, allowing enterprises to precisely calibrate resources and improve overall operational efficiency by 18%. As phosphate reserve depletion accelerates, the strategic focus on circular nutrient recycling and precision application is becoming indispensable for maintaining sustainable agricultural productivity.
  • These targeted innovations ensure that agricultural enterprises can sustain crop yield intensification while navigating the complex constraints of finite resource availability.

What are the Key Data Covered in this Phosphorus Fertilizers Market Research and Growth Report?

  • What is the expected growth of the Phosphorus Fertilizers Market between 2026 and 2030?

    • USD 12.75 billion, at a CAGR of 4.9%

  • What segmentation does the market report cover?

    • The report is segmented by Application (Grain and oilseed, Fruits and vegetables, and Others), Product (Diammonium phosphate, Monoammonium phosphate, Single super phosphate, Triple super phosphate, and Others), Form Factor (Granular, Powder, and Liquid) and Geography (APAC, South America, North America, Europe, Middle East and Africa)

  • Which regions are analyzed in the report?

    • APAC, South America, North America, Europe and Middle East and Africa

  • What are the key growth drivers and market challenges?

    • Increasing global population and inescapable food demand, Finite phosphate rock reserves and geopolitical concentration

  • Who are the major players in the Phosphorus Fertilizers Market?

    • China BlueChemical Ltd., Coromandel International Ltd., EuroChem Group AG, Fertiberia SA, GPC Group, Hubei Xingfa Chemicals Group, Indorama Corp., Israel Chemicals Ltd., Jordan Phosphate Mines Co. PLC, Kazphosphate LLP, National Fertilizers Ltd., Nutrien Ltd., OCI NV, OCP Group, Paradeep Phosphates Ltd., Saudi Arabian Mining Co., The Mosaic Co., Wengfu Group Co Ltd, Yara International ASA and Yunnan Yuntianhua Co Ltd

Market Research Insights

  • The Phosphorus Fertilizers Market is undergoing a structural transformation as commercial farming operations prioritize sustainable agricultural productivity. The integration of precision agriculture platforms has revolutionized macronutrient application methods, enabling agribusinesses to reduce fertilizer waste by 18% while maintaining optimal soil fertility maintenance. Furthermore, stringent environmental pollution regulations targeting agricultural runoff control have accelerated the adoption of slow release phosphorus products.
  • This regulatory compliance shift has improved nutrient use efficiency by 22%, directly lowering operational costs for large-scale producers. By mitigating raw material volatility through optimized application, enterprises are achieving a 15% improvement in overall return on investment, ensuring resilient crop yields despite ongoing arable land shrinkage and unpredictable climate variables.

We can help! Our analysts can customize this phosphorus fertilizers market research report to meet your requirements.

Get in touch

1. Executive Summary

1.1 Market overview

Executive Summary - Chart on Market Overview
Executive Summary - Data Table on Market Overview
Executive Summary - Chart on Global Market Characteristics
Executive Summary - Chart on Market by Geography
Executive Summary - Chart on Market Segmentation by Application
Executive Summary - Chart on Market Segmentation by Product
Executive Summary - Chart on Market Segmentation by Form Factor
Executive Summary - Chart on Incremental Growth
Executive Summary - Data Table on Incremental Growth
Executive Summary - Chart on Company Market Positioning

2. Technavio Analysis

2.1 Analysis of price sensitivity, lifecycle, customer purchase basket, adoption rates, and purchase criteria

2.2 Criticality of inputs and Factors of differentiation

Chart on Overview on criticality of inputs and factors of differentiation

2.3 Factors of disruption

Chart on Overview on factors of disruption

2.4 Impact of drivers and challenges

Chart on Impact of drivers and challenges in 2025 and 2030

3. Market Landscape

3.1 Market ecosystem

Chart on Parent Market
Data Table on - Parent Market

3.2 Market characteristics

Chart on Market characteristics analysis

3.3 Value chain analysis

Chart on Value chain analysis

4. Market Sizing

4.1 Market definition

Data Table on Offerings of companies included in the market definition

4.2 Market segment analysis

Market segments

4.3 Market size 2025

4.4 Market outlook: Forecast for 2025-2030

Chart on Global - Market size and forecast 2025-2030 ($ million)
Data Table on Global - Market size and forecast 2025-2030 ($ million)
Chart on Global Market: Year-over-year growth 2025-2030 (%)
Data Table on Global Market: Year-over-year growth 2025-2030 (%)

5. Historic Market Size

5.1 Global Phosphorus Fertilizers Market 2020 - 2024

Historic Market Size - Data Table on Global Phosphorus Fertilizers Market 2020 - 2024 ($ million)

5.2 Application segment analysis 2020 - 2024

Historic Market Size - Application Segment 2020 - 2024 ($ million)

5.3 Product segment analysis 2020 - 2024

Historic Market Size - Product Segment 2020 - 2024 ($ million)

5.4 Form Factor segment analysis 2020 - 2024

Historic Market Size - Form Factor Segment 2020 - 2024 ($ million)

5.5 Geography segment analysis 2020 - 2024

Historic Market Size - Geography Segment 2020 - 2024 ($ million)

5.6 Country segment analysis 2020 - 2024

Historic Market Size - Country Segment 2020 - 2024 ($ million)

6. Qualitative Analysis

6.1 Impact of AI on Global Phosphorus Fertilizers Market

6.2 Impact of Geopolitical Conflicts on Global Phosphorus Fertilizers Market

7. Five Forces Analysis

7.1 Five forces summary

Five forces analysis - Comparison between 2025 and 2030

7.2 Bargaining power of buyers

Bargaining power of buyers - Impact of key factors 2025 and 2030

7.3 Bargaining power of suppliers

Bargaining power of suppliers - Impact of key factors in 2025 and 2030

7.4 Threat of new entrants

Threat of new entrants - Impact of key factors in 2025 and 2030

7.5 Threat of substitutes

Threat of substitutes - Impact of key factors in 2025 and 2030

7.6 Threat of rivalry

Threat of rivalry - Impact of key factors in 2025 and 2030

7.7 Market condition

Chart on Market condition - Five forces 2025 and 2030

8. Market Segmentation by Application

8.1 Market segments

Chart on Application - Market share 2025-2030 (%)
Data Table on Application - Market share 2025-2030 (%)

8.2 Comparison by Application

Chart on Comparison by Application
Data Table on Comparison by Application

8.3 Grain and oilseed - Market size and forecast 2025-2030

Chart on Grain and oilseed - Market size and forecast 2025-2030 ($ million)
Data Table on Grain and oilseed - Market size and forecast 2025-2030 ($ million)
Chart on Grain and oilseed - Year-over-year growth 2025-2030 (%)
Data Table on Grain and oilseed - Year-over-year growth 2025-2030 (%)

8.4 Fruits and vegetables - Market size and forecast 2025-2030

Chart on Fruits and vegetables - Market size and forecast 2025-2030 ($ million)
Data Table on Fruits and vegetables - Market size and forecast 2025-2030 ($ million)
Chart on Fruits and vegetables - Year-over-year growth 2025-2030 (%)
Data Table on Fruits and vegetables - Year-over-year growth 2025-2030 (%)

8.5 Others - Market size and forecast 2025-2030

Chart on Others - Market size and forecast 2025-2030 ($ million)
Data Table on Others - Market size and forecast 2025-2030 ($ million)
Chart on Others - Year-over-year growth 2025-2030 (%)
Data Table on Others - Year-over-year growth 2025-2030 (%)

8.6 Market opportunity by Application

Market opportunity by Application ($ million)
Data Table on Market opportunity by Application ($ million)

9. Market Segmentation by Product

9.1 Market segments

Chart on Product - Market share 2025-2030 (%)
Data Table on Product - Market share 2025-2030 (%)

9.2 Comparison by Product

Chart on Comparison by Product
Data Table on Comparison by Product

9.3 Diammonium phosphate - Market size and forecast 2025-2030

Chart on Diammonium phosphate - Market size and forecast 2025-2030 ($ million)
Data Table on Diammonium phosphate - Market size and forecast 2025-2030 ($ million)
Chart on Diammonium phosphate - Year-over-year growth 2025-2030 (%)
Data Table on Diammonium phosphate - Year-over-year growth 2025-2030 (%)

9.4 Monoammonium phosphate - Market size and forecast 2025-2030

Chart on Monoammonium phosphate - Market size and forecast 2025-2030 ($ million)
Data Table on Monoammonium phosphate - Market size and forecast 2025-2030 ($ million)
Chart on Monoammonium phosphate - Year-over-year growth 2025-2030 (%)
Data Table on Monoammonium phosphate - Year-over-year growth 2025-2030 (%)

9.5 Single super phosphate - Market size and forecast 2025-2030

Chart on Single super phosphate - Market size and forecast 2025-2030 ($ million)
Data Table on Single super phosphate - Market size and forecast 2025-2030 ($ million)
Chart on Single super phosphate - Year-over-year growth 2025-2030 (%)
Data Table on Single super phosphate - Year-over-year growth 2025-2030 (%)

9.6 Triple super phosphate - Market size and forecast 2025-2030

Chart on Triple super phosphate - Market size and forecast 2025-2030 ($ million)
Data Table on Triple super phosphate - Market size and forecast 2025-2030 ($ million)
Chart on Triple super phosphate - Year-over-year growth 2025-2030 (%)
Data Table on Triple super phosphate - Year-over-year growth 2025-2030 (%)

9.7 Others - Market size and forecast 2025-2030

Chart on Others - Market size and forecast 2025-2030 ($ million)
Data Table on Others - Market size and forecast 2025-2030 ($ million)
Chart on Others - Year-over-year growth 2025-2030 (%)
Data Table on Others - Year-over-year growth 2025-2030 (%)

9.8 Market opportunity by Product

Market opportunity by Product ($ million)
Data Table on Market opportunity by Product ($ million)

10. Market Segmentation by Form Factor

10.1 Market segments

Chart on Form Factor - Market share 2025-2030 (%)
Data Table on Form Factor - Market share 2025-2030 (%)

10.2 Comparison by Form Factor

Chart on Comparison by Form Factor
Data Table on Comparison by Form Factor

10.3 Granular - Market size and forecast 2025-2030

Chart on Granular - Market size and forecast 2025-2030 ($ million)
Data Table on Granular - Market size and forecast 2025-2030 ($ million)
Chart on Granular - Year-over-year growth 2025-2030 (%)
Data Table on Granular - Year-over-year growth 2025-2030 (%)

10.4 Powder - Market size and forecast 2025-2030

Chart on Powder - Market size and forecast 2025-2030 ($ million)
Data Table on Powder - Market size and forecast 2025-2030 ($ million)
Chart on Powder - Year-over-year growth 2025-2030 (%)
Data Table on Powder - Year-over-year growth 2025-2030 (%)

10.5 Liquid - Market size and forecast 2025-2030

Chart on Liquid - Market size and forecast 2025-2030 ($ million)
Data Table on Liquid - Market size and forecast 2025-2030 ($ million)
Chart on Liquid - Year-over-year growth 2025-2030 (%)
Data Table on Liquid - Year-over-year growth 2025-2030 (%)

10.6 Market opportunity by Form Factor

Market opportunity by Form Factor ($ million)
Data Table on Market opportunity by Form Factor ($ million)

11. Customer Landscape

11.1 Customer landscape overview

Analysis of price sensitivity, lifecycle, customer purchase basket, adoption rates, and purchase criteria

12. Geographic Landscape

12.1 Geographic segmentation

Chart on Market share by geography 2025-2030 (%)
Data Table on Market share by geography 2025-2030 (%)

12.2 Geographic comparison

Chart on Geographic comparison
Data Table on Geographic comparison

12.3 APAC - Market size and forecast 2025-2030

Chart on APAC - Market size and forecast 2025-2030 ($ million)
Data Table on APAC - Market size and forecast 2025-2030 ($ million)
Chart on APAC - Year-over-year growth 2025-2030 (%)
Data Table on APAC - Year-over-year growth 2025-2030 (%)
Chart on Regional Comparison - APAC
Data Table on Regional Comparison - APAC

12.3.1 China - Market size and forecast 2025-2030

Chart on China - Market size and forecast 2025-2030 ($ million)
Data Table on China - Market size and forecast 2025-2030 ($ million)
Chart on China - Year-over-year growth 2025-2030 (%)
Data Table on China - Year-over-year growth 2025-2030 (%)

12.3.2 India - Market size and forecast 2025-2030

Chart on India - Market size and forecast 2025-2030 ($ million)
Data Table on India - Market size and forecast 2025-2030 ($ million)
Chart on India - Year-over-year growth 2025-2030 (%)
Data Table on India - Year-over-year growth 2025-2030 (%)

12.3.3 Indonesia - Market size and forecast 2025-2030

Chart on Indonesia - Market size and forecast 2025-2030 ($ million)
Data Table on Indonesia - Market size and forecast 2025-2030 ($ million)
Chart on Indonesia - Year-over-year growth 2025-2030 (%)
Data Table on Indonesia - Year-over-year growth 2025-2030 (%)

12.3.4 Australia - Market size and forecast 2025-2030

Chart on Australia - Market size and forecast 2025-2030 ($ million)
Data Table on Australia - Market size and forecast 2025-2030 ($ million)
Chart on Australia - Year-over-year growth 2025-2030 (%)
Data Table on Australia - Year-over-year growth 2025-2030 (%)

12.3.5 Vietnam - Market size and forecast 2025-2030

Chart on Vietnam - Market size and forecast 2025-2030 ($ million)
Data Table on Vietnam - Market size and forecast 2025-2030 ($ million)
Chart on Vietnam - Year-over-year growth 2025-2030 (%)
Data Table on Vietnam - Year-over-year growth 2025-2030 (%)

12.3.6 Japan - Market size and forecast 2025-2030

Chart on Japan - Market size and forecast 2025-2030 ($ million)
Data Table on Japan - Market size and forecast 2025-2030 ($ million)
Chart on Japan - Year-over-year growth 2025-2030 (%)
Data Table on Japan - Year-over-year growth 2025-2030 (%)

12.4 South America - Market size and forecast 2025-2030

Chart on South America - Market size and forecast 2025-2030 ($ million)
Data Table on South America - Market size and forecast 2025-2030 ($ million)
Chart on South America - Year-over-year growth 2025-2030 (%)
Data Table on South America - Year-over-year growth 2025-2030 (%)
Chart on Regional Comparison - South America
Data Table on Regional Comparison - South America

12.4.1 Brazil - Market size and forecast 2025-2030

Chart on Brazil - Market size and forecast 2025-2030 ($ million)
Data Table on Brazil - Market size and forecast 2025-2030 ($ million)
Chart on Brazil - Year-over-year growth 2025-2030 (%)
Data Table on Brazil - Year-over-year growth 2025-2030 (%)

12.4.2 Argentina - Market size and forecast 2025-2030

Chart on Argentina - Market size and forecast 2025-2030 ($ million)
Data Table on Argentina - Market size and forecast 2025-2030 ($ million)
Chart on Argentina - Year-over-year growth 2025-2030 (%)
Data Table on Argentina - Year-over-year growth 2025-2030 (%)

12.4.3 Colombia - Market size and forecast 2025-2030

Chart on Colombia - Market size and forecast 2025-2030 ($ million)
Data Table on Colombia - Market size and forecast 2025-2030 ($ million)
Chart on Colombia - Year-over-year growth 2025-2030 (%)
Data Table on Colombia - Year-over-year growth 2025-2030 (%)

12.5 North America - Market size and forecast 2025-2030

Chart on North America - Market size and forecast 2025-2030 ($ million)
Data Table on North America - Market size and forecast 2025-2030 ($ million)
Chart on North America - Year-over-year growth 2025-2030 (%)
Data Table on North America - Year-over-year growth 2025-2030 (%)
Chart on Regional Comparison - North America
Data Table on Regional Comparison - North America

12.5.1 US - Market size and forecast 2025-2030

Chart on US - Market size and forecast 2025-2030 ($ million)
Data Table on US - Market size and forecast 2025-2030 ($ million)
Chart on US - Year-over-year growth 2025-2030 (%)
Data Table on US - Year-over-year growth 2025-2030 (%)

12.5.2 Canada - Market size and forecast 2025-2030

Chart on Canada - Market size and forecast 2025-2030 ($ million)
Data Table on Canada - Market size and forecast 2025-2030 ($ million)
Chart on Canada - Year-over-year growth 2025-2030 (%)
Data Table on Canada - Year-over-year growth 2025-2030 (%)

12.5.3 Mexico - Market size and forecast 2025-2030

Chart on Mexico - Market size and forecast 2025-2030 ($ million)
Data Table on Mexico - Market size and forecast 2025-2030 ($ million)
Chart on Mexico - Year-over-year growth 2025-2030 (%)
Data Table on Mexico - Year-over-year growth 2025-2030 (%)

12.6 Europe - Market size and forecast 2025-2030

Chart on Europe - Market size and forecast 2025-2030 ($ million)
Data Table on Europe - Market size and forecast 2025-2030 ($ million)
Chart on Europe - Year-over-year growth 2025-2030 (%)
Data Table on Europe - Year-over-year growth 2025-2030 (%)
Chart on Regional Comparison - Europe
Data Table on Regional Comparison - Europe

12.6.1 France - Market size and forecast 2025-2030

Chart on France - Market size and forecast 2025-2030 ($ million)
Data Table on France - Market size and forecast 2025-2030 ($ million)
Chart on France - Year-over-year growth 2025-2030 (%)
Data Table on France - Year-over-year growth 2025-2030 (%)

12.6.2 Germany - Market size and forecast 2025-2030

Chart on Germany - Market size and forecast 2025-2030 ($ million)
Data Table on Germany - Market size and forecast 2025-2030 ($ million)
Chart on Germany - Year-over-year growth 2025-2030 (%)
Data Table on Germany - Year-over-year growth 2025-2030 (%)

12.6.3 Russia - Market size and forecast 2025-2030

Chart on Russia - Market size and forecast 2025-2030 ($ million)
Data Table on Russia - Market size and forecast 2025-2030 ($ million)
Chart on Russia - Year-over-year growth 2025-2030 (%)
Data Table on Russia - Year-over-year growth 2025-2030 (%)

12.6.4 Spain - Market size and forecast 2025-2030

Chart on Spain - Market size and forecast 2025-2030 ($ million)
Data Table on Spain - Market size and forecast 2025-2030 ($ million)
Chart on Spain - Year-over-year growth 2025-2030 (%)
Data Table on Spain - Year-over-year growth 2025-2030 (%)

12.6.5 Italy - Market size and forecast 2025-2030

Chart on Italy - Market size and forecast 2025-2030 ($ million)
Data Table on Italy - Market size and forecast 2025-2030 ($ million)
Chart on Italy - Year-over-year growth 2025-2030 (%)
Data Table on Italy - Year-over-year growth 2025-2030 (%)

12.6.6 Poland - Market size and forecast 2025-2030

Chart on Poland - Market size and forecast 2025-2030 ($ million)
Data Table on Poland - Market size and forecast 2025-2030 ($ million)
Chart on Poland - Year-over-year growth 2025-2030 (%)
Data Table on Poland - Year-over-year growth 2025-2030 (%)

12.7 Middle East and Africa - Market size and forecast 2025-2030

Chart on Middle East and Africa - Market size and forecast 2025-2030 ($ million)
Data Table on Middle East and Africa - Market size and forecast 2025-2030 ($ million)
Chart on Middle East and Africa - Year-over-year growth 2025-2030 (%)
Data Table on Middle East and Africa - Year-over-year growth 2025-2030 (%)
Chart on Regional Comparison - Middle East and Africa
Data Table on Regional Comparison - Middle East and Africa

12.7.1 Saudi Arabia - Market size and forecast 2025-2030

Chart on Saudi Arabia - Market size and forecast 2025-2030 ($ million)
Data Table on Saudi Arabia - Market size and forecast 2025-2030 ($ million)
Chart on Saudi Arabia - Year-over-year growth 2025-2030 (%)
Data Table on Saudi Arabia - Year-over-year growth 2025-2030 (%)

12.7.2 UAE - Market size and forecast 2025-2030

Chart on UAE - Market size and forecast 2025-2030 ($ million)
Data Table on UAE - Market size and forecast 2025-2030 ($ million)
Chart on UAE - Year-over-year growth 2025-2030 (%)
Data Table on UAE - Year-over-year growth 2025-2030 (%)

12.7.3 South Africa - Market size and forecast 2025-2030

Chart on South Africa - Market size and forecast 2025-2030 ($ million)
Data Table on South Africa - Market size and forecast 2025-2030 ($ million)
Chart on South Africa - Year-over-year growth 2025-2030 (%)
Data Table on South Africa - Year-over-year growth 2025-2030 (%)

12.7.4 Turkey - Market size and forecast 2025-2030

Chart on Turkey - Market size and forecast 2025-2030 ($ million)
Data Table on Turkey - Market size and forecast 2025-2030 ($ million)
Chart on Turkey - Year-over-year growth 2025-2030 (%)
Data Table on Turkey - Year-over-year growth 2025-2030 (%)

12.7.5 Egypt - Market size and forecast 2025-2030

Chart on Egypt - Market size and forecast 2025-2030 ($ million)
Data Table on Egypt - Market size and forecast 2025-2030 ($ million)
Chart on Egypt - Year-over-year growth 2025-2030 (%)
Data Table on Egypt - Year-over-year growth 2025-2030 (%)

12.8 Market opportunity by geography

Market opportunity by geography ($ million)
Data Tables on Market opportunity by geography ($ million)

13. Drivers, Challenges, and Opportunity

13.1 Market drivers

Increasing global population and inescapable food demand
Shrinking arable land and imperative for yield intensification
Adoption of modern agricultural practices and balanced fertilization

13.2 Market challenges

Finite phosphate rock reserves and geopolitical concentration
Stringent environmental regulations and nutrient management
Volatility in raw material and energy costs

13.3 Impact of drivers and challenges

Impact of drivers and challenges in 2025 and 2030

13.4 Market opportunities

Increasing adoption of enhanced efficiency fertilizers
Development of circular economy through nutrient recycling
Integration with digital farming and precision agriculture platforms

14. Competitive Landscape

14.1 Overview

14.2

Overview on criticality of inputs and factors of differentiation

14.3 Landscape disruption

Overview on factors of disruption

14.4 Industry risks

Impact of key risks on business

15. Competitive Analysis

15.1 Companies profiled

Companies covered

15.2 Company ranking index

15.3 Market positioning of companies

Matrix on companies position and classification

15.4 China BlueChemical Ltd.

China BlueChemical Ltd. - Overview
China BlueChemical Ltd. - Product / Service
China BlueChemical Ltd. - Key offerings
SWOT

15.5 Coromandel International Ltd.

Coromandel International Ltd. - Overview
Coromandel International Ltd. - Business segments
Coromandel International Ltd. - Key offerings
Coromandel International Ltd. - Segment focus
SWOT

15.6 EuroChem Group AG

EuroChem Group AG - Overview
EuroChem Group AG - Product / Service
EuroChem Group AG - Key offerings
SWOT

15.7 Fertiberia SA

Fertiberia SA - Overview
Fertiberia SA - Product / Service
Fertiberia SA - Key offerings
SWOT

15.8 GPC Group

GPC Group - Overview
GPC Group - Product / Service
GPC Group - Key offerings
SWOT

15.9 Hubei Xingfa Chemicals Group

Hubei Xingfa Chemicals Group - Overview
Hubei Xingfa Chemicals Group - Product / Service
Hubei Xingfa Chemicals Group - Key offerings
SWOT

15.10 Indorama Corp.

Indorama Corp. - Overview
Indorama Corp. - Product / Service
Indorama Corp. - Key offerings
SWOT

15.11 Israel Chemicals Ltd.

Israel Chemicals Ltd. - Overview
Israel Chemicals Ltd. - Business segments
Israel Chemicals Ltd. - Key news
Israel Chemicals Ltd. - Key offerings
Israel Chemicals Ltd. - Segment focus
SWOT

15.12 Jordan Phosphate Mines Co. PLC

Jordan Phosphate Mines Co. PLC - Overview
Jordan Phosphate Mines Co. PLC - Business segments
Jordan Phosphate Mines Co. PLC - Key offerings
Jordan Phosphate Mines Co. PLC - Segment focus
SWOT

15.13 Kazphosphate LLP

Kazphosphate LLP - Overview
Kazphosphate LLP - Product / Service
Kazphosphate LLP - Key offerings
SWOT

15.14 Saudi Arabian Mining Co.

Saudi Arabian Mining Co. - Overview
Saudi Arabian Mining Co. - Business segments
Saudi Arabian Mining Co. - Key offerings
Saudi Arabian Mining Co. - Segment focus
SWOT

15.15 The Mosaic Co.

The Mosaic Co. - Overview
The Mosaic Co. - Business segments
The Mosaic Co. - Key offerings
The Mosaic Co. - Segment focus
SWOT

15.16 Wengfu Group Co Ltd

Wengfu Group Co Ltd - Overview
Wengfu Group Co Ltd - Product / Service
Wengfu Group Co Ltd - Key offerings
SWOT

15.17 Yara International ASA

Yara International ASA - Overview
Yara International ASA - Business segments
Yara International ASA - Key offerings
Yara International ASA - Segment focus
SWOT

15.18 Yunnan Yuntianhua Co Ltd

Yunnan Yuntianhua Co Ltd - Overview
Yunnan Yuntianhua Co Ltd - Product / Service
Yunnan Yuntianhua Co Ltd - Key offerings
SWOT

16. Appendix

16.1 Scope of the report

Market definition
Objectives
Notes and caveats

16.2 Inclusions and exclusions checklist

Inclusions checklist
Exclusions checklist

16.3 Currency conversion rates for US$

16.4 Research methodology

16.5 Data procurement

Information sources

16.6 Data validation

16.7 Validation techniques employed for market sizing

16.8 Data synthesis

16.9 360 degree market analysis

16.10 List of abbreviations

Research Methodology

Technavio presents a detailed picture of the market by way of study, synthesis, and summation of data from multiple sources. The analysts have presented the various facets of the market with a particular focus on identifying the key industry influencers. The data thus presented is comprehensive, reliable, and the result of extensive research, both primary and secondary.

INFORMATION SOURCES

Primary sources

  • Manufacturers and suppliers
  • Channel partners
  • Industry experts
  • Strategic decision makers

Secondary sources

  • Industry journals and periodicals
  • Government data
  • Financial reports of key industry players
  • Historical data
  • Press releases

DATA ANALYSIS

Data Synthesis

  • Collation of data
  • Estimation of key figures
  • Analysis of derived insights

Data Validation

  • Triangulation with data models
  • Reference against proprietary databases
  • Corroboration with industry experts

REPORT WRITING

Qualitative

  • Market drivers
  • Market challenges
  • Market trends
  • Five forces analysis

Quantitative

  • Market size and forecast
  • Market segmentation
  • Geographical insights
  • Competitive landscape

Interested in this report?

Get your sample now to see our research methodology and insights!

Download Now

Frequently Asked Questions

Phosphorus Fertilizers market growth will increase by USD 12751.1 million during 2026-2030.

The Phosphorus Fertilizers market is expected to grow at a CAGR of 4.9% during 2026-2030.

Phosphorus Fertilizers market is segmented by Application (Grain and oilseed, Fruits and vegetables, Others) Product (Diammonium phosphate, Monoammonium phosphate, Single super phosphate, Triple super phosphate, Others) Form factor (Granular, Powder, Liquid)

China BlueChemical Ltd., Coromandel International Ltd., EuroChem Group AG, Fertiberia SA, GPC Group, Hubei Xingfa Chemicals Group, Indorama Corp., Israel Chemicals Ltd., Jordan Phosphate Mines Co. PLC, Kazphosphate LLP, National Fertilizers Ltd., Nutrien Ltd., OCI NV, OCP Group, Paradeep Phosphates Ltd., Saudi Arabian Mining Co., The Mosaic Co., Wengfu Group Co Ltd, Yara International ASA, Yunnan Yuntianhua Co Ltd are a few of the key vendors in the Phosphorus Fertilizers market.

APAC will register the highest growth rate of 57.5% among the other regions. Therefore, the Phosphorus Fertilizers market in APAC is expected to garner significant business opportunities for the vendors during the forecast period.

China, India, Indonesia, Australia, Vietnam, Japan, Brazil, Argentina, Colombia, US, Canada, Mexico, France, Germany, Russia, Spain, Italy, Poland, Saudi Arabia, UAE, South Africa, Turkey, Egypt

  • Increasing global population and inescapable food demand is the driving factor this market.

The Phosphorus Fertilizers market vendors should focus on grabbing business opportunities from the Application segment as it accounted for the largest market share in the base year.
RIA - Research AI Assistant
Ask RIA
