Immunotherapy Drugs Market Analysis, Size, and Forecast 2025-2029: North America (US, Canada, and Mexico), Europe (Germany, UK, and France), APAC (China, Japan, and India), South America (Brazil), Middle East and Africa (Saudi Arabia, South Africa, and Turkey), Asia, Rest of World (ROW)

Immunotherapy Drugs Market Analysis, Size, and Forecast 2025-2029:
North America (US, Canada, and Mexico), Europe (Germany, UK, and France), APAC (China, Japan, and India), South America (Brazil), Middle East and Africa (Saudi Arabia, South Africa, and Turkey), Asia, Rest of World (ROW)

Published: Dec 2025 295 Pages SKU: IRTNTR76823

Market Overview at a Glance

$220.79 B
Market Opportunity
12.4%
CAGR 2024 - 2029
45.6%
North America Growth
$139.43 B
Hospitals segment 2023

Immunotherapy Drugs Market Size 2025-2029

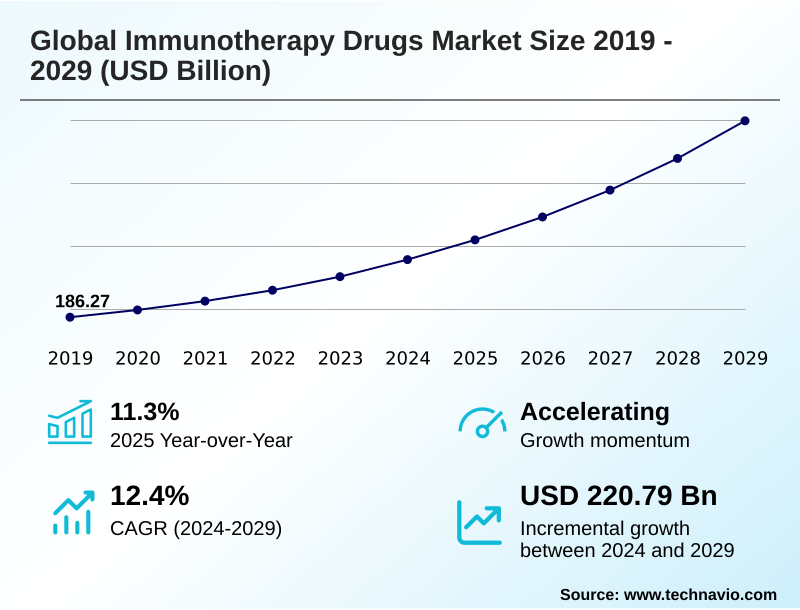
The immunotherapy drugs market size is valued to increase by USD 220.79 billion, at a CAGR of 12.4% from 2024 to 2029. Escalating incidence of chronic diseases and cancer will drive the immunotherapy drugs market.

Major Market Trends & Insights

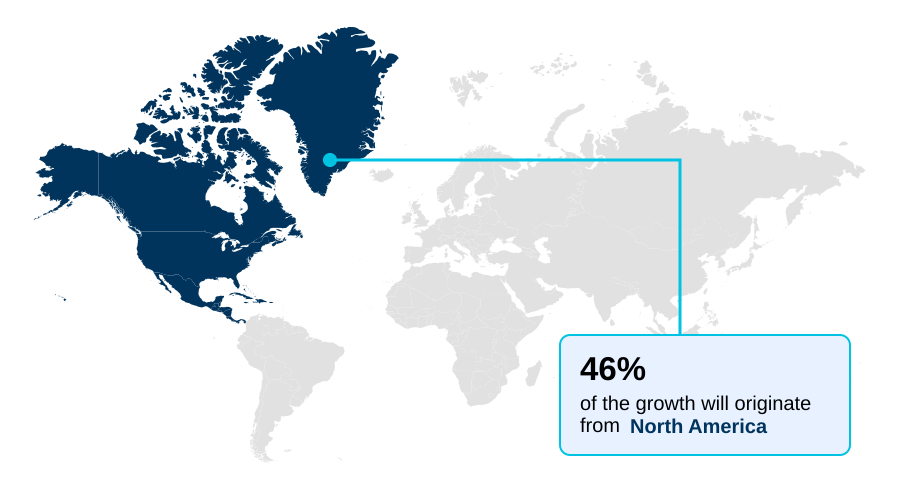
  • North America dominated the market and accounted for a 45.6% growth during the forecast period.
  • By End-user - Hospitals segment was valued at USD 139.43 billion in 2023
  • By Type - Monoclonal antibodies segment accounted for the largest market revenue share in 2023

Market Size & Forecast

  • Market Opportunities: USD 312.42 billion
  • Market Future Opportunities: USD 220.79 billion
  • CAGR from 2024 to 2029 : 12.4%

Market Summary

  • The immunotherapy drugs market is fundamentally reshaping disease treatment by leveraging the body's immune system. This expansion is driven by the increasing prevalence of chronic conditions, particularly cancer, creating a sustained demand for more effective therapies beyond traditional methods. Key innovations defining the market include the rise of personalized neoantigen therapies, such as mrna-based cancer vaccines, and advanced cell-based therapies.
  • For instance, a biopharmaceutical firm specializing in chimeric antigen receptor (car) t-cell therapy must navigate an intricate supply chain. Optimizing this process to reduce vein-to-vein time is a critical business objective, as delays in the cryopreservation supply chain for autologous cell therapy can directly impact patient outcomes. This scenario underscores the operational complexities involved.
  • Despite the transformative potential, the market contends with significant hurdles, including the high cost of treatment, mechanisms of therapeutic resistance, and the logistical challenges of manufacturing personalized medicines at scale, which temper the pace of widespread adoption.

What will be the Size of the Immunotherapy Drugs Market during the forecast period?

Get Key Insights on Market Forecast (PDF) Request Free Sample

How is the Immunotherapy Drugs Market Segmented?

The immunotherapy drugs industry research report provides comprehensive data (region-wise segment analysis), with forecasts and estimates in "USD million" for the period 2025-2029, as well as historical data from 2019-2023 for the following segments.

  • End-user
    • Hospitals
    • Clinics
    • Others
  • Type
    • Monoclonal antibodies
    • Vaccines
    • Immune checkpoint inhibitors
    • Others
  • Therapeutic area
    • Cancer
    • Autoimmune and inflammatory diseases
    • Infectious diseases
    • Others
  • Geography
    • North America
      • US
      • Canada
      • Mexico
    • Europe
      • Germany
      • UK
      • France
    • Asia
    • Rest of World (ROW)

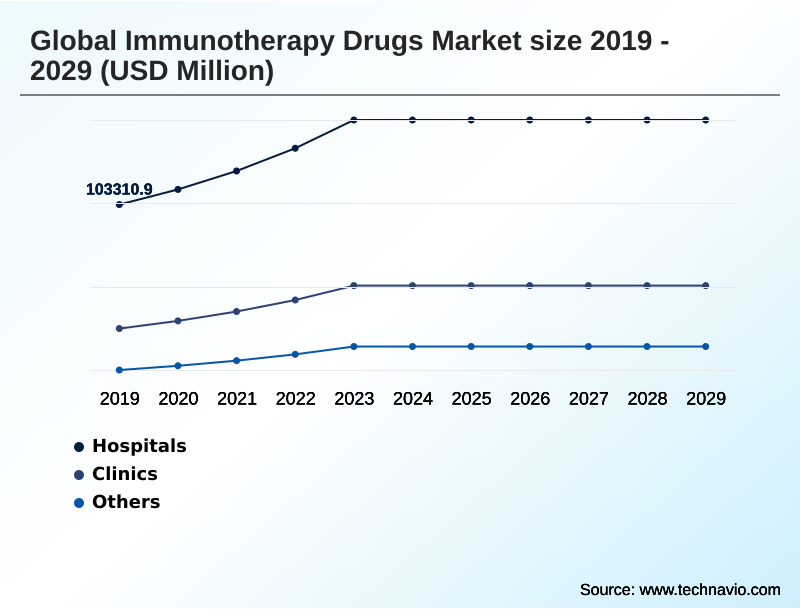
By End-user Insights

The hospitals segment is estimated to witness significant growth during the forecast period.

Hospitals remain the primary setting for administering advanced immunotherapies, particularly complex treatments such as chimeric antigen receptor (car) t-cell therapy.

The infrastructure required for managing potential immune-related adverse events and the severe complication of cytokine release syndrome necessitates this specialized environment. Analysis shows that 79% of autologous cell therapy infusions occur in inpatient settings, reflecting the logistical and clinical intensity.

However, the development of subcutaneous immunotherapy formulations is creating a shift toward outpatient care. Hospitals are navigating this transition through managed entry agreements and by establishing dedicated immuno-oncology toxicity management teams.

These efforts aim to balance the cost-effectiveness of immunotherapy with the complex demands of the cryopreservation supply chain and aseptic processing for biologics.

Request Free Sample

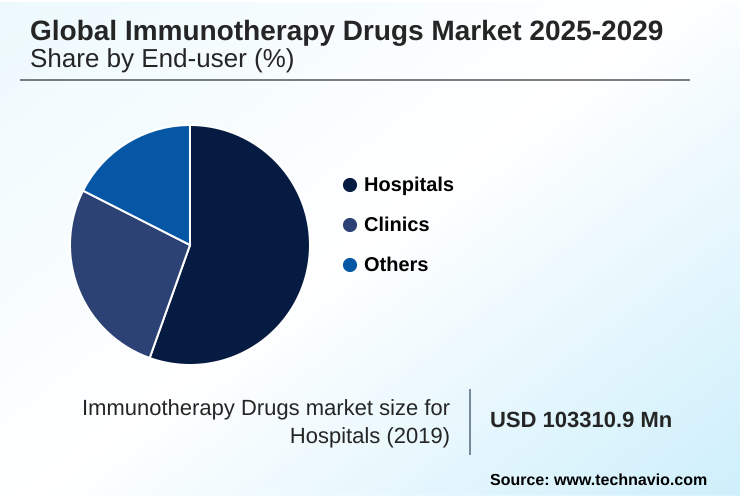
The Hospitals segment was valued at USD 139.43 billion in 2023 and showed a gradual increase during the forecast period.

Request Free Sample

Regional Analysis

North America is estimated to contribute 45.6% to the growth of the global market during the forecast period.Technavio’s analysts have elaborately explained the regional trends and drivers that shape the market during the forecast period.

See How Immunotherapy Drugs Market Demand is Rising in North America Request Free Sample

The geographic landscape of the immunotherapy drugs market is characterized by established leadership and high-growth frontiers.

North America remains the dominant region, accounting for 45.6% of the market's incremental growth, driven by a robust R&D ecosystem and high adoption rates of novel treatments like adoptive cell transfer.

Europe follows, with a strong focus on rigorous clinical validation. However, the Asia Pacific region is emerging as the fastest-growing market, with significant investments in building domestic manufacturing and research capabilities.

Across all regions, a key operational trend is the shift to more efficient administration methods.

The development of targeted immunomodulatory therapies that can be administered in under 10 minutes, a significant reduction from previous infusion times, is expanding access beyond specialized centers.

This evolution, supported by decentralized clinical trials and evolving regulatory pathways for biologics, is democratizing access to advanced treatments.

Market Dynamics

Our researchers analyzed the data with 2024 as the base year, along with the key drivers, trends, and challenges. A holistic analysis of drivers will help companies refine their marketing strategies to gain a competitive advantage.

  • The evolution of the immunotherapy drugs market is marked by a strategic pivot from broad-acting agents to highly specific platforms. This shift is reshaping clinical practice and creating new value streams, but also introduces significant operational complexities.
  • For instance, managing cytokine release syndrome toxicity is a critical competency for centers administering advanced treatments, just as understanding the impact of gut microbiome on checkpoint inhibitors is vital for optimizing patient outcomes. The industry is actively pursuing strategies for overcoming checkpoint inhibitor primary resistance and advancing the use of car-t therapy for solid tumor treatment.
  • A key focus is on logistical and manufacturing hurdles, including scaling autologous cell therapy manufacturing and navigating the complex regulatory approval for bispecific antibodies. The cost-benefit analysis of combination immunotherapies and the development of value-based pricing for cancer immunotherapies are central to ensuring market access.
  • A stark operational contrast exists between the rapid deployment of subcutaneous delivery of monoclonal antibodies, which takes minutes, and the weeks-long, logistically intensive process for personalized cell therapies, which impacts facility planning and resource allocation. This highlights the ongoing need for innovation in both therapeutic design and delivery.

What are the key market drivers leading to the rise in the adoption of Immunotherapy Drugs Industry?

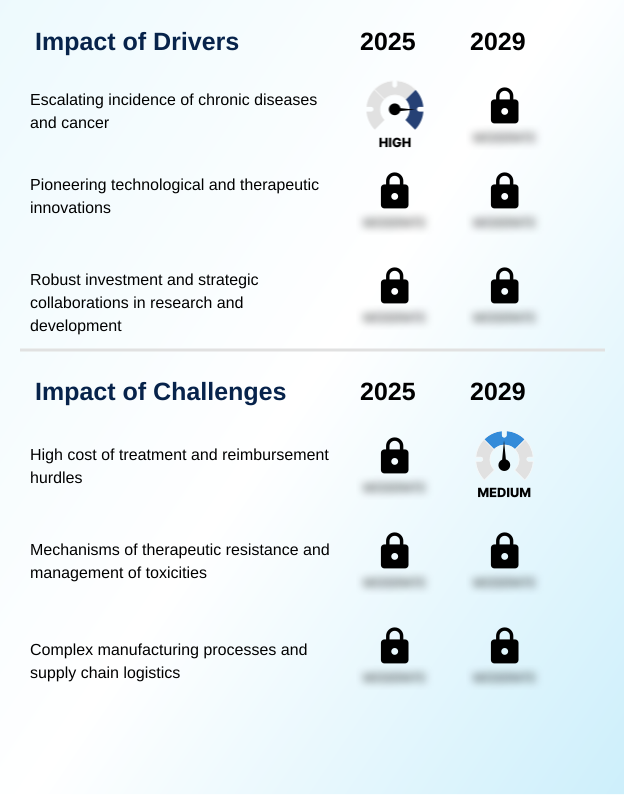
  • The escalating global incidence of chronic diseases and cancer serves as a key driver for the immunotherapy drugs market.

  • Pioneering technological innovation and robust R&D investment are primary market drivers, leading to more effective therapeutic options. The evolution of monoclonal antibodies into sophisticated antibody-drug conjugates and other therapeutic cancer vaccines is broadening the range of treatable conditions.
  • The application of AI is accelerating drug discovery, enabling faster identification of candidates for combination immunotherapy strategies.
  • This focus on innovation translates directly into improved patient outcomes; certain biomarker-driven patient selection strategies for new therapies have demonstrated an ability to improve recurrence-free survival by over 40% compared to previous standards of care.
  • Furthermore, the systematic collection of real-world evidence is helping to build compelling cases for value-based healthcare models, ensuring that novel treatments like those involving tumor-infiltrating lymphocytes gain reimbursement and wider adoption.

What are the market trends shaping the Immunotherapy Drugs Industry?

  • The ascendancy of personalized cancer vaccines marks an important upcoming market trend. This approach signifies a critical shift toward developing highly individualized treatments in oncology.

  • Key trends are reshaping the market, driven by the pursuit of highly personalized medicine in oncology. The development of personalized neoantigen therapies, particularly mrna-based cancer vaccines, is at the forefront, with some combination approaches demonstrating a 44% reduction in recurrence risk for certain cancers.
  • This move toward specificity is also evident in the rise of bispecific antibodies, which employ dual-targeting mechanisms to enhance efficacy. Concurrently, innovations in delivery, such as subcutaneous formulations, are reducing administration times from over 30 minutes to less than 10, expanding treatment accessibility beyond hospitals.
  • These advancements, coupled with progress in oncolytic virus therapy and next-generation biotherapeutics, are broadening the scope of pan-cancer treatment approaches and accelerating advancements in cell therapy manufacturing.

What challenges does the Immunotherapy Drugs Industry face during its growth?

  • The high cost of treatment and complex reimbursement hurdles present a key challenge affecting the industry's growth trajectory.

  • Significant challenges constrain market growth, primarily related to therapeutic resistance and manufacturing complexity. Many patients develop therapeutic resistance mechanisms, creating a need for strategies aimed at overcoming checkpoint inhibitor resistance to agents like pd-1/pd-l1 inhibitors. Furthermore, the logistics for advanced cell-based therapies are formidable.
  • The expansion of car-t for solid tumors is hampered by manufacturing bottlenecks, with a notable percentage of patients facing significant wait times. The process requires a robust cold chain logistics for cell therapy and highly controlled environments, with analysis showing nearly 80% of treatments necessitate costly inpatient administration.
  • Developing scalable manufacturing for emerging allogeneic car-t therapies using automated bioreactor systems is a critical priority to address these operational and cost hurdles.

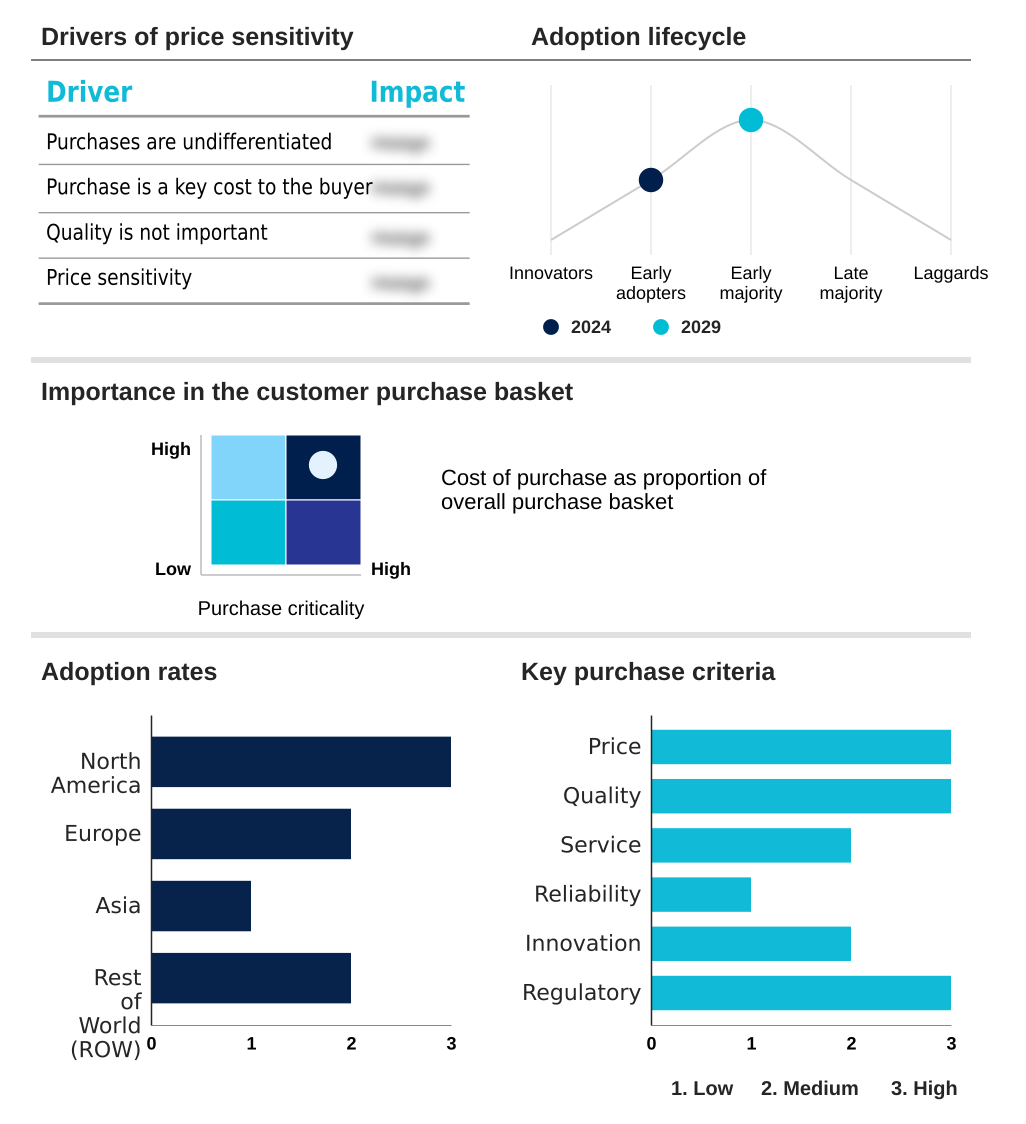
Exclusive Technavio Analysis on Customer Landscape

The immunotherapy drugs market forecasting report includes the adoption lifecycle of the market, covering from the innovator’s stage to the laggard’s stage. It focuses on adoption rates in different regions based on penetration. Furthermore, the immunotherapy drugs market report also includes key purchase criteria and drivers of price sensitivity to help companies evaluate and develop their market growth analysis strategies.

Customer Landscape of Immunotherapy Drugs Industry

Competitive Landscape

Companies are implementing various strategies, such as strategic alliances, immunotherapy drugs market forecast, partnerships, mergers and acquisitions, geographical expansion, and product/service launches, to enhance their presence in the industry.

AbbVie Inc. - A portfolio focused on discovering, developing, and commercializing pharmaceutical products includes key immunotherapy drugs designed to address complex diseases through innovative biological mechanisms.

The industry research and growth report includes detailed analyses of the competitive landscape of the market and information about key companies, including:

  • AbbVie Inc.
  • Amgen Inc.
  • AstraZeneca Plc
  • Bayer AG
  • BioNTech SE
  • Boehringer Ingelheim GmbH
  • Bristol Myers Squibb Co.
  • Celldex Therapeutics Inc
  • F. Hoffmann La Roche Ltd.
  • Genmab AS
  • Gilead Sciences Inc.
  • GlaxoSmithKline Plc
  • Incyte Corp.
  • Johnson and Johnson Services
  • Novartis AG
  • Pfizer Inc.
  • Sanofi SA
  • Teva Pharmaceutical Ltd.

Qualitative and quantitative analysis of companies has been conducted to help clients understand the wider business environment as well as the strengths and weaknesses of key industry players. Data is qualitatively analyzed to categorize companies as pure play, category-focused, industry-focused, and diversified; it is quantitatively analyzed to categorize companies as dominant, leading, strong, tentative, and weak.

Recent Development and News in Immunotherapy drugs market

  • In August 2024, Galapagos and Adaptimmune Therapeutics announced a strategic collaboration valued at up to USD 665 million, granting Galapagos exclusive rights to a next-generation T-cell receptor T-cell therapy.
  • In November 2024, the European Medicines Agency's committee recommended extending the indications for the nivolumab and ipilimumab combination to treat certain types of colorectal cancer.
  • In April 2025, Health Canada approved the combination of pembrolizumab and chemotherapy for treating unresectable advanced or metastatic malignant pleural mesothelioma, providing a new first-line option.
  • In May 2025, ANVISA authorized the continuation of a landmark domestic Brazilian clinical trial for a CAR-T cell therapy, expanding patient recruitment to a second phase across multiple centers.

Dive into Technavio’s robust research methodology, blending expert interviews, extensive data synthesis, and validated models for unparalleled Immunotherapy Drugs Market insights. See full methodology.

Market Scope
Page number 295
Base year 2024
Historic period 2019-2023
Forecast period 2025-2029
Growth momentum & CAGR Accelerate at a CAGR of 12.4%
Market growth 2025-2029 USD 220790.9 million
Market structure Fragmented
YoY growth 2024-2025(%) 11.3%
Key countries US, Canada, Mexico, Germany, UK, France, Italy, Russia, Spain, The Netherlands, China, Japan, India, South Korea, Singapore, Indonesia, Thailand, Brazil, Saudi Arabia, South Africa, Turkey, UAE and Australia
Competitive landscape Leading Companies, Market Positioning of Companies, Competitive Strategies, and Industry Risks

Request Free Sample

Research Analyst Overview

  • The immunotherapy drugs market is defined by a rapid innovation cycle, shifting the therapeutic paradigm toward highly personalized and potent treatments. Boardroom strategy is increasingly focused on acquiring and developing platforms for personalized neoantigen therapies and next-generation agents like bispecific antibodies and antibody-drug conjugates, which offer dual-targeting mechanisms.
  • A key clinical development fueling this investment is the success of mrna-based cancer vaccines, which, in some trials, reduced melanoma recurrence risk by 44%. This landscape includes a diverse arsenal, from established monoclonal antibodies and immune checkpoint inhibitors (pd-1/pd-l1 inhibitors and ctla-4 inhibitors) to advanced modalities like chimeric antigen receptor (car) t-cell therapy and oncolytic virus therapy.
  • The scientific frontier involves modulating the host immune system and the tumor microenvironment, with ongoing research into adoptive cell transfer, t-cell receptor therapies, and tumor-infiltrating lymphocytes.
  • However, managing immune-related adverse events and the potentially severe cytokine release syndrome remains a clinical priority across all cell-based therapies, including both autologous cell therapy and emerging allogeneic car-t therapies, driving demand for new subcutaneous immunotherapy formulations.

What are the Key Data Covered in this Immunotherapy Drugs Market Research and Growth Report?

  • What is the expected growth of the Immunotherapy Drugs Market between 2025 and 2029?

    • USD 220.79 billion, at a CAGR of 12.4%

  • What segmentation does the market report cover?

    • The report is segmented by End-user (Hospitals, Clinics, and Others), Type (Monoclonal antibodies, Vaccines, Immune checkpoint inhibitors, and Others), Therapeutic Area (Cancer, Autoimmune and inflammatory diseases, Infectious diseases, and Others) and Geography (North America, Europe, Asia, Rest of World (ROW))

  • Which regions are analyzed in the report?

    • North America, Europe, Asia and Rest of World (ROW)

  • What are the key growth drivers and market challenges?

    • Escalating incidence of chronic diseases and cancer, High cost of treatment and reimbursement hurdles

  • Who are the major players in the Immunotherapy Drugs Market?

    • AbbVie Inc., Amgen Inc., AstraZeneca Plc, Bayer AG, BioNTech SE, Boehringer Ingelheim GmbH, Bristol Myers Squibb Co., Celldex Therapeutics Inc, F. Hoffmann La Roche Ltd., Genmab AS, Gilead Sciences Inc., GlaxoSmithKline Plc, Incyte Corp., Johnson and Johnson Services, Novartis AG, Pfizer Inc., Sanofi SA and Teva Pharmaceutical Ltd.

Market Research Insights

  • Market dynamics are shaped by a push toward personalized medicine in oncology and more efficient administration. For example, advancements in subcutaneous immunotherapy formulations have reduced administration times from over 30 minutes to under 10, a significant operational improvement for clinics.
  • Concurrently, the development of next-generation biotherapeutics, informed by genomic sequencing for neoantigens and biomarker-driven patient selection, is leading to better patient outcomes. Certain combination immunotherapy strategies have demonstrated a 44% reduction in recurrence risk in high-risk patient cohorts. However, addressing therapeutic resistance mechanisms and improving the cost-effectiveness of immunotherapy remain central to expanding access.
  • As the field matures, value-based healthcare models and managed entry agreements are becoming crucial for integrating these high-cost, high-efficacy treatments into standard care, balancing innovation with fiscal responsibility.

We can help! Our analysts can customize this immunotherapy drugs market research report to meet your requirements.

Get in touch

1. Executive Summary

1.1 Market overview

Executive Summary - Chart on Market Overview
Executive Summary - Data Table on Market Overview
Executive Summary - Chart on Global Market Characteristics
Executive Summary - Chart on Market by Geography
Executive Summary - Chart on Market Segmentation by End-user
Executive Summary - Chart on Market Segmentation by Type
Executive Summary - Chart on Market Segmentation by Therapeutic Area
Executive Summary - Chart on Incremental Growth
Executive Summary - Data Table on Incremental Growth
Executive Summary - Chart on Company Market Positioning

2. Technavio Analysis

2.1 Analysis of price sensitivity, lifecycle, customer purchase basket, adoption rates, and purchase criteria

2.2 Criticality of inputs and Factors of differentiation

Chart on Overview on criticality of inputs and factors of differentiation

2.3 Factors of disruption

Chart on Overview on factors of disruption

2.4 Impact of drivers and challenges

Chart on Impact of drivers and challenges in 2024 and 2029

3. Market Landscape

3.1 Market ecosystem

Chart on Parent Market
Data Table on - Parent Market

3.2 Market characteristics

Chart on Market characteristics analysis

3.3 Value chain analysis

Chart on Value chain analysis

4. Market Sizing

4.1 Market definition

Data Table on Offerings of companies included in the market definition

4.2 Market segment analysis

Market segments

4.3 Market size 2024

4.4 Market outlook: Forecast for 2024-2029

Chart on Global - Market size and forecast 2024-2029 ($ million)
Data Table on Global - Market size and forecast 2024-2029 ($ million)
Chart on Global Market: Year-over-year growth 2024-2029 (%)
Data Table on Global Market: Year-over-year growth 2024-2029 (%)

5. Historic Market Size

5.1 Global Immunotherapy Drugs Market 2019 - 2023

Historic Market Size - Data Table on Global Immunotherapy Drugs Market 2019 - 2023 ($ million)

5.2 End-user segment analysis 2019 - 2023

Historic Market Size - End-user Segment 2019 - 2023 ($ million)

5.3 Type segment analysis 2019 - 2023

Historic Market Size - Type Segment 2019 - 2023 ($ million)

5.4 Therapeutic Area segment analysis 2019 - 2023

Historic Market Size - Therapeutic Area Segment 2019 - 2023 ($ million)

5.5 Geography segment analysis 2019 - 2023

Historic Market Size - Geography Segment 2019 - 2023 ($ million)

5.6 Country segment analysis 2019 - 2023

Historic Market Size - Country Segment 2019 - 2023 ($ million)

6. Qualitative Analysis

6.1 Impact of AI in global immunotherapy drugs market

7. Five Forces Analysis

7.1 Five forces summary

Five forces analysis - Comparison between 2024 and 2029

7.2 Bargaining power of buyers

Bargaining power of buyers - Impact of key factors 2024 and 2029

7.3 Bargaining power of suppliers

Bargaining power of suppliers - Impact of key factors in 2024 and 2029

7.4 Threat of new entrants

Threat of new entrants - Impact of key factors in 2024 and 2029

7.5 Threat of substitutes

Threat of substitutes - Impact of key factors in 2024 and 2029

7.6 Threat of rivalry

Threat of rivalry - Impact of key factors in 2024 and 2029

7.7 Market condition

Chart on Market condition - Five forces 2024 and 2029

8. Market Segmentation by End-user

8.1 Market segments

Chart on End-user - Market share 2024-2029 (%)
Data Table on End-user - Market share 2024-2029 (%)

8.2 Comparison by End-user

Chart on Comparison by End-user
Data Table on Comparison by End-user

8.3 Hospitals - Market size and forecast 2024-2029

Chart on Hospitals - Market size and forecast 2024-2029 ($ million)
Data Table on Hospitals - Market size and forecast 2024-2029 ($ million)
Chart on Hospitals - Year-over-year growth 2024-2029 (%)
Data Table on Hospitals - Year-over-year growth 2024-2029 (%)

8.4 Clinics - Market size and forecast 2024-2029

Chart on Clinics - Market size and forecast 2024-2029 ($ million)
Data Table on Clinics - Market size and forecast 2024-2029 ($ million)
Chart on Clinics - Year-over-year growth 2024-2029 (%)
Data Table on Clinics - Year-over-year growth 2024-2029 (%)

8.5 Others - Market size and forecast 2024-2029

Chart on Others - Market size and forecast 2024-2029 ($ million)
Data Table on Others - Market size and forecast 2024-2029 ($ million)
Chart on Others - Year-over-year growth 2024-2029 (%)
Data Table on Others - Year-over-year growth 2024-2029 (%)

8.6 Market opportunity by End-user

Market opportunity by End-user ($ million)
Data Table on Market opportunity by End-user ($ million)

9. Market Segmentation by Type

9.1 Market segments

Chart on Type - Market share 2024-2029 (%)
Data Table on Type - Market share 2024-2029 (%)

9.2 Comparison by Type

Chart on Comparison by Type
Data Table on Comparison by Type

9.3 Monoclonal antibodies - Market size and forecast 2024-2029

Chart on Monoclonal antibodies - Market size and forecast 2024-2029 ($ million)
Data Table on Monoclonal antibodies - Market size and forecast 2024-2029 ($ million)
Chart on Monoclonal antibodies - Year-over-year growth 2024-2029 (%)
Data Table on Monoclonal antibodies - Year-over-year growth 2024-2029 (%)

9.4 Vaccines - Market size and forecast 2024-2029

Chart on Vaccines - Market size and forecast 2024-2029 ($ million)
Data Table on Vaccines - Market size and forecast 2024-2029 ($ million)
Chart on Vaccines - Year-over-year growth 2024-2029 (%)
Data Table on Vaccines - Year-over-year growth 2024-2029 (%)

9.5 Immune checkpoint inhibitors - Market size and forecast 2024-2029

Chart on Immune checkpoint inhibitors - Market size and forecast 2024-2029 ($ million)
Data Table on Immune checkpoint inhibitors - Market size and forecast 2024-2029 ($ million)
Chart on Immune checkpoint inhibitors - Year-over-year growth 2024-2029 (%)
Data Table on Immune checkpoint inhibitors - Year-over-year growth 2024-2029 (%)

9.6 Others - Market size and forecast 2024-2029

Chart on Others - Market size and forecast 2024-2029 ($ million)
Data Table on Others - Market size and forecast 2024-2029 ($ million)
Chart on Others - Year-over-year growth 2024-2029 (%)
Data Table on Others - Year-over-year growth 2024-2029 (%)

9.7 Market opportunity by Type

Market opportunity by Type ($ million)
Data Table on Market opportunity by Type ($ million)

10. Market Segmentation by Therapeutic Area

10.1 Market segments

Chart on Therapeutic Area - Market share 2024-2029 (%)
Data Table on Therapeutic Area - Market share 2024-2029 (%)

10.2 Comparison by Therapeutic Area

Chart on Comparison by Therapeutic Area
Data Table on Comparison by Therapeutic Area

10.3 Cancer - Market size and forecast 2024-2029

Chart on Cancer - Market size and forecast 2024-2029 ($ million)
Data Table on Cancer - Market size and forecast 2024-2029 ($ million)
Chart on Cancer - Year-over-year growth 2024-2029 (%)
Data Table on Cancer - Year-over-year growth 2024-2029 (%)

10.4 Autoimmune and inflammatory diseases - Market size and forecast 2024-2029

Chart on Autoimmune and inflammatory diseases - Market size and forecast 2024-2029 ($ million)
Data Table on Autoimmune and inflammatory diseases - Market size and forecast 2024-2029 ($ million)
Chart on Autoimmune and inflammatory diseases - Year-over-year growth 2024-2029 (%)
Data Table on Autoimmune and inflammatory diseases - Year-over-year growth 2024-2029 (%)

10.5 Infectious diseases - Market size and forecast 2024-2029

Chart on Infectious diseases - Market size and forecast 2024-2029 ($ million)
Data Table on Infectious diseases - Market size and forecast 2024-2029 ($ million)
Chart on Infectious diseases - Year-over-year growth 2024-2029 (%)
Data Table on Infectious diseases - Year-over-year growth 2024-2029 (%)

10.6 Others - Market size and forecast 2024-2029

Chart on Others - Market size and forecast 2024-2029 ($ million)
Data Table on Others - Market size and forecast 2024-2029 ($ million)
Chart on Others - Year-over-year growth 2024-2029 (%)
Data Table on Others - Year-over-year growth 2024-2029 (%)

10.7 Market opportunity by Therapeutic Area

Market opportunity by Therapeutic Area ($ million)
Data Table on Market opportunity by Therapeutic Area ($ million)

11. Customer Landscape

11.1 Customer landscape overview

Analysis of price sensitivity, lifecycle, customer purchase basket, adoption rates, and purchase criteria

12. Geographic Landscape

12.1 Geographic segmentation

Chart on Market share by geography 2024-2029 (%)
Data Table on Market share by geography 2024-2029 (%)

12.2 Geographic comparison

Chart on Geographic comparison
Data Table on Geographic comparison

12.3 North America - Market size and forecast 2024-2029

Chart on North America - Market size and forecast 2024-2029 ($ million)
Data Table on North America - Market size and forecast 2024-2029 ($ million)
Chart on North America - Year-over-year growth 2024-2029 (%)
Data Table on North America - Year-over-year growth 2024-2029 (%)
Chart on Regional Comparison - North America
Data Table on Regional Comparison - North America

12.3.1 US - Market size and forecast 2024-2029

Chart on US - Market size and forecast 2024-2029 ($ million)
Data Table on US - Market size and forecast 2024-2029 ($ million)
Chart on US - Year-over-year growth 2024-2029 (%)
Data Table on US - Year-over-year growth 2024-2029 (%)

12.3.2 Canada - Market size and forecast 2024-2029

Chart on Canada - Market size and forecast 2024-2029 ($ million)
Data Table on Canada - Market size and forecast 2024-2029 ($ million)
Chart on Canada - Year-over-year growth 2024-2029 (%)
Data Table on Canada - Year-over-year growth 2024-2029 (%)

12.3.3 Mexico - Market size and forecast 2024-2029

Chart on Mexico - Market size and forecast 2024-2029 ($ million)
Data Table on Mexico - Market size and forecast 2024-2029 ($ million)
Chart on Mexico - Year-over-year growth 2024-2029 (%)
Data Table on Mexico - Year-over-year growth 2024-2029 (%)

12.4 Europe - Market size and forecast 2024-2029

Chart on Europe - Market size and forecast 2024-2029 ($ million)
Data Table on Europe - Market size and forecast 2024-2029 ($ million)
Chart on Europe - Year-over-year growth 2024-2029 (%)
Data Table on Europe - Year-over-year growth 2024-2029 (%)
Chart on Regional Comparison - Europe
Data Table on Regional Comparison - Europe

12.4.1 Germany - Market size and forecast 2024-2029

Chart on Germany - Market size and forecast 2024-2029 ($ million)
Data Table on Germany - Market size and forecast 2024-2029 ($ million)
Chart on Germany - Year-over-year growth 2024-2029 (%)
Data Table on Germany - Year-over-year growth 2024-2029 (%)

12.4.2 UK - Market size and forecast 2024-2029

Chart on UK - Market size and forecast 2024-2029 ($ million)
Data Table on UK - Market size and forecast 2024-2029 ($ million)
Chart on UK - Year-over-year growth 2024-2029 (%)
Data Table on UK - Year-over-year growth 2024-2029 (%)

12.4.3 France - Market size and forecast 2024-2029

Chart on France - Market size and forecast 2024-2029 ($ million)
Data Table on France - Market size and forecast 2024-2029 ($ million)
Chart on France - Year-over-year growth 2024-2029 (%)
Data Table on France - Year-over-year growth 2024-2029 (%)

12.4.4 Italy - Market size and forecast 2024-2029

Chart on Italy - Market size and forecast 2024-2029 ($ million)
Data Table on Italy - Market size and forecast 2024-2029 ($ million)
Chart on Italy - Year-over-year growth 2024-2029 (%)
Data Table on Italy - Year-over-year growth 2024-2029 (%)

12.4.5 Russia - Market size and forecast 2024-2029

Chart on Russia - Market size and forecast 2024-2029 ($ million)
Data Table on Russia - Market size and forecast 2024-2029 ($ million)
Chart on Russia - Year-over-year growth 2024-2029 (%)
Data Table on Russia - Year-over-year growth 2024-2029 (%)

12.4.6 Spain - Market size and forecast 2024-2029

Chart on Spain - Market size and forecast 2024-2029 ($ million)
Data Table on Spain - Market size and forecast 2024-2029 ($ million)
Chart on Spain - Year-over-year growth 2024-2029 (%)
Data Table on Spain - Year-over-year growth 2024-2029 (%)

12.4.7 The Netherlands - Market size and forecast 2024-2029

Chart on The Netherlands - Market size and forecast 2024-2029 ($ million)
Data Table on The Netherlands - Market size and forecast 2024-2029 ($ million)
Chart on The Netherlands - Year-over-year growth 2024-2029 (%)
Data Table on The Netherlands - Year-over-year growth 2024-2029 (%)

12.5 Asia - Market size and forecast 2024-2029

Chart on Asia - Market size and forecast 2024-2029 ($ million)
Data Table on Asia - Market size and forecast 2024-2029 ($ million)
Chart on Asia - Year-over-year growth 2024-2029 (%)
Data Table on Asia - Year-over-year growth 2024-2029 (%)
Chart on Regional Comparison - Asia
Data Table on Regional Comparison - Asia

12.5.1 China - Market size and forecast 2024-2029

Chart on China - Market size and forecast 2024-2029 ($ million)
Data Table on China - Market size and forecast 2024-2029 ($ million)
Chart on China - Year-over-year growth 2024-2029 (%)
Data Table on China - Year-over-year growth 2024-2029 (%)

12.5.2 Japan - Market size and forecast 2024-2029

Chart on Japan - Market size and forecast 2024-2029 ($ million)
Data Table on Japan - Market size and forecast 2024-2029 ($ million)
Chart on Japan - Year-over-year growth 2024-2029 (%)
Data Table on Japan - Year-over-year growth 2024-2029 (%)

12.5.3 India - Market size and forecast 2024-2029

Chart on India - Market size and forecast 2024-2029 ($ million)
Data Table on India - Market size and forecast 2024-2029 ($ million)
Chart on India - Year-over-year growth 2024-2029 (%)
Data Table on India - Year-over-year growth 2024-2029 (%)

12.5.4 South Korea - Market size and forecast 2024-2029

Chart on South Korea - Market size and forecast 2024-2029 ($ million)
Data Table on South Korea - Market size and forecast 2024-2029 ($ million)
Chart on South Korea - Year-over-year growth 2024-2029 (%)
Data Table on South Korea - Year-over-year growth 2024-2029 (%)

12.5.5 Singapore - Market size and forecast 2024-2029

Chart on Singapore - Market size and forecast 2024-2029 ($ million)
Data Table on Singapore - Market size and forecast 2024-2029 ($ million)
Chart on Singapore - Year-over-year growth 2024-2029 (%)
Data Table on Singapore - Year-over-year growth 2024-2029 (%)

12.5.6 Indonesia - Market size and forecast 2024-2029

Chart on Indonesia - Market size and forecast 2024-2029 ($ million)
Data Table on Indonesia - Market size and forecast 2024-2029 ($ million)
Chart on Indonesia - Year-over-year growth 2024-2029 (%)
Data Table on Indonesia - Year-over-year growth 2024-2029 (%)

12.5.7 Thailand - Market size and forecast 2024-2029

Chart on Thailand - Market size and forecast 2024-2029 ($ million)
Data Table on Thailand - Market size and forecast 2024-2029 ($ million)
Chart on Thailand - Year-over-year growth 2024-2029 (%)
Data Table on Thailand - Year-over-year growth 2024-2029 (%)

12.6 Rest of World (ROW) - Market size and forecast 2024-2029

Chart on Rest of World (ROW) - Market size and forecast 2024-2029 ($ million)
Data Table on Rest of World (ROW) - Market size and forecast 2024-2029 ($ million)
Chart on Rest of World (ROW) - Year-over-year growth 2024-2029 (%)
Data Table on Rest of World (ROW) - Year-over-year growth 2024-2029 (%)
Chart on Regional Comparison - Rest of World (ROW)
Data Table on Regional Comparison - Rest of World (ROW)

12.6.1 Brazil - Market size and forecast 2024-2029

Chart on Brazil - Market size and forecast 2024-2029 ($ million)
Data Table on Brazil - Market size and forecast 2024-2029 ($ million)
Chart on Brazil - Year-over-year growth 2024-2029 (%)
Data Table on Brazil - Year-over-year growth 2024-2029 (%)

12.6.2 Saudi Arabia - Market size and forecast 2024-2029

Chart on Saudi Arabia - Market size and forecast 2024-2029 ($ million)
Data Table on Saudi Arabia - Market size and forecast 2024-2029 ($ million)
Chart on Saudi Arabia - Year-over-year growth 2024-2029 (%)
Data Table on Saudi Arabia - Year-over-year growth 2024-2029 (%)

12.6.3 South Africa - Market size and forecast 2024-2029

Chart on South Africa - Market size and forecast 2024-2029 ($ million)
Data Table on South Africa - Market size and forecast 2024-2029 ($ million)
Chart on South Africa - Year-over-year growth 2024-2029 (%)
Data Table on South Africa - Year-over-year growth 2024-2029 (%)

12.6.4 Turkey - Market size and forecast 2024-2029

Chart on Turkey - Market size and forecast 2024-2029 ($ million)
Data Table on Turkey - Market size and forecast 2024-2029 ($ million)
Chart on Turkey - Year-over-year growth 2024-2029 (%)
Data Table on Turkey - Year-over-year growth 2024-2029 (%)

12.6.5 UAE - Market size and forecast 2024-2029

Chart on UAE - Market size and forecast 2024-2029 ($ million)
Data Table on UAE - Market size and forecast 2024-2029 ($ million)
Chart on UAE - Year-over-year growth 2024-2029 (%)
Data Table on UAE - Year-over-year growth 2024-2029 (%)

12.6.6 Australia - Market size and forecast 2024-2029

Chart on Australia - Market size and forecast 2024-2029 ($ million)
Data Table on Australia - Market size and forecast 2024-2029 ($ million)
Chart on Australia - Year-over-year growth 2024-2029 (%)
Data Table on Australia - Year-over-year growth 2024-2029 (%)

12.7 Market opportunity by geography

Market opportunity by geography ($ million)
Data Tables on Market opportunity by geography ($ million)

13. Drivers, Challenges, and Opportunity

13.1 Market drivers

Escalating incidence of chronic diseases and cancer
Pioneering technological and therapeutic innovations
Robust investment and strategic collaborations in research and development

13.2 Market challenges

High cost of treatment and reimbursement hurdles
Mechanisms of therapeutic resistance and management of toxicities
Complex manufacturing processes and supply chain logistics

13.3 Impact of drivers and challenges

Impact of drivers and challenges in 2024 and 2029

13.4 Market opportunities

Ascendancy of personalized cancer vaccines
Expansion and innovation in CAR-T cell therapy
Rapid development and approval of bispecific antibodies

14. Competitive Landscape

14.1 Overview

14.2

Overview on criticality of inputs and factors of differentiation

14.3 Landscape disruption

Overview on factors of disruption

14.4 Industry risks

Impact of key risks on business

15. Competitive Analysis

15.1 Companies profiled

Companies covered

15.2 Company ranking index

15.3 Market positioning of companies

Matrix on companies position and classification

15.4 AbbVie Inc.

AbbVie Inc. - Overview
AbbVie Inc. - Product / Service
AbbVie Inc. - Key news
AbbVie Inc. - Key offerings
SWOT

15.5 Amgen Inc.

Amgen Inc. - Overview
Amgen Inc. - Product / Service
Amgen Inc. - Key news
Amgen Inc. - Key offerings
SWOT

15.6 AstraZeneca Plc

AstraZeneca Plc - Overview
AstraZeneca Plc - Product / Service
AstraZeneca Plc - Key news
AstraZeneca Plc - Key offerings
SWOT

15.7 Bayer AG

Bayer AG - Overview
Bayer AG - Business segments
Bayer AG - Key news
Bayer AG - Key offerings
Bayer AG - Segment focus
SWOT

15.8 BioNTech SE

BioNTech SE - Overview
BioNTech SE - Product / Service
BioNTech SE - Key offerings
SWOT

15.9 Boehringer Ingelheim GmbH

Boehringer Ingelheim GmbH - Overview
Boehringer Ingelheim GmbH - Product / Service
Boehringer Ingelheim GmbH - Key news
Boehringer Ingelheim GmbH - Key offerings
SWOT

15.10 Bristol Myers Squibb Co.

Bristol Myers Squibb Co. - Overview
Bristol Myers Squibb Co. - Product / Service
Bristol Myers Squibb Co. - Key news
Bristol Myers Squibb Co. - Key offerings
SWOT

15.11 F. Hoffmann La Roche Ltd.

F. Hoffmann La Roche Ltd. - Overview
F. Hoffmann La Roche Ltd. - Business segments
F. Hoffmann La Roche Ltd. - Key news
F. Hoffmann La Roche Ltd. - Key offerings
F. Hoffmann La Roche Ltd. - Segment focus
SWOT

15.12 Genmab AS

Genmab AS - Overview
Genmab AS - Product / Service
Genmab AS - Key offerings
SWOT

15.13 Gilead Sciences Inc.

Gilead Sciences Inc. - Overview
Gilead Sciences Inc. - Product / Service
Gilead Sciences Inc. - Key news
Gilead Sciences Inc. - Key offerings
SWOT

15.14 GlaxoSmithKline Plc

GlaxoSmithKline Plc - Overview
GlaxoSmithKline Plc - Business segments
GlaxoSmithKline Plc - Key news
GlaxoSmithKline Plc - Key offerings
GlaxoSmithKline Plc - Segment focus
SWOT

15.15 Johnson and Johnson Services

Johnson and Johnson Services - Overview
Johnson and Johnson Services - Business segments
Johnson and Johnson Services - Key news
Johnson and Johnson Services - Key offerings
Johnson and Johnson Services - Segment focus
SWOT

15.16 Novartis AG

Novartis AG - Overview
Novartis AG - Business segments
Novartis AG - Key news
Novartis AG - Key offerings
Novartis AG - Segment focus
SWOT

15.17 Pfizer Inc.

Pfizer Inc. - Overview
Pfizer Inc. - Product / Service
Pfizer Inc. - Key news
Pfizer Inc. - Key offerings
SWOT

15.18 Sanofi SA

Sanofi SA - Overview
Sanofi SA - Business segments
Sanofi SA - Key news
Sanofi SA - Key offerings
Sanofi SA - Segment focus
SWOT

16. Appendix

16.1 Scope of the report

Market definition
Objectives
Notes and caveats

16.2 Inclusions and exclusions checklist

Inclusions checklist
Exclusions checklist

16.3 Currency conversion rates for US$

16.4 Research methodology

16.5 Data procurement

Information sources

16.6 Data validation

16.7 Validation techniques employed for market sizing

16.8 Data synthesis

16.9 360 degree market analysis

16.10 List of abbreviations

Research Methodology

Technavio presents a detailed picture of the market by way of study, synthesis, and summation of data from multiple sources. The analysts have presented the various facets of the market with a particular focus on identifying the key industry influencers. The data thus presented is comprehensive, reliable, and the result of extensive research, both primary and secondary.

INFORMATION SOURCES

Primary sources

  • Manufacturers and suppliers
  • Channel partners
  • Industry experts
  • Strategic decision makers

Secondary sources

  • Industry journals and periodicals
  • Government data
  • Financial reports of key industry players
  • Historical data
  • Press releases

DATA ANALYSIS

Data Synthesis

  • Collation of data
  • Estimation of key figures
  • Analysis of derived insights

Data Validation

  • Triangulation with data models
  • Reference against proprietary databases
  • Corroboration with industry experts

REPORT WRITING

Qualitative

  • Market drivers
  • Market challenges
  • Market trends
  • Five forces analysis

Quantitative

  • Market size and forecast
  • Market segmentation
  • Geographical insights
  • Competitive landscape

Interested in this report?

Get your sample now to see our research methodology and insights!

Download Now

Frequently Asked Questions

Immunotherapy Drugs market growth will increase by USD 220790.9 million during 2025-2029.

The Immunotherapy Drugs market is expected to grow at a CAGR of 12.4% during 2025-2029.

Immunotherapy Drugs market is segmented by End-user (Hospitals, Clinics, Others) Type (Monoclonal antibodies, Vaccines, Immune checkpoint inhibitors, Others) Therapeutic area (Cancer, Autoimmune and inflammatory diseases, Infectious diseases, Others)

AbbVie Inc., Amgen Inc., AstraZeneca Plc, Bayer AG, BioNTech SE, Boehringer Ingelheim GmbH, Bristol Myers Squibb Co., Celldex Therapeutics Inc, F. Hoffmann La Roche Ltd., Genmab AS, Gilead Sciences Inc., GlaxoSmithKline Plc, Incyte Corp., Johnson and Johnson Services, Novartis AG, Pfizer Inc., Sanofi SA, Teva Pharmaceutical Ltd. are a few of the key vendors in the Immunotherapy Drugs market.

North America will register the highest growth rate of 45.6% among the other regions. Therefore, the Immunotherapy Drugs market in North America is expected to garner significant business opportunities for the vendors during the forecast period.

US, Canada, Mexico, Germany, UK, France, Italy, Russia, Spain, The Netherlands, China, Japan, India, South Korea, Singapore, Indonesia, Thailand, Brazil, Saudi Arabia, South Africa, Turkey, UAE, Australia

  • Escalating incidence of chronic diseases and cancer is the driving factor this market.

The Immunotherapy Drugs market vendors should focus on grabbing business opportunities from the End-user segment as it accounted for the largest market share in the base year.