Industrial Enzymes Market Analysis, Size, and Forecast 2026-2030: North America (US, Canada, and Mexico), APAC (China, Japan, and India), Europe (Germany, UK, and France), South America (Brazil and Argentina), Middle East and Africa (South Africa, UAE, and Saudi Arabia), and Rest of World (ROW)

Industrial Enzymes Market Analysis, Size, and Forecast 2026-2030:
North America (US, Canada, and Mexico), APAC (China, Japan, and India), Europe (Germany, UK, and France), South America (Brazil and Argentina), Middle East and Africa (South Africa, UAE, and Saudi Arabia), and Rest of World (ROW)

Published: Jan 2026 310 Pages SKU: IRTNTR44390

Market Overview at a Glance

$2.62 B
Market Opportunity
6.3%
CAGR 2025 - 2030
36.2%
North America Growth
$2.81 B
Food and beverage segment 2024

Industrial Enzymes Market Size 2026-2030

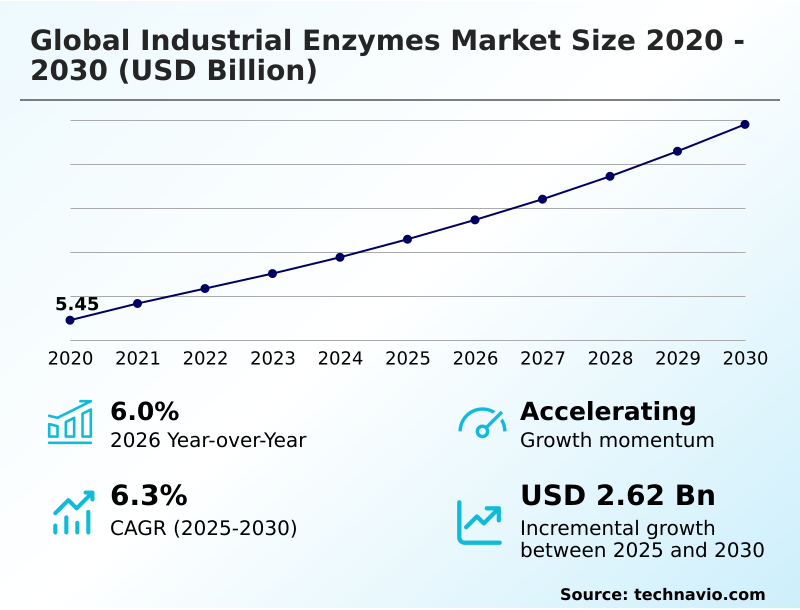
The industrial enzymes market size is valued to increase by USD 2.62 billion, at a CAGR of 6.3% from 2025 to 2030. Rising demand for biofuels and renewable energy sources will drive the industrial enzymes market.

Major Market Trends & Insights

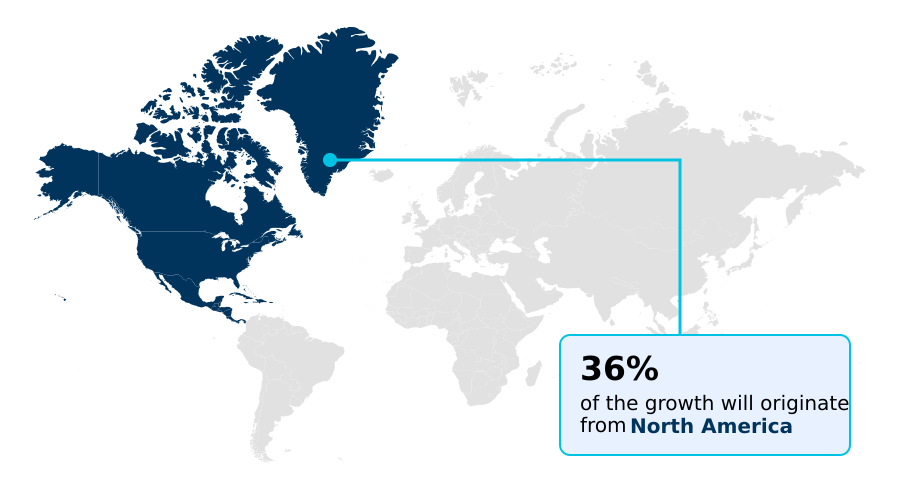
  • North America dominated the market and accounted for a 36.2% growth during the forecast period.
  • By Application - Food and beverage segment was valued at USD 2.81 billion in 2024
  • By Source - Microorganism segment accounted for the largest market revenue share in 2024

Market Size & Forecast

  • Market Opportunities: USD 4.46 billion
  • Market Future Opportunities: USD 2.62 billion
  • CAGR from 2025 to 2030 : 6.3%

Market Summary

  • The industrial enzymes market is undergoing a significant transformation, driven by a global shift toward sustainability and green chemistry. These biocatalysts are fundamental to modern manufacturing, enabling industries to reduce their environmental footprint while improving efficiency.
  • Applications are diverse, spanning from the production of biofuels through the enzymatic hydrolysis of biomass to the creation of clean-label foods where enzymes replace synthetic additives. In the textile industry, for example, a manufacturer can transition from chemical-based fabric treatments to enzymatic bio-stoning, which not only meets stringent environmental regulations but also reduces water consumption and machinery wear.
  • This pivot is supported by continuous advancements in protein engineering and microbial fermentation, which yield more robust and efficient enzymes. However, challenges related to the high sensitivity of enzymes to process conditions and competition from cheaper, established chemical catalysts temper the pace of adoption in some sectors.
  • The market's trajectory is firmly tied to balancing these operational realities with the growing regulatory and consumer pressure for cleaner production methods.

What will be the Size of the Industrial Enzymes Market during the forecast period?

Get Key Insights on Market Forecast (PDF) Request Free Sample

How is the Industrial Enzymes Market Segmented?

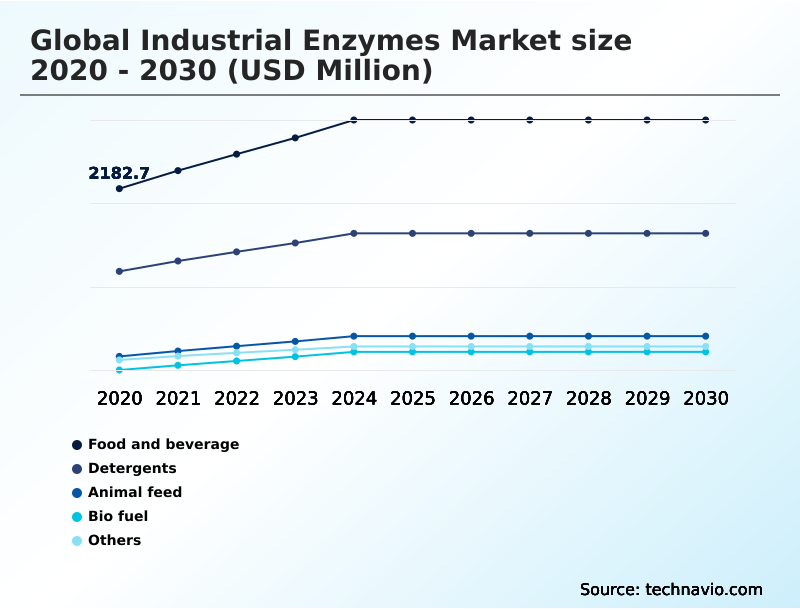
The industrial enzymes industry research report provides comprehensive data (region-wise segment analysis), with forecasts and estimates in "USD million" for the period 2026-2030, as well as historical data from 2020-2024 for the following segments.

  • Application
    • Food and beverage
    • Detergents
    • Animal feed
    • Bio fuel
    • Others
  • Source
    • Microorganism
    • Animals
    • Plants
  • Type
    • Carbohydrases
    • Proteases
    • Lipases
    • Others
  • Geography
    • North America
      • US
      • Canada
      • Mexico
    • APAC
      • China
      • Japan
      • India
    • Europe
      • Germany
      • UK
      • France
    • South America
      • Brazil
      • Argentina
    • Middle East and Africa
      • South Africa
      • UAE
      • Saudi Arabia
    • Rest of World (ROW)

By Application Insights

The food and beverage segment is estimated to witness significant growth during the forecast period.

The food and beverage segment is a cornerstone of the industrial enzymes market, driven by consumer demand for clean-label products.

Key biocatalysts like proteases, lipases, and amylases are integral as clean label processing aids for applications ranging from cheese ripening to meat tenderization. These enzymes improve dough handling properties and are crucial for starch liquefaction in sweetener production.

Advanced enzymatic hydrolysis techniques also facilitate juice clarification, enhancing product quality and visual appeal. For instance, optimizing enzyme usage in baking can improve dough consistency by over 15%, reducing waste and ensuring uniform product quality.

This reliance on biological solutions underscores the industry's shift away from synthetic additives toward more natural and efficient manufacturing processes.

Request Free Sample

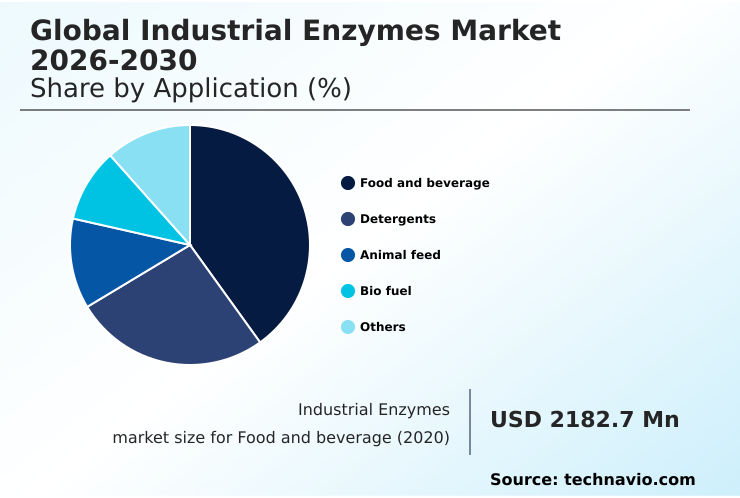
The Food and beverage segment was valued at USD 2.81 billion in 2024 and showed a gradual increase during the forecast period.

Request Free Sample

Regional Analysis

North America is estimated to contribute 36.2% to the growth of the global market during the forecast period.Technavio’s analysts have elaborately explained the regional trends and drivers that shape the market during the forecast period.

See How Industrial Enzymes Market Demand is Rising in North America Request Free Sample

The geographic landscape of the industrial enzymes market is diverse, with regional strengths defining growth trajectories. North America, which accounts for 36.2% of incremental growth, leverages its robust bio-economy infrastructure for biofuel production, heavily relying on microbial fermentation.

The region's focus on a renewable fuel standard drives innovation in enzymatic hydrolysis. In APAC, rapid industrialization makes it the fastest-growing market, with applications in textiles and food processing expanding.

Europe leads in sustainability, where strict regulations promote the use of enzymes to align with green chemistry principles.

Advanced recombinant dna technology and molecular genetics are enabling the development of specialized biocatalysts globally, including those for transesterification in biodiesel and pitch control in paper mills.

Enzymatic esterification is gaining traction for producing specialty chemicals with a lower carbon footprint, and a deep understanding of glycosidic bonds is critical for carbohydrase development.

Market Dynamics

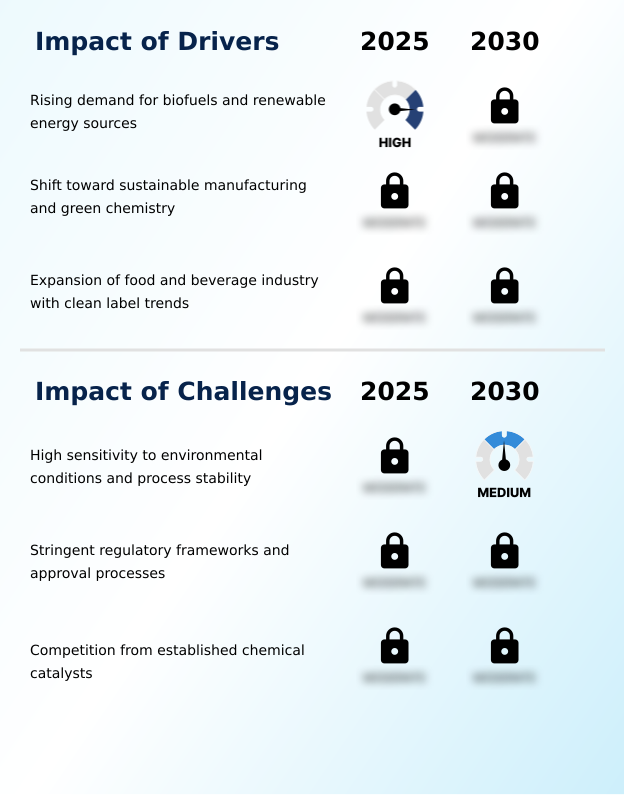
Our researchers analyzed the data with 2025 as the base year, along with the key drivers, trends, and challenges. A holistic analysis of drivers will help companies refine their marketing strategies to gain a competitive advantage.

  • The strategic implementation of industrial enzymes is reshaping manufacturing paradigms across multiple sectors. A primary focus is on advancing biofuel production via catalysis, where sophisticated enzyme cocktails are unlocking the potential of lignocellulosic feedstock. Simultaneously, the food industry is heavily invested in enzymatic solutions for plant-based foods, leveraging biotechnology to achieve desirable textures and flavors without synthetic additives.
  • This trend toward decreasing chemical use in manufacturing extends to the textile industry, where enzymatic solutions for plant-based proteins are replacing harsh scouring agents. Furthermore, the agricultural sector sees significant benefits, using enzymes in animal nutrition to improve gut health and nutrient absorption.
  • In consumer goods, cold water detergent enzyme applications are becoming standard, enabling energy savings without compromising cleaning efficacy. Companies focusing on enzymes for sustainable biofuel manufacturing report efficiency gains over 15% compared to conventional chemical methods, a compelling metric for supply chain and operational planning.
  • This advantage is mirrored in other areas, such as plant-based protein texture improvement, textile processing with enzymatic solutions, and enhancing animal feed efficiency through enzymes. The development of enzymes for low-temperature laundry detergents continues to be a key innovation area, aligning with global sustainability goals.

What are the key market drivers leading to the rise in the adoption of Industrial Enzymes Industry?

  • The increasing global demand for biofuels and other renewable energy sources is a fundamental driver propelling growth in the industrial enzymes market.

  • Market growth is fundamentally driven by the global push for sustainability and resource efficiency.
  • The demand for biofuels has intensified the need for effective enzymatic hydrolysis of biomass conversion, with cellulases playing a key role in breaking down complex lignocellulosic structures.
  • This aligns with a broader industry shift toward green chemistry principles and sustainable manufacturing. Companies adopting enzymatic processes report energy consumption reductions of up to 25% compared to traditional chemical methods.
  • The bio-economy infrastructure is expanding to support this transition, governed by regulations like the renewable fuel standard.
  • This creates a circular economy alignment, where enzymes are used for applications like pulp bio-bleaching, turning waste streams into valuable resources and minimizing environmental impact.

What are the market trends shaping the Industrial Enzymes Industry?

  • Advancements in protein engineering and directed evolution are a key trend, revolutionizing the market by enabling the creation of novel biocatalysts with enhanced performance characteristics.

  • Key market trends are centered on technological advancements and expanding applications into sustainable processes. The use of protein engineering and directed evolution is shortening R&D cycles for new biocatalysts by up to 30%, enabling the creation of enzymes with highly specific functions.
  • In agriculture, the focus on antibiotic-free animal husbandry is driving the adoption of enzymes for their nutraceutical benefits, improving the feed conversion ratio and breaking down anti-nutritional factors. The textile industry is undergoing a green transformation with enzymatic bio-stoning, bio-polishing, dehairing, and degreasing techniques, which provide clear fabric care benefits.
  • These processes can reduce water consumption by over 60% compared to traditional chemical methods, highlighting a significant operational and environmental advantage.

What challenges does the Industrial Enzymes Industry face during its growth?

  • The inherent sensitivity of enzymes to environmental conditions, such as temperature and pH, presents a significant challenge to their process stability and broader industrial adoption.

  • Navigating operational and regulatory complexities remains a primary challenge. The inherent sensitivity of enzymes limits their catalytic activity and substrate specificity, necessitating precise process controls that can increase operational costs by up to 20%. While protein engineering creates extremophiles, including psychrophilic enzymes and thermostable variants, their development is resource-intensive.
  • The stability of peptide bonds under harsh industrial conditions is a constant focus of R&D. Furthermore, competition from established chemical catalysts and stringent regulatory frameworks for GMO-derived enzymes create significant hurdles. The approval process for a new enzyme can take over three years longer than for non-GMO alternatives, impacting market entry.
  • These factors challenge the broader adoption of enzymatic solutions in applications requiring robust cold-water performance, such as enzymatic deinking or wastewater treatment.

Exclusive Technavio Analysis on Customer Landscape

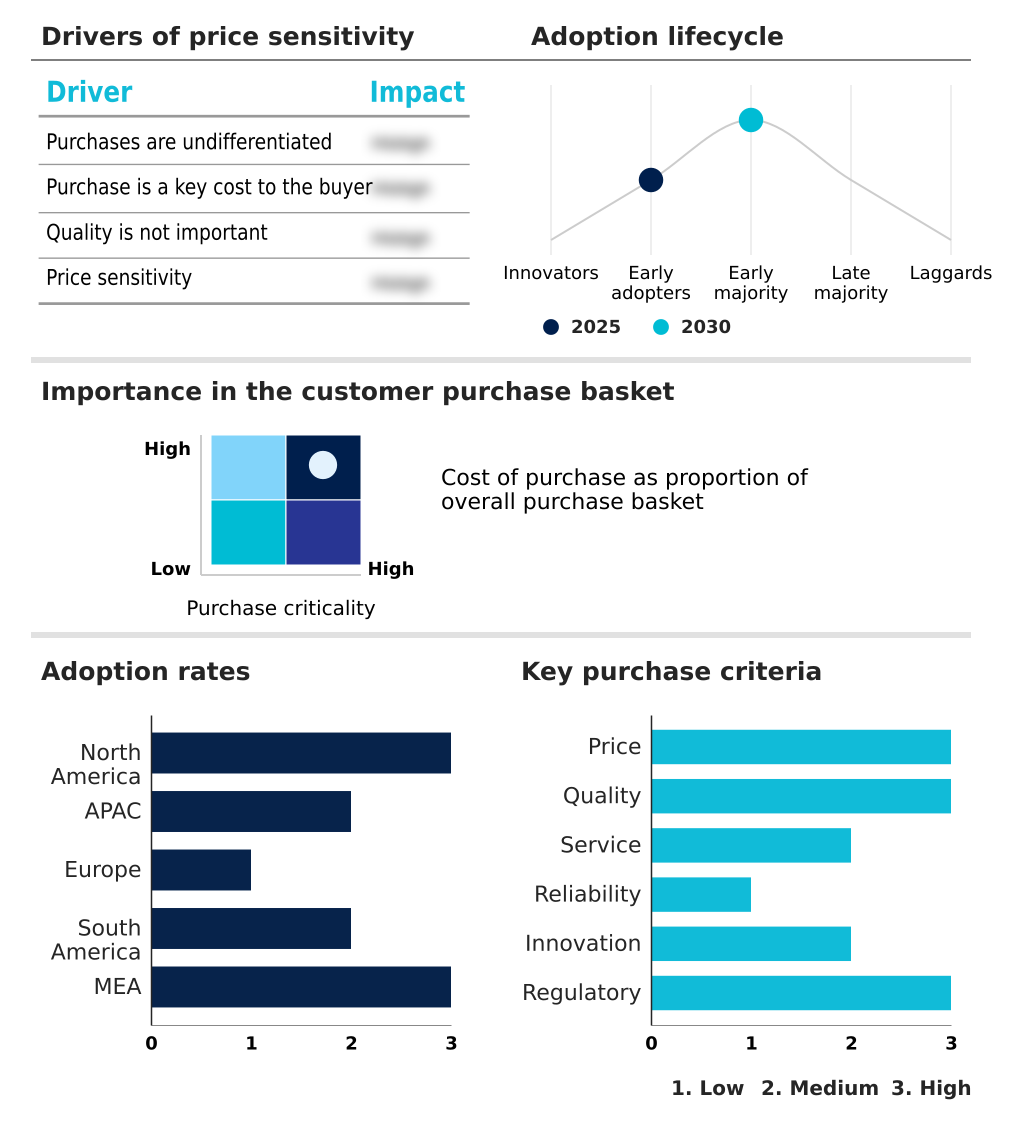
The industrial enzymes market forecasting report includes the adoption lifecycle of the market, covering from the innovator’s stage to the laggard’s stage. It focuses on adoption rates in different regions based on penetration. Furthermore, the industrial enzymes market report also includes key purchase criteria and drivers of price sensitivity to help companies evaluate and develop their market growth analysis strategies.

Customer Landscape of Industrial Enzymes Industry

Competitive Landscape

Companies are implementing various strategies, such as strategic alliances, industrial enzymes market forecast, partnerships, mergers and acquisitions, geographical expansion, and product/service launches, to enhance their presence in the industry.

Advanced Enzyme Technologies Ltd. - Key offerings include advanced biocatalytic solutions that enhance production efficiency and sustainability across food, feed, and industrial manufacturing sectors.

The industry research and growth report includes detailed analyses of the competitive landscape of the market and information about key companies, including:

  • Advanced Enzyme Technologies Ltd.
  • Amano Enzyme Inc.
  • Associated British Foods Plc
  • Aumgene Biosciences
  • BASF SE
  • Codexis Inc.
  • DSM Firmenich AG
  • DuPont de Nemours Inc.
  • Enzymatic Deinking Technologies LLC
  • F. Hoffmann La Roche Ltd.
  • Jiangsu Boli Bioproducts Co. Ltd.
  • Kerry Group Plc
  • Merck KGaA
  • Nature BioScience Pvt. Ltd.
  • Neogen Corp.
  • Novozymes AS
  • Novus International Inc.
  • The Soufflet Group
  • Thermo Fisher Scientific Inc.

Qualitative and quantitative analysis of companies has been conducted to help clients understand the wider business environment as well as the strengths and weaknesses of key industry players. Data is qualitatively analyzed to categorize companies as pure play, category-focused, industry-focused, and diversified; it is quantitatively analyzed to categorize companies as dominant, leading, strong, tentative, and weak.

Recent Development and News in Industrial enzymes market

  • In September, 2024, DSM-Firmenich AG announced positive trial results for its newest phytase generation, demonstrating significantly improved phosphorus release in poultry diets, which supports optimized feed formulations.
  • In December, 2024, Novonesis entered a strategic partnership with a major bioenergy producer to deploy a new cellulase enzyme blend aimed at increasing the yield of sustainable aviation fuel (SAF) from agricultural waste.
  • In January, 2025, Codexis Inc. revealed a strategic collaboration to deploy a newly engineered ligase enzyme, streamlining the manufacturing process for RNA-based therapeutics.
  • In May, 2025, Novonesis launched an enzymatic solution leveraging a protein deamidase enzyme to improve foam quality, texture, and protein solubility in plant-based beverages for barista-style products.

Dive into Technavio’s robust research methodology, blending expert interviews, extensive data synthesis, and validated models for unparalleled Industrial Enzymes Market insights. See full methodology.

Market Scope
Page number 310
Base year 2025
Historic period 2020-2024
Forecast period 2026-2030
Growth momentum & CAGR Accelerate at a CAGR of 6.3%
Market growth 2026-2030 USD 2616.4 million
Market structure Fragmented
YoY growth 2025-2026(%) 6.0%
Key countries US, Canada, Mexico, China, Japan, India, South Korea, Australia, Indonesia, Germany, UK, France, Italy, Spain, The Netherlands, Brazil, Argentina, Chile, South Africa, UAE, Saudi Arabia, Egypt and Morocco
Competitive landscape Leading Companies, Market Positioning of Companies, Competitive Strategies, and Industry Risks

Request Free Sample

Research Analyst Overview

  • The industrial enzymes market is defined by rapid innovation in biotechnology, fundamentally altering industrial processes. The core of this evolution lies in protein engineering and directed evolution, which allow for the creation of novel biocatalysts with unparalleled specificity. For boardroom consideration, strategic investment in proprietary recombinant DNA technology is paramount, as it provides a distinct competitive advantage.
  • Firms leveraging these techniques to develop thermostable variants or extremophiles can capture high-value applications where standard enzymes fail. For instance, businesses that master directed evolution have demonstrated a 40% reduction in development timelines for new enzymes. This acceleration in R&D, focused on enhancing catalytic activity and substrate specificity, is critical.
  • Key processes like microbial fermentation, enzymatic hydrolysis, biomass conversion, and starch liquefaction are being continuously optimized. The development of advanced cellulases, amylases, proteases, and lipases is expanding the application scope, from biofuel production using lignocellulosic structures to specialized uses in food and detergents. This technological momentum is reshaping what is possible in industrial manufacturing.

What are the Key Data Covered in this Industrial Enzymes Market Research and Growth Report?

  • What is the expected growth of the Industrial Enzymes Market between 2026 and 2030?

    • USD 2.62 billion, at a CAGR of 6.3%

  • What segmentation does the market report cover?

    • The report is segmented by Application (Food and beverage, Detergents, Animal feed, Bio fuel, and Others), Source (Microorganism, Animals, and Plants), Type (Carbohydrases, Proteases, Lipases, and Others) and Geography (North America, APAC, Europe, South America, Middle East and Africa)

  • Which regions are analyzed in the report?

    • North America, APAC, Europe, South America and Middle East and Africa

  • What are the key growth drivers and market challenges?

    • Rising demand for biofuels and renewable energy sources, High sensitivity to environmental conditions and process stability

  • Who are the major players in the Industrial Enzymes Market?

    • Advanced Enzyme Technologies Ltd., Amano Enzyme Inc., Associated British Foods Plc, Aumgene Biosciences, BASF SE, Codexis Inc., DSM Firmenich AG, DuPont de Nemours Inc., Enzymatic Deinking Technologies LLC, F. Hoffmann La Roche Ltd., Jiangsu Boli Bioproducts Co. Ltd., Kerry Group Plc, Merck KGaA, Nature BioScience Pvt. Ltd., Neogen Corp., Novozymes AS, Novus International Inc., The Soufflet Group and Thermo Fisher Scientific Inc.

Market Research Insights

  • The industrial enzymes market is shaped by a decisive move toward sustainable manufacturing and antibiotic-free animal husbandry. The adoption of enzymes as a clean label processing aid aligns with consumer demand for natural ingredients, with some food producers reporting a 30% increase in product preference scores after reformulating.
  • In animal nutrition, the use of enzymes for nutraceutical benefits improves the feed conversion ratio by over 5%, reducing costs and environmental impact. This shift is a key component of circular economy alignment, where biological processes replace chemical ones.
  • For instance, the application of specific enzymes for active pharmaceutical ingredient synthesis can reduce hazardous waste by up to 70% compared to traditional chemical routes, showcasing the broad impact of these biocatalysts on operational efficiency and regulatory compliance.

We can help! Our analysts can customize this industrial enzymes market research report to meet your requirements.

Get in touch

1. Executive Summary

1.1 Market overview

Executive Summary - Chart on Market Overview
Executive Summary - Data Table on Market Overview
Executive Summary - Chart on Global Market Characteristics
Executive Summary - Chart on Market by Geography
Executive Summary - Chart on Market Segmentation by Application
Executive Summary - Chart on Market Segmentation by Source
Executive Summary - Chart on Market Segmentation by Type
Executive Summary - Chart on Incremental Growth
Executive Summary - Data Table on Incremental Growth
Executive Summary - Chart on Company Market Positioning

2. Technavio Analysis

2.1 Analysis of price sensitivity, lifecycle, customer purchase basket, adoption rates, and purchase criteria

2.2 Criticality of inputs and Factors of differentiation

Chart on Overview on criticality of inputs and factors of differentiation

2.3 Factors of disruption

Chart on Overview on factors of disruption

2.4 Impact of drivers and challenges

Chart on Impact of drivers and challenges in 2025 and 2030

3. Market Landscape

3.1 Market ecosystem

Chart on Parent Market
Data Table on - Parent Market

3.2 Market characteristics

Chart on Market characteristics analysis

3.3 Value chain analysis

Chart on Value chain analysis

4. Market Sizing

4.1 Market definition

Data Table on Offerings of companies included in the market definition

4.2 Market segment analysis

Market segments

4.3 Market size 2025

4.4 Market outlook: Forecast for 2025-2030

Chart on Global - Market size and forecast 2025-2030 ($ million)
Data Table on Global - Market size and forecast 2025-2030 ($ million)
Chart on Global Market: Year-over-year growth 2025-2030 (%)
Data Table on Global Market: Year-over-year growth 2025-2030 (%)

5. Historic Market Size

5.1 Global Industrial Enzymes Market 2020 - 2024

Historic Market Size - Data Table on Global Industrial Enzymes Market 2020 - 2024 ($ million)

5.2 Application segment analysis 2020 - 2024

Historic Market Size - Application Segment 2020 - 2024 ($ million)

5.3 Source segment analysis 2020 - 2024

Historic Market Size - Source Segment 2020 - 2024 ($ million)

5.4 Type segment analysis 2020 - 2024

Historic Market Size - Type Segment 2020 - 2024 ($ million)

5.5 Geography segment analysis 2020 - 2024

Historic Market Size - Geography Segment 2020 - 2024 ($ million)

5.6 Country segment analysis 2020 - 2024

Historic Market Size - Country Segment 2020 - 2024 ($ million)

6. Qualitative Analysis

6.1 Impact of AI on global industrial enzymes market

7. Five Forces Analysis

7.1 Five forces summary

Five forces analysis - Comparison between 2025 and 2030

7.2 Bargaining power of buyers

Bargaining power of buyers - Impact of key factors 2025 and 2030

7.3 Bargaining power of suppliers

Bargaining power of suppliers - Impact of key factors in 2025 and 2030

7.4 Threat of new entrants

Threat of new entrants - Impact of key factors in 2025 and 2030

7.5 Threat of substitutes

Threat of substitutes - Impact of key factors in 2025 and 2030

7.6 Threat of rivalry

Threat of rivalry - Impact of key factors in 2025 and 2030

7.7 Market condition

Chart on Market condition - Five forces 2025 and 2030

8. Market Segmentation by Application

8.1 Market segments

Chart on Application - Market share 2025-2030 (%)
Data Table on Application - Market share 2025-2030 (%)

8.2 Comparison by Application

Chart on Comparison by Application
Data Table on Comparison by Application

8.3 Food and beverage - Market size and forecast 2025-2030

Chart on Food and beverage - Market size and forecast 2025-2030 ($ million)
Data Table on Food and beverage - Market size and forecast 2025-2030 ($ million)
Chart on Food and beverage - Year-over-year growth 2025-2030 (%)
Data Table on Food and beverage - Year-over-year growth 2025-2030 (%)

8.4 Detergents - Market size and forecast 2025-2030

Chart on Detergents - Market size and forecast 2025-2030 ($ million)
Data Table on Detergents - Market size and forecast 2025-2030 ($ million)
Chart on Detergents - Year-over-year growth 2025-2030 (%)
Data Table on Detergents - Year-over-year growth 2025-2030 (%)

8.5 Animal feed - Market size and forecast 2025-2030

Chart on Animal feed - Market size and forecast 2025-2030 ($ million)
Data Table on Animal feed - Market size and forecast 2025-2030 ($ million)
Chart on Animal feed - Year-over-year growth 2025-2030 (%)
Data Table on Animal feed - Year-over-year growth 2025-2030 (%)

8.6 Bio fuel - Market size and forecast 2025-2030

Chart on Bio fuel - Market size and forecast 2025-2030 ($ million)
Data Table on Bio fuel - Market size and forecast 2025-2030 ($ million)
Chart on Bio fuel - Year-over-year growth 2025-2030 (%)
Data Table on Bio fuel - Year-over-year growth 2025-2030 (%)

8.7 Others - Market size and forecast 2025-2030

Chart on Others - Market size and forecast 2025-2030 ($ million)
Data Table on Others - Market size and forecast 2025-2030 ($ million)
Chart on Others - Year-over-year growth 2025-2030 (%)
Data Table on Others - Year-over-year growth 2025-2030 (%)

8.8 Market opportunity by Application

Market opportunity by Application ($ million)
Data Table on Market opportunity by Application ($ million)

9. Market Segmentation by Source

9.1 Market segments

Chart on Source - Market share 2025-2030 (%)
Data Table on Source - Market share 2025-2030 (%)

9.2 Comparison by Source

Chart on Comparison by Source
Data Table on Comparison by Source

9.3 Microorganism - Market size and forecast 2025-2030

Chart on Microorganism - Market size and forecast 2025-2030 ($ million)
Data Table on Microorganism - Market size and forecast 2025-2030 ($ million)
Chart on Microorganism - Year-over-year growth 2025-2030 (%)
Data Table on Microorganism - Year-over-year growth 2025-2030 (%)

9.4 Animals - Market size and forecast 2025-2030

Chart on Animals - Market size and forecast 2025-2030 ($ million)
Data Table on Animals - Market size and forecast 2025-2030 ($ million)
Chart on Animals - Year-over-year growth 2025-2030 (%)
Data Table on Animals - Year-over-year growth 2025-2030 (%)

9.5 Plants - Market size and forecast 2025-2030

Chart on Plants - Market size and forecast 2025-2030 ($ million)
Data Table on Plants - Market size and forecast 2025-2030 ($ million)
Chart on Plants - Year-over-year growth 2025-2030 (%)
Data Table on Plants - Year-over-year growth 2025-2030 (%)

9.6 Market opportunity by Source

Market opportunity by Source ($ million)
Data Table on Market opportunity by Source ($ million)

10. Market Segmentation by Type

10.1 Market segments

Chart on Type - Market share 2025-2030 (%)
Data Table on Type - Market share 2025-2030 (%)

10.2 Comparison by Type

Chart on Comparison by Type
Data Table on Comparison by Type

10.3 Carbohydrases - Market size and forecast 2025-2030

Chart on Carbohydrases - Market size and forecast 2025-2030 ($ million)
Data Table on Carbohydrases - Market size and forecast 2025-2030 ($ million)
Chart on Carbohydrases - Year-over-year growth 2025-2030 (%)
Data Table on Carbohydrases - Year-over-year growth 2025-2030 (%)

10.4 Proteases - Market size and forecast 2025-2030

Chart on Proteases - Market size and forecast 2025-2030 ($ million)
Data Table on Proteases - Market size and forecast 2025-2030 ($ million)
Chart on Proteases - Year-over-year growth 2025-2030 (%)
Data Table on Proteases - Year-over-year growth 2025-2030 (%)

10.5 Lipases - Market size and forecast 2025-2030

Chart on Lipases - Market size and forecast 2025-2030 ($ million)
Data Table on Lipases - Market size and forecast 2025-2030 ($ million)
Chart on Lipases - Year-over-year growth 2025-2030 (%)
Data Table on Lipases - Year-over-year growth 2025-2030 (%)

10.6 Others - Market size and forecast 2025-2030

Chart on Others - Market size and forecast 2025-2030 ($ million)
Data Table on Others - Market size and forecast 2025-2030 ($ million)
Chart on Others - Year-over-year growth 2025-2030 (%)
Data Table on Others - Year-over-year growth 2025-2030 (%)

10.7 Market opportunity by Type

Market opportunity by Type ($ million)
Data Table on Market opportunity by Type ($ million)

11. Customer Landscape

11.1 Customer landscape overview

Analysis of price sensitivity, lifecycle, customer purchase basket, adoption rates, and purchase criteria

12. Geographic Landscape

12.1 Geographic segmentation

Chart on Market share by geography 2025-2030 (%)
Data Table on Market share by geography 2025-2030 (%)

12.2 Geographic comparison

Chart on Geographic comparison
Data Table on Geographic comparison

12.3 North America - Market size and forecast 2025-2030

Chart on North America - Market size and forecast 2025-2030 ($ million)
Data Table on North America - Market size and forecast 2025-2030 ($ million)
Chart on North America - Year-over-year growth 2025-2030 (%)
Data Table on North America - Year-over-year growth 2025-2030 (%)
Chart on Regional Comparison - North America
Data Table on Regional Comparison - North America

12.3.1 US - Market size and forecast 2025-2030

Chart on US - Market size and forecast 2025-2030 ($ million)
Data Table on US - Market size and forecast 2025-2030 ($ million)
Chart on US - Year-over-year growth 2025-2030 (%)
Data Table on US - Year-over-year growth 2025-2030 (%)

12.3.2 Canada - Market size and forecast 2025-2030

Chart on Canada - Market size and forecast 2025-2030 ($ million)
Data Table on Canada - Market size and forecast 2025-2030 ($ million)
Chart on Canada - Year-over-year growth 2025-2030 (%)
Data Table on Canada - Year-over-year growth 2025-2030 (%)

12.3.3 Mexico - Market size and forecast 2025-2030

Chart on Mexico - Market size and forecast 2025-2030 ($ million)
Data Table on Mexico - Market size and forecast 2025-2030 ($ million)
Chart on Mexico - Year-over-year growth 2025-2030 (%)
Data Table on Mexico - Year-over-year growth 2025-2030 (%)

12.4 APAC - Market size and forecast 2025-2030

Chart on APAC - Market size and forecast 2025-2030 ($ million)
Data Table on APAC - Market size and forecast 2025-2030 ($ million)
Chart on APAC - Year-over-year growth 2025-2030 (%)
Data Table on APAC - Year-over-year growth 2025-2030 (%)
Chart on Regional Comparison - APAC
Data Table on Regional Comparison - APAC

12.4.1 China - Market size and forecast 2025-2030

Chart on China - Market size and forecast 2025-2030 ($ million)
Data Table on China - Market size and forecast 2025-2030 ($ million)
Chart on China - Year-over-year growth 2025-2030 (%)
Data Table on China - Year-over-year growth 2025-2030 (%)

12.4.2 Japan - Market size and forecast 2025-2030

Chart on Japan - Market size and forecast 2025-2030 ($ million)
Data Table on Japan - Market size and forecast 2025-2030 ($ million)
Chart on Japan - Year-over-year growth 2025-2030 (%)
Data Table on Japan - Year-over-year growth 2025-2030 (%)

12.4.3 India - Market size and forecast 2025-2030

Chart on India - Market size and forecast 2025-2030 ($ million)
Data Table on India - Market size and forecast 2025-2030 ($ million)
Chart on India - Year-over-year growth 2025-2030 (%)
Data Table on India - Year-over-year growth 2025-2030 (%)

12.4.4 South Korea - Market size and forecast 2025-2030

Chart on South Korea - Market size and forecast 2025-2030 ($ million)
Data Table on South Korea - Market size and forecast 2025-2030 ($ million)
Chart on South Korea - Year-over-year growth 2025-2030 (%)
Data Table on South Korea - Year-over-year growth 2025-2030 (%)

12.4.5 Australia - Market size and forecast 2025-2030

Chart on Australia - Market size and forecast 2025-2030 ($ million)
Data Table on Australia - Market size and forecast 2025-2030 ($ million)
Chart on Australia - Year-over-year growth 2025-2030 (%)
Data Table on Australia - Year-over-year growth 2025-2030 (%)

12.4.6 Indonesia - Market size and forecast 2025-2030

Chart on Indonesia - Market size and forecast 2025-2030 ($ million)
Data Table on Indonesia - Market size and forecast 2025-2030 ($ million)
Chart on Indonesia - Year-over-year growth 2025-2030 (%)
Data Table on Indonesia - Year-over-year growth 2025-2030 (%)

12.5 Europe - Market size and forecast 2025-2030

Chart on Europe - Market size and forecast 2025-2030 ($ million)
Data Table on Europe - Market size and forecast 2025-2030 ($ million)
Chart on Europe - Year-over-year growth 2025-2030 (%)
Data Table on Europe - Year-over-year growth 2025-2030 (%)
Chart on Regional Comparison - Europe
Data Table on Regional Comparison - Europe

12.5.1 Germany - Market size and forecast 2025-2030

Chart on Germany - Market size and forecast 2025-2030 ($ million)
Data Table on Germany - Market size and forecast 2025-2030 ($ million)
Chart on Germany - Year-over-year growth 2025-2030 (%)
Data Table on Germany - Year-over-year growth 2025-2030 (%)

12.5.2 UK - Market size and forecast 2025-2030

Chart on UK - Market size and forecast 2025-2030 ($ million)
Data Table on UK - Market size and forecast 2025-2030 ($ million)
Chart on UK - Year-over-year growth 2025-2030 (%)
Data Table on UK - Year-over-year growth 2025-2030 (%)

12.5.3 France - Market size and forecast 2025-2030

Chart on France - Market size and forecast 2025-2030 ($ million)
Data Table on France - Market size and forecast 2025-2030 ($ million)
Chart on France - Year-over-year growth 2025-2030 (%)
Data Table on France - Year-over-year growth 2025-2030 (%)

12.5.4 Italy - Market size and forecast 2025-2030

Chart on Italy - Market size and forecast 2025-2030 ($ million)
Data Table on Italy - Market size and forecast 2025-2030 ($ million)
Chart on Italy - Year-over-year growth 2025-2030 (%)
Data Table on Italy - Year-over-year growth 2025-2030 (%)

12.5.5 Spain - Market size and forecast 2025-2030

Chart on Spain - Market size and forecast 2025-2030 ($ million)
Data Table on Spain - Market size and forecast 2025-2030 ($ million)
Chart on Spain - Year-over-year growth 2025-2030 (%)
Data Table on Spain - Year-over-year growth 2025-2030 (%)

12.5.6 The Netherlands - Market size and forecast 2025-2030

Chart on The Netherlands - Market size and forecast 2025-2030 ($ million)
Data Table on The Netherlands - Market size and forecast 2025-2030 ($ million)
Chart on The Netherlands - Year-over-year growth 2025-2030 (%)
Data Table on The Netherlands - Year-over-year growth 2025-2030 (%)

12.6 South America - Market size and forecast 2025-2030

Chart on South America - Market size and forecast 2025-2030 ($ million)
Data Table on South America - Market size and forecast 2025-2030 ($ million)
Chart on South America - Year-over-year growth 2025-2030 (%)
Data Table on South America - Year-over-year growth 2025-2030 (%)
Chart on Regional Comparison - South America
Data Table on Regional Comparison - South America

12.6.1 Brazil - Market size and forecast 2025-2030

Chart on Brazil - Market size and forecast 2025-2030 ($ million)
Data Table on Brazil - Market size and forecast 2025-2030 ($ million)
Chart on Brazil - Year-over-year growth 2025-2030 (%)
Data Table on Brazil - Year-over-year growth 2025-2030 (%)

12.6.2 Argentina - Market size and forecast 2025-2030

Chart on Argentina - Market size and forecast 2025-2030 ($ million)
Data Table on Argentina - Market size and forecast 2025-2030 ($ million)
Chart on Argentina - Year-over-year growth 2025-2030 (%)
Data Table on Argentina - Year-over-year growth 2025-2030 (%)

12.6.3 Chile - Market size and forecast 2025-2030

Chart on Chile - Market size and forecast 2025-2030 ($ million)
Data Table on Chile - Market size and forecast 2025-2030 ($ million)
Chart on Chile - Year-over-year growth 2025-2030 (%)
Data Table on Chile - Year-over-year growth 2025-2030 (%)

12.7 Middle East and Africa - Market size and forecast 2025-2030

Chart on Middle East and Africa - Market size and forecast 2025-2030 ($ million)
Data Table on Middle East and Africa - Market size and forecast 2025-2030 ($ million)
Chart on Middle East and Africa - Year-over-year growth 2025-2030 (%)
Data Table on Middle East and Africa - Year-over-year growth 2025-2030 (%)
Chart on Regional Comparison - Middle East and Africa
Data Table on Regional Comparison - Middle East and Africa

12.7.1 South Africa - Market size and forecast 2025-2030

Chart on South Africa - Market size and forecast 2025-2030 ($ million)
Data Table on South Africa - Market size and forecast 2025-2030 ($ million)
Chart on South Africa - Year-over-year growth 2025-2030 (%)
Data Table on South Africa - Year-over-year growth 2025-2030 (%)

12.7.2 UAE - Market size and forecast 2025-2030

Chart on UAE - Market size and forecast 2025-2030 ($ million)
Data Table on UAE - Market size and forecast 2025-2030 ($ million)
Chart on UAE - Year-over-year growth 2025-2030 (%)
Data Table on UAE - Year-over-year growth 2025-2030 (%)

12.7.3 Saudi Arabia - Market size and forecast 2025-2030

Chart on Saudi Arabia - Market size and forecast 2025-2030 ($ million)
Data Table on Saudi Arabia - Market size and forecast 2025-2030 ($ million)
Chart on Saudi Arabia - Year-over-year growth 2025-2030 (%)
Data Table on Saudi Arabia - Year-over-year growth 2025-2030 (%)

12.7.4 Egypt - Market size and forecast 2025-2030

Chart on Egypt - Market size and forecast 2025-2030 ($ million)
Data Table on Egypt - Market size and forecast 2025-2030 ($ million)
Chart on Egypt - Year-over-year growth 2025-2030 (%)
Data Table on Egypt - Year-over-year growth 2025-2030 (%)

12.7.5 Morocco - Market size and forecast 2025-2030

Chart on Morocco - Market size and forecast 2025-2030 ($ million)
Data Table on Morocco - Market size and forecast 2025-2030 ($ million)
Chart on Morocco - Year-over-year growth 2025-2030 (%)
Data Table on Morocco - Year-over-year growth 2025-2030 (%)

12.8 Market opportunity by geography

Market opportunity by geography ($ million)
Data Tables on Market opportunity by geography ($ million)

13. Drivers, Challenges, and Opportunity

13.1 Market drivers

Rising demand for biofuels and renewable energy sources
Shift toward sustainable manufacturing and green chemistry
Expansion of food and beverage industry with clean label trends

13.2 Market challenges

High sensitivity to environmental conditions and process stability
Stringent regulatory frameworks and approval processes
Competition from established chemical catalysts

13.3 Impact of drivers and challenges

Impact of drivers and challenges in 2025 and 2030

13.4 Market opportunities

Advancements in protein engineering and directed evolution
Increasing application in animal feed for nutraceutical benefits
Growth of enzymes in textile and leather processing

14. Competitive Landscape

14.1 Overview

14.2

Overview on criticality of inputs and factors of differentiation

14.3 Landscape disruption

Overview on factors of disruption

14.4 Industry risks

Impact of key risks on business

15. Competitive Analysis

15.1 Companies profiled

Companies covered

15.2 Company ranking index

15.3 Market positioning of companies

Matrix on companies position and classification

15.4 Advanced Enzyme Technologies Ltd.

Advanced Enzyme Technologies Ltd. - Overview
Advanced Enzyme Technologies Ltd. - Business segments
Advanced Enzyme Technologies Ltd. - Key offerings
Advanced Enzyme Technologies Ltd. - Segment focus
SWOT

15.5 Amano Enzyme Inc.

Amano Enzyme Inc. - Overview
Amano Enzyme Inc. - Product / Service
Amano Enzyme Inc. - Key offerings
SWOT

15.6 Associated British Foods Plc

Associated British Foods Plc - Overview
Associated British Foods Plc - Business segments
Associated British Foods Plc - Key offerings
Associated British Foods Plc - Segment focus
SWOT

15.7 Aumgene Biosciences

Aumgene Biosciences - Overview
Aumgene Biosciences - Product / Service
Aumgene Biosciences - Key offerings
SWOT

15.8 BASF SE

BASF SE - Overview
BASF SE - Business segments
BASF SE - Key news
BASF SE - Key offerings
BASF SE - Segment focus
SWOT

15.9 Codexis Inc.

Codexis Inc. - Overview
Codexis Inc. - Business segments
Codexis Inc. - Key offerings
Codexis Inc. - Segment focus
SWOT

15.10 DSM Firmenich AG

DSM Firmenich AG - Overview
DSM Firmenich AG - Business segments
DSM Firmenich AG - Key news
DSM Firmenich AG - Key offerings
DSM Firmenich AG - Segment focus
SWOT

15.11 DuPont de Nemours Inc.

DuPont de Nemours Inc. - Overview
DuPont de Nemours Inc. - Business segments
DuPont de Nemours Inc. - Key news
DuPont de Nemours Inc. - Key offerings
DuPont de Nemours Inc. - Segment focus
SWOT

15.12 Jiangsu Boli Bioproducts Co. Ltd.

Jiangsu Boli Bioproducts Co. Ltd. - Overview
Jiangsu Boli Bioproducts Co. Ltd. - Product / Service
Jiangsu Boli Bioproducts Co. Ltd. - Key offerings
SWOT

15.13 Kerry Group Plc

Kerry Group Plc - Overview
Kerry Group Plc - Business segments
Kerry Group Plc - Key offerings
Kerry Group Plc - Segment focus
SWOT

15.14 Merck KGaA

Merck KGaA - Overview
Merck KGaA - Business segments
Merck KGaA - Key news
Merck KGaA - Key offerings
Merck KGaA - Segment focus
SWOT

15.15 Nature BioScience Pvt. Ltd.

Nature BioScience Pvt. Ltd. - Overview
Nature BioScience Pvt. Ltd. - Product / Service
Nature BioScience Pvt. Ltd. - Key offerings
SWOT

15.16 Neogen Corp.

Neogen Corp. - Overview
Neogen Corp. - Business segments
Neogen Corp. - Key offerings
Neogen Corp. - Segment focus
SWOT

15.17 Novozymes AS

Novozymes AS - Overview
Novozymes AS - Product / Service
Novozymes AS - Key offerings
SWOT

15.18 Thermo Fisher Scientific Inc.

Thermo Fisher Scientific Inc. - Overview
Thermo Fisher Scientific Inc. - Business segments
Thermo Fisher Scientific Inc. - Key news
Thermo Fisher Scientific Inc. - Key offerings
Thermo Fisher Scientific Inc. - Segment focus
SWOT

16. Appendix

16.1 Scope of the report

Market definition
Objectives
Notes and caveats

16.2 Inclusions and exclusions checklist

Inclusions checklist
Exclusions checklist

16.3 Currency conversion rates for US$

16.4 Research methodology

16.5 Data procurement

Information sources

16.6 Data validation

16.7 Validation techniques employed for market sizing

16.8 Data synthesis

16.9 360 degree market analysis

16.10 List of abbreviations

Research Methodology

Technavio presents a detailed picture of the market by way of study, synthesis, and summation of data from multiple sources. The analysts have presented the various facets of the market with a particular focus on identifying the key industry influencers. The data thus presented is comprehensive, reliable, and the result of extensive research, both primary and secondary.

INFORMATION SOURCES

Primary sources

  • Manufacturers and suppliers
  • Channel partners
  • Industry experts
  • Strategic decision makers

Secondary sources

  • Industry journals and periodicals
  • Government data
  • Financial reports of key industry players
  • Historical data
  • Press releases

DATA ANALYSIS

Data Synthesis

  • Collation of data
  • Estimation of key figures
  • Analysis of derived insights

Data Validation

  • Triangulation with data models
  • Reference against proprietary databases
  • Corroboration with industry experts

REPORT WRITING

Qualitative

  • Market drivers
  • Market challenges
  • Market trends
  • Five forces analysis

Quantitative

  • Market size and forecast
  • Market segmentation
  • Geographical insights
  • Competitive landscape

Interested in this report?

Get your sample now to see our research methodology and insights!

Download Now

Frequently Asked Questions

Industrial Enzymes market growth will increase by USD 2616.4 million during 2026-2030.

The Industrial Enzymes market is expected to grow at a CAGR of 6.3% during 2026-2030.

Industrial Enzymes market is segmented by Application (Food and beverage, Detergents, Animal feed, Bio fuel, Others) Source (Microorganism, Animals, Plants) Type (Carbohydrases, Proteases, Lipases, Others)

Advanced Enzyme Technologies Ltd., Amano Enzyme Inc., Associated British Foods Plc, Aumgene Biosciences, BASF SE, Codexis Inc., DSM Firmenich AG, DuPont de Nemours Inc., Enzymatic Deinking Technologies LLC, F. Hoffmann La Roche Ltd., Jiangsu Boli Bioproducts Co. Ltd., Kerry Group Plc, Merck KGaA, Nature BioScience Pvt. Ltd., Neogen Corp., Novozymes AS, Novus International Inc., The Soufflet Group, Thermo Fisher Scientific Inc. are a few of the key vendors in the Industrial Enzymes market.

North America will register the highest growth rate of 36.2% among the other regions. Therefore, the Industrial Enzymes market in North America is expected to garner significant business opportunities for the vendors during the forecast period.

US, Canada, Mexico, China, Japan, India, South Korea, Australia, Indonesia, Germany, UK, France, Italy, Spain, The Netherlands, Brazil, Argentina, Chile, South Africa, UAE, Saudi Arabia, Egypt, Morocco

  • Rising demand for biofuels and renewable energy sources is the driving factor this market.

The Industrial Enzymes market vendors should focus on grabbing business opportunities from the Application segment as it accounted for the largest market share in the base year.