Industrial Lubricants Market Size 2025-2029
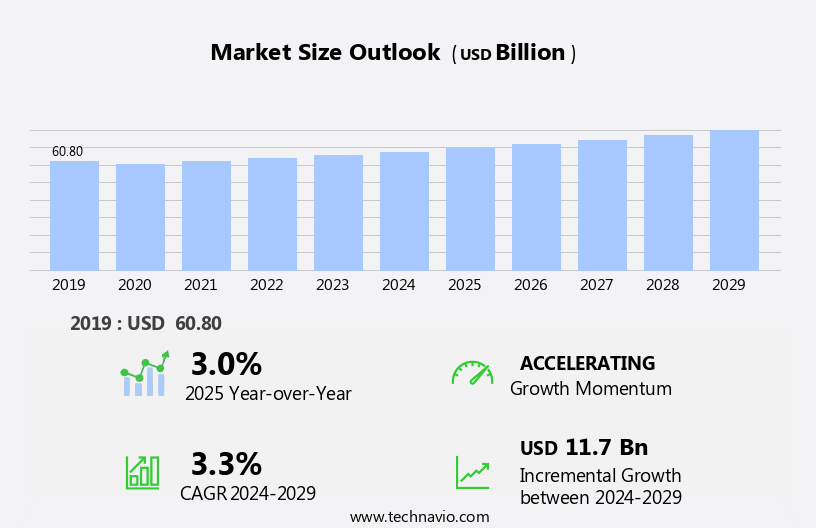
The industrial lubricants market size is forecast to increase by USD 11.7 billion, at a CAGR of 3.3% between 2024 and 2029.
- The market is experiencing significant growth, driven primarily by the increasing demand from end-user industries such as manufacturing, power generation, and transportation. This trend is attributed to the crucial role lubricants play in enhancing machinery efficiency, reducing downtime, and ensuring optimal performance. Another key market driver is the strategic formation of alliances between lubricant manufacturers and end-users to develop customized solutions tailored to specific industry needs. However, the market landscape is not without challenges. Fluctuations in crude oil prices pose a significant threat to the industrial lubricants industry, as they directly impact the production costs and, consequently, the selling prices.
- Additionally, the growing emphasis on energy efficiency and environmental sustainability is leading to the adoption of advanced lubricant technologies, which can be costly for some manufacturers. Companies must navigate these challenges by implementing strategic pricing models, exploring alternative raw material sources, and investing in research and development to create eco-friendly and cost-effective solutions. By staying agile and responsive to market dynamics, players in the market can capitalize on the growing demand and maintain a competitive edge.
What will be the Size of the Industrial Lubricants Market during the forecast period?
Explore in-depth regional segment analysis with market size data - historical 2019-2023 and forecasts 2025-2029 - in the full report.
Request Free Sample
The market continues to evolve, driven by the dynamic interplay of various factors. Applications span numerous sectors, from food processing to heavy equipment manufacturing, where fire resistance and lubrication optimization are paramount. In this context, anti-wear additives play a crucial role in ensuring friction reduction and wear resistance. Base oils, such as mineral, synthetic, and ester-based, serve as the foundation, while viscosity index improvers and pour point depressants optimize performance in diverse operating conditions. Hydraulic fluids, essential for industrial machinery, require oxidation stability and high flash points for optimal operation. Corrosion inhibitors and lubrication systems protect against environmental impact and ensure lubricant longevity.
Automatic lubrication systems streamline maintenance, while bio-based lubricants offer sustainability benefits. Centralized lubrication and vegetable oils are gaining traction due to their environmental appeal. Spectrometric analysis and wear debris analysis are integral to monitoring lubricant performance and identifying potential issues. Market dynamics remain fluid, with ongoing research and development in areas like lubricant additives, fire resistance, and lubrication management. The continuous pursuit of enhanced lubricant properties and improved environmental sustainability characterizes the evolving industrial lubricants landscape.
How is this Industrial Lubricants Industry segmented?
The industrial lubricants industry research report provides comprehensive data (region-wise segment analysis), with forecasts and estimates in "USD billion" for the period 2025-2029, as well as historical data from 2019-2023 for the following segments.
- Product
- Mineral oil lubricants
- Synthetic lubricants
- Bio-based lubricants
- Type
- Hydraulic fluid
- Metal working fluid
- Others
- End-user
- Manufacturing
- Construction
- Oil and gas
- Power generation
- Others
- Geography
- North America
- US
- Canada
- Europe
- Germany
- UK
- APAC
- Australia
- China
- India
- Japan
- South Korea
- South America
- Brazil
- Rest of World (ROW)
- North America
By Product Insights
The mineral oil lubricants segment is estimated to witness significant growth during the forecast period.
Mineral oil lubricants, derived from refined petroleum, are a staple in various industries due to their effectiveness in reducing friction and wear between moving machine parts. Primarily composed of hydrocarbons, these oils come in a wide range of viscosities, making them suitable for diverse operational conditions. Their cost-effectiveness and temperature stability have made them a preferred choice in numerous applications. In industrial machinery, they are commonly used in pumps, compressors, and hydraulic systems. Anti-wear additives are often incorporated into mineral oil lubricants to enhance their performance and extend equipment life. Lubricant analysis, including spectrometric analysis and wear debris analysis, plays a crucial role in monitoring lubricant condition and identifying potential issues.
Oxidation stability is another essential factor in lubricant selection, particularly for applications in food processing and other sensitive industries. Gear oils and hydraulic fluids, specialized types of mineral oil lubricants, cater to specific machinery requirements. Friction reduction is a key benefit of these lubricants, as is their ability to improve lubrication performance and reduce wear resistance. Base oils, such as polyalphaolefins (PAOs) and synthetic oils, are often used as the foundation for these specialized lubricants. Viscosity index improvers, pour point depressants, and other additives are used to enhance the performance of mineral oil lubricants in various applications. Cutting fluids and friction modifiers are essential in heavy manufacturing industries, while corrosion inhibitors and lubrication systems protect against environmental impact and equipment damage.
Bio-based lubricants and centralized lubrication systems are emerging trends in the lubricants market. These alternatives offer environmental benefits and improved efficiency, making them increasingly popular in industries seeking to reduce their carbon footprint and optimize lubrication management. Regardless of the specific type of lubricant used, proper monitoring and maintenance are crucial to ensuring optimal performance and equipment longevity.
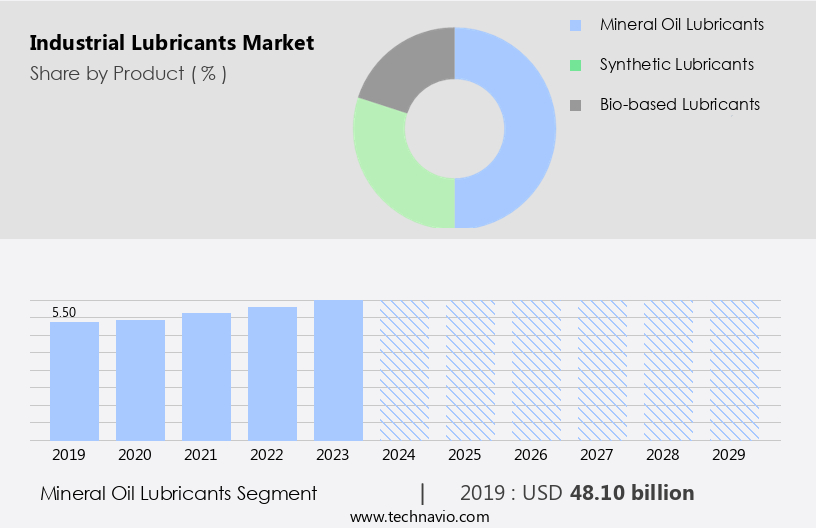
The Mineral oil lubricants segment was valued at USD 48.10 billion in 2019 and showed a gradual increase during the forecast period.
Regional Analysis
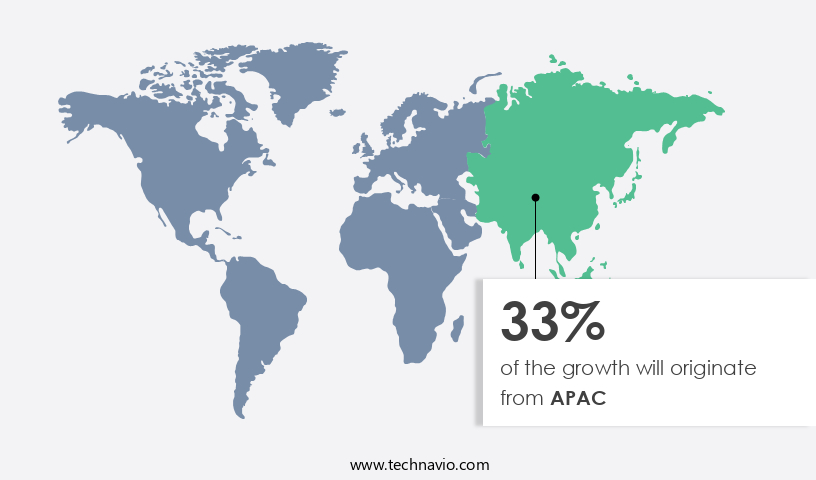
APAC is estimated to contribute 33% to the growth of the global market during the forecast period. Technavio's analysts have elaborately explained the regional trends and drivers that shape the market during the forecast period.
The market in the region experiences growth due to the increased demand and consumption in industries like heavy engineering, steel manufacturing, mining and refining, and plastics and polymers. Key contributing countries include China, India, Japan, and South Korea. The market's diversity is driven by industrialization, business expansion, and a multitude of regional and local companies, such as Royal Dutch Shell Plc (Shell), BP Plc (BP), and Exxon Mobil Corp. Anti-wear additives play a crucial role in enhancing lubricant performance and reducing wear and tear in industrial machinery. Lubricant analysis, including spectrometric analysis and wear debris analysis, is essential for monitoring lubricant condition and ensuring optimal performance.
Oxidation stability is another critical factor, particularly in food processing applications, where the use of gear oils and hydraulic fluids requires high resistance to oxidation. Friction reduction is another key benefit of industrial lubricants, which is achieved through the use of friction modifiers, pour point depressants, and viscosity index improvers. Environmental impact and fire resistance are also essential considerations, driving the adoption of bio-based lubricants, synthetic oils, and mineral oils with high flash points. Lubrication optimization through automatic lubrication systems and centralized lubrication has gained popularity for its cost-effectiveness and improved efficiency. Additionally, the market is witnessing the emergence of advanced technologies like lubricant dispensing systems and wear resistance additives.
Corrosion inhibitors and lubrication management systems are also essential components of the market, ensuring the protection of equipment and the reduction of maintenance costs. The market's growth is further fueled by the increasing demand for heavy equipment lubricants and hydraulic fluids, which require high performance and reliability. In summary, the market in the region is experiencing growth due to the increasing demand in key industries, the presence of numerous players, and the adoption of advanced technologies to improve performance and reduce costs. The market's diversity is driven by factors such as oxidation stability, friction reduction, environmental impact, and fire resistance, among others.
Market Dynamics
Our researchers analyzed the data with 2024 as the base year, along with the key drivers, trends, and challenges. A holistic analysis of drivers will help companies refine their marketing strategies to gain a competitive advantage.
What are the key market drivers leading to the rise in the adoption of Industrial Lubricants Industry?
- The primary force fueling market growth is the escalating demand from various end-user industries.
- The market experiences significant growth due to its application in various industries, including construction, steel and cement, wind energy, agriculture, mining and oil drilling, and marine and aerospace sectors. In the construction industry, industrial lubricants are utilized in various types of construction equipment to ensure anti-wear properties, resistance to corrosion, excellent lubricity, water tolerance, and filterability. Hydraulic fluids derived from these lubricants are employed in earthmoving machinery like crawler excavators, mini excavators, wheeled excavators, wheeled dozers, and skid-steer loaders, owing to their superior energy transmission capacity. In the steel and cement industry, industrial lubricants play a crucial role in extending the drain intervals for equipment and enhancing lubrication efficiency, wear resistance of friction pairs, and prolonging equipment lifespan.
- Lubricant additives, such as friction modifiers, pour point depressants, and wear debris analysis, contribute significantly to improving lubrication performance and reducing downtime. Furthermore, the increasing adoption of ester-based lubricants and advanced lubricant dispensing systems caters to the growing demand for eco-friendly and efficient lubrication solutions. However, the environmental impact of industrial lubricants remains a concern, necessitating continuous research and development in this area.
What are the market trends shaping the Industrial Lubricants Industry?
- Industrial lubricants are currently experiencing a notable trend towards the formation of strategic alliances. This development reflects the growing importance of collaboration and innovation within the market.
- The market is marked by strategic collaborations and alliances among manufacturers, raw material suppliers, and distributors. These partnerships enable uninterrupted supply and ensure a consistent market presence. For instance, in April 2024, FUCHS signed an agreement to acquire LUBCON Group, a specialist in high-performance lubricants. Such strategic acquisitions broaden product portfolios and enhance operational capabilities, propelling market growth. Key market participants focus on innovation to cater to diverse industries, including heavy equipment, hydraulic fluids, and lubrication management systems.
- They invest in research and development to produce advanced lubricants with features like fire resistance, pour point improvement, and corrosion inhibition. Additionally, there is a growing trend towards automatic lubrication systems and bio-based lubricants, reflecting the market's dynamic nature.
What challenges does the Industrial Lubricants Industry face during its growth?
- The volatility of crude oil prices poses a significant challenge to the growth of the industry.
- Industrial lubricants are primarily derived from the refining of crude oil through fractionation. Mineral oils dominate the market due to their widespread usage. The oil and gas sector serves as a significant supplier of raw materials for industrial lubricant manufacturers. However, the volatility of global crude oil prices negatively impacts the cost of these raw materials and, consequently, the price of industrial lubricants. The increasing demand for crude oil, coupled with a decreasing supply, has led to a surge in global crude oil prices. This price volatility directly influences the revenue and profit margins of industrial lubricant manufacturers.
- Centralized lubrication systems have gained popularity due to their efficiency and cost-effectiveness. Synthetic oils, such as polyalphaolefins (PAOs), are increasingly being used due to their superior performance in extreme temperatures and heavy loads. Vegetable oils are also gaining traction due to their eco-friendly nature and biodegradability. Oil analysis is crucial for monitoring the performance and condition of industrial lubricants. Oxidation inhibitors are essential additives that prevent the oxidation of lubricants, ensuring their longevity and effectiveness. Corrosion protection is another critical factor in selecting the right industrial lubricant for specific applications. The flash point of a lubricant is a significant consideration for applications that require high temperatures.
- In conclusion, the market is influenced by various factors, including raw material prices, technological advancements, and application requirements. Manufacturers must continually adapt to these market dynamics to remain competitive.
Exclusive Customer Landscape
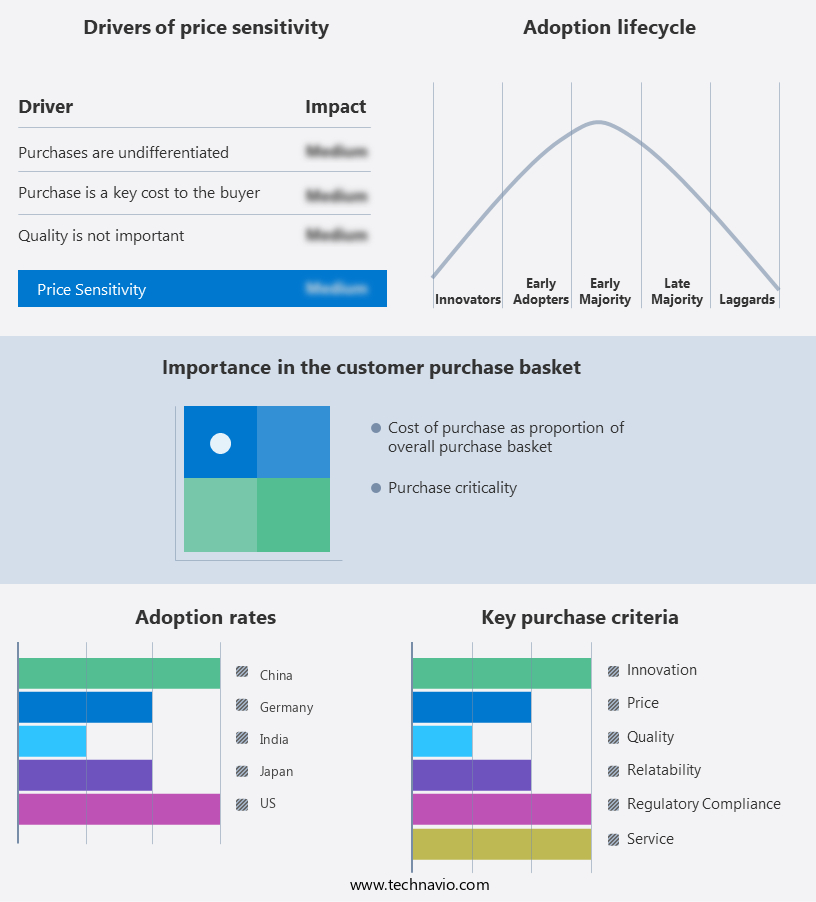
The industrial lubricants market forecasting report includes the adoption lifecycle of the market, covering from the innovator's stage to the laggard's stage. It focuses on adoption rates in different regions based on penetration. Furthermore, the industrial lubricants market report also includes key purchase criteria and drivers of price sensitivity to help companies evaluate and develop their market growth analysis strategies.
Customer Landscape
Key Companies & Market Insights
Companies are implementing various strategies, such as strategic alliances, industrial lubricants market forecast, partnerships, mergers and acquisitions, geographical expansion, and product/service launches, to enhance their presence in the industry.
Bharat Petroleum Corp. Ltd. - The company's subsidiary, MAK lubricants, a leading industrial lubricant provider, caters to diverse sectors such as textiles, power generation, sugar processing, steel manufacturing, and off-highway vehicles.
The industry research and growth report includes detailed analyses of the competitive landscape of the market and information about key companies, including:
- Bharat Petroleum Corp. Ltd.
- Castrol Ltd.
- Chevron Corp.
- ENEOS Holdings Inc.
- Exxon Mobil Corp.
- FUCHS SE
- Idemitsu Kosan Co. Ltd.
- Indian Oil Corp. Ltd.
- Kluber Lubrication Munchen SE and Co. KG
- PetroChina Co. Ltd.
- Petroleo Brasileiro SA
- Phillips 66 Co.
- PJSC LUKOIL
- Quaker Houghton
- Sinopec Shanghai Petrochemical Co. Ltd.
- Shell plc
- The Lubrizol Corp.
- TotalEnergies SE
- Valvoline Inc.
- Zeller and Gmelin GmbH and Co. KG.
Qualitative and quantitative analysis of companies has been conducted to help clients understand the wider business environment as well as the strengths and weaknesses of key industry players. Data is qualitatively analyzed to categorize companies as pure play, category-focused, industry-focused, and diversified; it is quantitatively analyzed to categorize companies as dominant, leading, strong, tentative, and weak.
Recent Development and News in Industrial Lubricants Market
- In February 2023, Shell announced the launch of its new synthetic industrial lubricant, Helix Eco, designed to reduce greenhouse gas emissions by up to 10% in heavy-duty applications compared to conventional oils (Shell press release). This innovative product aligns with the growing market trend towards sustainable and eco-friendly industrial lubricants.
- In October 2024, ExxonMobil and Chevron Phillips Chemicals entered into a strategic collaboration to expand their lubricant base oil production capacity by 500,000 metric tons per year (ExxonMobil press release). This partnership aims to strengthen their market position and meet the increasing demand for industrial lubricants, particularly in the automotive and manufacturing sectors.
- In March 2025, TotalEnergies' lubricants business, Total Lubrifiants, secured a major regulatory approval from the European Chemicals Agency (ECHA) for its new biodegradable industrial lubricant, Eco-Lubrify (Total Lubrifiants press release). This approval marks a significant milestone in the company's commitment to sustainable industrial lubricants and its expansion into the European market.
- In May 2025, FUCHS Petrolub, a leading global supplier of lubricants and related services, acquired the industrial lubricants business of INEOS Oil & Gas (FUCHS Petrolub press release). This strategic acquisition will enable FUCHS Petrolub to expand its product portfolio and market presence, particularly in the North American market. The financial terms of the deal were not disclosed.
Research Analyst Overview
- The market encompasses a diverse range of products, including penetrating oils, dry lubrication, solid lubricants, assembly lubricants, release agents, and specialty lubricants. These lubricants serve essential functions in various industries, enhancing machinery performance and reducing wear and tear. ISO and API standards play a crucial role in ensuring product quality and compatibility. Manufacturers adhere to these regulations to meet customer expectations and maintain industry credibility. High-performance lubricants, such as those with low viscosity or high temperature capabilities, are increasingly popular due to their ability to improve efficiency and productivity. Greener lubricants, including those with lower carbon footprints, are gaining traction as companies prioritize sustainability.
- Lubricant formulation and testing are integral aspects of the market. Adherence to ASTM and Din standards guarantees product consistency and reliability. Lubricant recycling and certification, offered by various certification bodies, contribute to cost savings and environmental sustainability. Anti-seize compounds, cleaning agents, and lubricant compatibility are other essential considerations. As industries evolve, lubricant requirements change, necessitating continuous innovation and adaptation. Solid lubricants and low temperature lubricants cater to specific applications, such as extreme conditions or high-load environments. Incorporating these specialized lubricants into machinery can lead to significant performance enhancements. The market for lubricants is dynamic, with ongoing advancements in technology and evolving industry needs shaping its landscape.
- Companies must remain vigilant in addressing emerging trends, such as the demand for more sustainable and high-performance lubricants, to stay competitive.
Dive into Technavio's robust research methodology, blending expert interviews, extensive data synthesis, and validated models for unparalleled Industrial Lubricants Market insights. See full methodology.
|
Market Scope |
|
|
Report Coverage |
Details |
|
Page number |
235 |
|
Base year |
2024 |
|
Historic period |
2019-2023 |
|
Forecast period |
2025-2029 |
|
Growth momentum & CAGR |
Accelerate at a CAGR of 3.3% |
|
Market growth 2025-2029 |
USD 11.7 billion |
|
Market structure |
Fragmented |
|
YoY growth 2024-2025(%) |
3.0 |
|
Key countries |
US, China, Japan, India, South Korea, UK, Australia, Germany, Canada, and Brazil |
|
Competitive landscape |
Leading Companies, Market Positioning of Companies, Competitive Strategies, and Industry Risks |
What are the Key Data Covered in this Industrial Lubricants Market Research and Growth Report?
- CAGR of the Industrial Lubricants industry during the forecast period
- Detailed information on factors that will drive the growth and forecasting between 2025 and 2029
- Precise estimation of the size of the market and its contribution of the industry in focus to the parent market
- Accurate predictions about upcoming growth and trends and changes in consumer behaviour
- Growth of the market across APAC, Europe, North America, Middle East and Africa, and South America
- Thorough analysis of the market's competitive landscape and detailed information about companies
- Comprehensive analysis of factors that will challenge the industrial lubricants market growth of industry companies
We can help! Our analysts can customize this industrial lubricants market research report to meet your requirements.
 RIA -
RIA - 
