Hydraulic Fluids Market Analysis, Size, and Forecast 2025-2029: North America (US and Canada), Europe (France, Germany, Russia, UK), Middle East and Africa , APAC (China, India, Japan, South Korea), South America , and Rest of World (ROW)

Hydraulic Fluids Market Analysis, Size, and Forecast 2025-2029:
North America (US and Canada), Europe (France, Germany, Russia, UK), Middle East and Africa , APAC (China, India, Japan, South Korea), South America , and Rest of World (ROW)

Published: Apr 2025 221 Pages SKU: IRTNTR70998

Market Overview at a Glance

$1.48 B
Market Opportunity
3.1%
CAGR
2.9
YoY growth 2024-2025(%)

Hydraulic Fluids Market Size 2025-2029

The hydraulic fluids market size is forecast to increase by USD 1.48 billion, at a CAGR of 3.1% between 2024 and 2029.

  • The market is characterized by three key drivers: the rapid rise in construction and industrialization in emerging economies, the shift toward bio-based and environmentally friendly fluids, and the volatility in raw material prices. The industrial expansion in developing nations is fueling a significant demand for hydraulic fluids due to increased infrastructure projects and manufacturing activities. Simultaneously, the environmental concerns and regulatory pressures are pushing the market towards the adoption of eco-friendly hydraulic fluids. However, the market faces challenges as well. The raw material price volatility poses a significant threat to the profitability of hydraulic fluid manufacturers, necessitating effective supply chain management strategies and price risk mitigation measures.
  • Companies must navigate these dynamics to capitalize on the growth opportunities and maintain a competitive edge in the market. The strategic landscape requires a proactive approach to market trends and challenges, with a focus on innovation, sustainability, and operational efficiency.

What will be the Size of the Hydraulic Fluids Market during the forecast period?

Hydraulic Fluids Market Size

Explore in-depth regional segment analysis with market size data - historical 2019-2023 and forecasts 2025-2029 - in the full report.  
Request Free Sample

The market is characterized by its continuous evolution and dynamic nature, with ongoing developments and applications across various sectors. Hydraulic systems are integral to mobile hydraulics, electro-hydraulic systems, automotive hydraulics, industrial hydraulics, marine hydraulics, aerospace hydraes, and more. Fluid performance is a critical factor, with pressure range, valve operation, and pump performance influencing system efficiency and reliability. Hydraulic system troubleshooting requires fluid optimization, filtration, and conditioning to maintain optimal operating conditions. Environmental regulations and energy efficiency concerns have led to advancements in hydraulic fluids, including bio-based alternatives and fire-resistant formulations. Hydraulic system design and upgrades prioritize material compatibility, system integration, and safety standards.

Durability testing, temperature range, and system maintenance are essential for preventing fluid degradation, monitoring particle contamination, and ensuring actuator efficiency. Fluid analysis and selection are crucial for cost optimization and adhering to application requirements. Hydraulic system testing and design incorporate performance testing, flash point, hydrolytic stability, and viscosity index assessments. Leakage control, water content, and aerospace hydraulics require specialized attention. Fault diagnosis and safety standards are paramount in hydraulic system repair, with energy efficiency and load capacity considerations shaping future market trends. The ongoing unfolding of market activities underscores the importance of fluid compatibility, oxidation stability, and anti-wear additives in maintaining hydraulic system performance.

How is this Hydraulic Fluids Industry segmented?

The hydraulic fluids industry research report provides comprehensive data (region-wise segment analysis), with forecasts and estimates in "USD million" for the period 2025-2029, as well as historical data from 2019-2023 for the following segments.

  • Type
    • Mineral-base
    • Synthetic base
    • Bio-based
  • Application
    • Construction machinery
    • Agricultural machinery
    • Mining machinery
    • Oil and gas machinery
    • Others
  • Geography
    • North America
      • US
      • Canada
    • Europe
      • France
      • Germany
      • Russia
      • UK
    • APAC
      • China
      • India
      • Japan
      • South Korea
    • Rest of World (ROW)

By Type Insights

The mineral-base segment is estimated to witness significant growth during the forecast period.

In the realm of hydraulic fluids, mineral-based options dominate the market due to their cost-effectiveness and widespread availability. Derived from refined crude oil, these fluids cater to a range of applications, extending from construction machinery and agricultural equipment to industrial manufacturing and marine and transport sectors. In the construction industry, mineral-based hydraulic fluids are indispensable for powering excavators, cranes, bulldozers, and loaders, ensuring efficient and dependable performance through lubrication and power transmission. In agriculture, these fluids play a crucial role in supporting the automation and power needs of modern farming operations, enabling the effective use of equipment such as tractors, combine harvesters, plows, and sprayers.

Beyond their basic functionality, hydraulic fluids also impact system efficiency, durability, and safety. For instance, fluid optimization is essential for maintaining optimal system performance and extending fluid life. Operating conditions, such as temperature range and pressure, significantly influence fluid selection and system design. Fluid conditioning, including filtration and air release properties, is vital for preventing contamination and ensuring system reliability. Advanced hydraulic systems, such as proportional and servo-hydraulic systems, require specialized fluids with specific properties, like high viscosity index and hydrolytic stability. Industrial hydraulic systems, including those in manufacturing and marine applications, often operate under extreme conditions, necessitating fluids with high load capacity, energy efficiency, and material compatibility.

Safety standards and environmental regulations also influence fluid selection, with fire-resistant hydraulic fluids and bio-based options gaining popularity. Hydraulic system troubleshooting and maintenance are ongoing concerns, requiring fluid monitoring, analysis, and disposal or recycling strategies. In summary, mineral-based hydraulic fluids serve as the backbone of various industries, from construction and agriculture to manufacturing and transportation. Their role extends beyond mere power transmission and lubrication, encompassing system optimization, efficiency, and safety considerations. The evolving requirements of advanced hydraulic systems, environmental regulations, and safety standards continue to shape the market dynamics and trends in hydraulic fluids.

Hydraulic Fluids Market Size

Request Free Sample

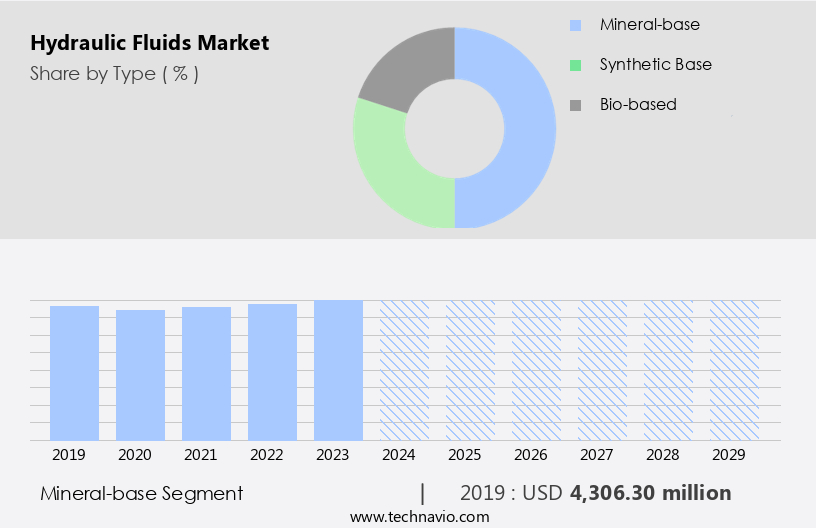
The Mineral-base segment was valued at USD 4.31 billion in 2019 and showed a gradual increase during the forecast period.

Regional Analysis

APAC is estimated to contribute 45% to the growth of the global market during the forecast period. Technavio's analysts have elaborately explained the regional trends and drivers that shape the market during the forecast period.

Hydraulic Fluids Market Share by Geography

 Request Free Sample

The market in Asia-Pacific (APAC) is experiencing significant growth due to the region's industrial and economic expansion. Hydraulic fluids are essential components in various industries, including automotive, industrial, marine, and aerospace, among others. In the automotive sector, the production of cars in countries like China, Japan, and South Korea is on the rise. For instance, China produced around 21 million units from January to September 2024, representing a 2% year-on-year increase. Similarly, Japan witnessed a 17% surge in car production in 2023, with a total of 7.5 million units produced, largely due to a rebound from low output in the previous year.

Beyond automotive applications, industrial growth in APAC is also fueling the demand for hydraulic fluids. Industrial hydraulics are utilized in various heavy machinery and equipment, such as construction equipment, manufacturing machinery, and mining equipment. These industries are experiencing a surge in activity, leading to an increased need for hydraulic fluids. Moreover, the marine and aerospace industries in APAC are also contributing to the growth of the market. Marine hydraulics are used in various applications, including propulsion systems, steering systems, and deck equipment. In the aerospace sector, hydraulic fluids are used in various systems, including landing gear, braking systems, and flight control systems.

To ensure optimal performance and longevity of hydraulic systems, various factors must be considered, such as pressure range, valve operation, fluid analysis, fluid selection, and hydraulic system testing. Proper fluid conditioning, including filtration, air release properties, and fluid monitoring, is crucial to maintain system efficiency and prevent contamination. Advanced hydraulic systems, such as proportional hydraulic systems and servo-hydraulic systems, require specialized fluids that offer high performance and compatibility with various materials. Environmental regulations are also influencing the market in APAC. Bio-based hydraulic fluids and fluids with improved energy efficiency and reduced environmental impact are gaining popularity. Additionally, the importance of safety standards, reliability testing, and system integration is increasing, as hydraulic systems are used in critical applications where safety and efficiency are paramount.

In conclusion, the market in APAC is experiencing robust growth due to the diverse applications and expanding industrial activities in the region. The increasing demand for hydraulic fluids in the automotive, industrial, marine, and aerospace sectors is driving market growth. Proper fluid selection, conditioning, and maintenance are essential to ensure optimal system performance and longevity. The market is also being influenced by factors such as environmental regulations, safety standards, and the development of advanced hydraulic systems.

Market Dynamics

Our researchers analyzed the data with 2024 as the base year, along with the key drivers, trends, and challenges. A holistic analysis of drivers will help companies refine their marketing strategies to gain a competitive advantage.

What are the key market drivers leading to the rise in the adoption of Hydraulic Fluids Industry?

  • In emerging economies, the process of rapid industrialization serves as the primary catalyst for market growth. 
  • The market experiences significant growth due to the increasing industrialization in various economies. This expansion in industrial sectors results in a heightened demand for hydraulic systems in machinery and equipment used in manufacturing processes. For instance, China's industrial sector reported a 5.8 percent year-on-year increase in production in 2024, as per the National Bureau of Statistics of China. This growth underscores the necessity of hydraulic fluids for efficient operation, lubrication, and power transmission in industrial machinery. Reliability testing, load capacity, system efficiency, and safety standards are crucial factors influencing the selection of hydraulic fluids. Moreover, system integration, energy efficiency, viscosity index, environmental regulations, leakage control, water content, and fire-resistant properties are essential considerations for hydraulic system repair and maintenance.
  • Environmental factors, such as temperature and pressure, significantly impact the performance of hydraulic fluids. Aerospace hydraulics and servo-hydraulic systems require specialized hydraulic fluids to meet stringent safety and performance standards. Fault diagnosis and maintenance are essential to ensure the longevity and optimal performance of hydraulic systems. Safety standards and regulations, such as those set by the American Society of Mechanical Engineers (ASME) and the Society of Automotive Engineers (SAE), play a crucial role in the market. Compliance with these standards ensures the safety and reliability of hydraulic systems in various industries, including manufacturing, construction, transportation, and aerospace.
  • In conclusion, the market is driven by the growing industrialization and the increasing demand for efficient, reliable, and safe hydraulic systems. Factors such as system integration, energy efficiency, safety standards, environmental regulations, and fault diagnosis are essential considerations for the selection and maintenance of hydraulic fluids.

What are the market trends shaping the Hydraulic Fluids Industry?

  • The market is experiencing a significant shift towards bio-based and environmentally friendly fluids. This trend reflects a growing emphasis on sustainability and reducing carbon footprints in various industries.
  • Hydraulic fluids play a crucial role in ensuring the efficient operation of industrial machinery. The market for hydraulic fluids is driven by several factors, including the need for durability, temperature range compatibility, and system optimization. Fluid degradation and particle contamination are major concerns in hydraulic system maintenance, leading to the demand for fluids with high oxidation stability and anti-wear additives. Biodegradable hydraulic fluids are gaining popularity due to increasing environmental awareness and regulatory pressure. These fluids, which have a renewable carbon content and meet top-tier environmental standards, are especially in demand in sensitive industries such as agriculture, forestry, and marine applications.
  • For instance, Chevron's Clarity Bio EliteSyn AW, a next-generation biodegradable hydraulic fluid, delivers over 10,000 hours of oxidation stability and features a wildlife-safe, zinc-free formulation. It ensures seal compatibility for smooth transitions and meets stringent environmental standards such as EU Ecolabel, US EPA VGP, and OECD biodegradability. Fluid monitoring and recycling are essential practices to minimize fluid disposal and reduce costs. Pour point and temperature range are critical factors in selecting the right hydraulic fluid for specific applications. Proper fluid compatibility is essential to prevent system damage and ensure actuator efficiency. Overall, the market is expected to grow as industries continue to prioritize system optimization, environmental sustainability, and cost savings.

What challenges does the Hydraulic Fluids Industry face during its growth?

  • The volatility in raw material prices poses a significant challenge to the industry's growth trajectory, necessitating close monitoring and adaptive business strategies. 
  • The market is influenced by the volatility in crude oil prices, acting as the primary feedstock for mineral-based hydraulic fluids. Crude oil price fluctuations directly impact production costs, shaping pricing strategies and profit margins for manufacturers. In early 2024, Brent crude oil experienced a significant surge, reaching a peak of USD91.17 per barrel on April 5, due to escalating geopolitical tensions in the Middle East. However, this trend proved short-lived, as prices declined to USD68.83 per barrel by September 10, the lowest in two years. This decrease was mainly attributed to waning demand from major consumers like China and increased production from non-OPEC countries.
  • Mobile hydraulics, including automotive and industrial applications, require optimal fluid performance to ensure efficient valve operation and hydraulic system troubleshooting. Fluid contamination can negatively impact hydraulic system performance, necessitating the importance of fluid filtration and performance testing. In addition, electro-hydraulic systems and marine hydraulics have unique application requirements, further emphasizing the need for fluid optimization and appropriate fluid life management. The market's focus on fluid optimization and advanced filtration technologies is expected to drive growth while maintaining stringent performance standards and ensuring a high flash point to prevent potential fires.

Exclusive Customer Landscape

The hydraulic fluids market forecasting report includes the adoption lifecycle of the market, covering from the innovator's stage to the laggard's stage. It focuses on adoption rates in different regions based on penetration. Furthermore, the hydraulic fluids market report also includes key purchase criteria and drivers of price sensitivity to help companies evaluate and develop their market growth analysis strategies.

Hydraulic Fluids Market Share by Geography

 Customer Landscape

Key Companies & Market Insights

Companies are implementing various strategies, such as strategic alliances, hydraulic fluids market forecast, partnerships, mergers and acquisitions, geographical expansion, and product/service launches, to enhance their presence in the industry.

BASF SE - Hydraulic fluids, including our top-performing HYDRAULAN brand, deliver superior brake safety by meeting and surpassing international standards. These fluids excel in low-temperature environments, ensuring optimal braking performance. Our commitment to quality and innovation sets US apart in the industry.

The industry research and growth report includes detailed analyses of the competitive landscape of the market and information about key companies, including:

  • BASF SE
  • BP Plc
  • Chevron Corp.
  • Clariant International Ltd.
  • CONDAT
  • Eastman Chemical Co.
  • Exxon Mobil Corp.
  • FUCHS SE
  • NYCO
  • PCC SE
  • Petro Canada Lubricants Inc
  • Phillips 66 Co.
  • PJSC LUKOIL
  • Schaeffer Manufacturing Co.
  • Shell plc
  • Sinopec Shanghai Petrochemical Co. Ltd.
  • The Dow Chemical Co.
  • TotalEnergies SE
  • Valvoline Inc.

Qualitative and quantitative analysis of companies has been conducted to help clients understand the wider business environment as well as the strengths and weaknesses of key industry players. Data is qualitatively analyzed to categorize companies as pure play, category-focused, industry-focused, and diversified; it is quantitatively analyzed to categorize companies as dominant, leading, strong, tentative, and weak.

Recent Development and News in Hydraulic Fluids Market

  • In February 2024, BASF Corporation announced the launch of Elvaxar HF 220, a new high-performance hydraulic fluid, designed to provide improved oxidation stability and extended oil life for various industrial applications (BASF press release, 2024). This innovative product expansion underscores BASF's commitment to delivering advanced hydraulic fluid solutions to its customers.
  • In July 2024, Shell and Chevron Phillips Chemical Company LLC entered into a strategic collaboration to develop and commercialize a new line of synthetic hydraulic fluids using Shell's proprietary Eco-Marine Technology. This partnership combines Shell's expertise in hydraulic fluids and Chevron Phillips Chemical's advanced synthetic base oil technology, aiming to create more sustainable and high-performance hydraulic fluids (Shell press release, 2024).
  • In March 2025, ExxonMobil Chemical Company completed the acquisition of Afton Chemical Corporation, a leading global supplier of performance additives and specialty chemicals for fuels and lubricants, including hydraulic fluids. This acquisition will strengthen ExxonMobil's position in the market and expand its product offerings (ExxonMobil press release, 2025).
  • In October 2025, the European Union passed new regulations on fluids used in hydraulic systems, requiring them to meet stringent environmental standards. These regulations, part of the European Green Deal initiative, aim to reduce greenhouse gas emissions and promote the use of renewable energy sources in the hydraulic fluids industry (European Commission press release, 2025). This regulatory development is expected to drive the demand for eco-friendly hydraulic fluids and encourage innovation in the sector.

Research Analyst Overview

  • The hydraulics industry experiences continuous evolution, with key components such as hydraulic motors, pumps, and actuators driving progress. Hydraulic fluids, a vital element in this sector, undergoes significant advancements. Two notable trends include the adoption of eco-friendly alternatives and enhanced performance additives. Biodegradable hydraulic fluids, derived from renewable sources, gain traction due to their reduced environmental impact. These fluids, conforming to standards like ISO 6743-4 and ASTM D2882, offer a sustainable solution for businesses seeking to minimize their carbon footprint. Performance additives, such as extreme-pressure additives, anti-corrosion additives, and friction modifiers, play a crucial role in maintaining hydraulic system efficiency.
  • ASTM D2273, ASTM D97, and ASTM D6201 specify the test methods for evaluating these additives' effectiveness. Hydraulic systems' diverse applications necessitate a range of fluid viscosities. Low-viscosity hydraulic fluids, in accordance with ASTM D445, are suitable for systems requiring quick response times, while high-viscosity hydraulic fluids, as per ASTM D2170, are preferred for heavy-duty applications. Synthetic hydraulic fluids, as outlined in ASTM D4624, offer superior performance and longer service life compared to conventional mineral oil-based fluids. Hydraulic components, including fittings, seals, lines, reservoirs, cylinders, accumulators, filters, and valves, all benefit from the use of high-quality hydraulic fluids to ensure optimal performance and longevity.
  • Vegetable-based hydraulic fluids, an alternative to synthetic and mineral oil-based fluids, are gaining popularity due to their eco-friendliness and biodegradability. ASTM D93 specifies the test method for the determination of the viscosity of these fluids. In the realm of hydraulic components, hydraulic fittings, seals, pumps, motors, actuators, cylinders, accumulators, filters, valves, and reservoirs all play essential roles in the efficient operation of hydraulic systems. Ensuring the compatibility of these components with the appropriate hydraulic fluids is crucial for maintaining system performance and longevity.

Dive into Technavio's robust research methodology, blending expert interviews, extensive data synthesis, and validated models for unparalleled Hydraulic Fluids Market insights. See full methodology.

Market Scope

Report Coverage

Details

Page number

221

Base year

2024

Historic period

2019-2023

Forecast period

2025-2029

Growth momentum & CAGR

Accelerate at a CAGR of 3.1%

Market growth 2025-2029

USD 1484.4 million

Market structure

Fragmented

YoY growth 2024-2025(%)

2.9

Key countries

US, China, India, Germany, Japan, UK, Canada, South Korea, France, and Russia

Competitive landscape

Leading Companies, Market Positioning of Companies, Competitive Strategies, and Industry Risks

Request Free Sample

What are the Key Data Covered in this Hydraulic Fluids Market Research and Growth Report?

  • CAGR of the Hydraulic Fluids industry during the forecast period
  • Detailed information on factors that will drive the growth and forecasting between 2025 and 2029
  • Precise estimation of the size of the market and its contribution of the industry in focus to the parent market
  • Accurate predictions about upcoming growth and trends and changes in consumer behaviour
  • Growth of the market across APAC, North America, Europe, Middle East and Africa, and South America
  • Thorough analysis of the market's competitive landscape and detailed information about companies
  • Comprehensive analysis of factors that will challenge the hydraulic fluids market growth of industry companies

We can help! Our analysts can customize this hydraulic fluids market research report to meet your requirements.

Get in touch

1 Executive Summary

  • 1.1 Market overview
    • Executive Summary - Chart on Market Overview
    • Executive Summary - Data Table on Market Overview
    • Executive Summary - Chart on Global Market Characteristics
    • Executive Summary - Chart on Market by Geography
    • Executive Summary - Chart on Market Segmentation by Type
    • Executive Summary - Chart on Market Segmentation by Application
    • Executive Summary - Chart on Incremental Growth
    • Executive Summary - Data Table on Incremental Growth
    • Executive Summary - Chart on Company Market Positioning

2 Technavio Analysis

  • 2.1 Analysis of price sensitivity, lifecycle, customer purchase basket, adoption rates, and purchase criteria
    • Analysis of price sensitivity, lifecycle, customer purchase basket, adoption rates, and purchase criteria
  • 2.2 Criticality of inputs and Factors of differentiation
    • Overview on criticality of inputs and factors of differentiation
  • 2.3 Factors of disruption
    • Overview on factors of disruption
  • 2.4 Impact of drivers and challenges
    • Impact of drivers and challenges in 2024 and 2029

3 Market Landscape

  • 3.1 Market ecosystem
    • Parent Market
    • Data Table on - Parent Market
  • 3.2 Market characteristics
    • Market characteristics analysis
  • 3.3 Value chain analysis
    • Value chain analysis

4 Market Sizing

  • 4.1 Market definition
    • Offerings of companies included in the market definition
  • 4.2 Market segment analysis
    • Market segments
  • 4.3 Market size 2024
    • 4.4 Market outlook: Forecast for 2024-2029
      • Chart on Global - Market size and forecast 2024-2029 ($ million)
      • Data Table on Global - Market size and forecast 2024-2029 ($ million)
      • Chart on Global Market: Year-over-year growth 2024-2029 (%)
      • Data Table on Global Market: Year-over-year growth 2024-2029 (%)

    5 Historic Market Size

    • 5.1 Global Hydraulic Fluids Market 2019 - 2023
      • Historic Market Size - Data Table on Global Hydraulic Fluids Market 2019 - 2023 ($ million)
    • 5.2 Type segment analysis 2019 - 2023
      • Historic Market Size - Type Segment 2019 - 2023 ($ million)
    • 5.3 Application segment analysis 2019 - 2023
      • Historic Market Size - Application Segment 2019 - 2023 ($ million)
    • 5.4 Geography segment analysis 2019 - 2023
      • Historic Market Size - Geography Segment 2019 - 2023 ($ million)
    • 5.5 Country segment analysis 2019 - 2023
      • Historic Market Size - Country Segment 2019 - 2023 ($ million)

    6 Qualitative Analysis

    • 6.1 Impact Analysis of U.S. Tariffs on Global Hydraulic Fluids Market 2025-2029

      7 Five Forces Analysis

      • 7.1 Five forces summary
        • Five forces analysis - Comparison between 2024 and 2029
      • 7.2 Bargaining power of buyers
        • Bargaining power of buyers - Impact of key factors 2024 and 2029
      • 7.3 Bargaining power of suppliers
        • Bargaining power of suppliers - Impact of key factors in 2024 and 2029
      • 7.4 Threat of new entrants
        • Threat of new entrants - Impact of key factors in 2024 and 2029
      • 7.5 Threat of substitutes
        • Threat of substitutes - Impact of key factors in 2024 and 2029
      • 7.6 Threat of rivalry
        • Threat of rivalry - Impact of key factors in 2024 and 2029
      • 7.7 Market condition
        • Chart on Market condition - Five forces 2024 and 2029

      8 Market Segmentation by Type

      • 8.1 Market segments
        • Chart on Type - Market share 2024-2029 (%)
        • Data Table on Type - Market share 2024-2029 (%)
      • 8.2 Comparison by Type
        • Chart on Comparison by Type
        • Data Table on Comparison by Type
      • 8.3 Mineral-base - Market size and forecast 2024-2029
        • Chart on Mineral-base - Market size and forecast 2024-2029 ($ million)
        • Data Table on Mineral-base - Market size and forecast 2024-2029 ($ million)
        • Chart on Mineral-base - Year-over-year growth 2024-2029 (%)
        • Data Table on Mineral-base - Year-over-year growth 2024-2029 (%)
      • 8.4 Synthetic base - Market size and forecast 2024-2029
        • Chart on Synthetic base - Market size and forecast 2024-2029 ($ million)
        • Data Table on Synthetic base - Market size and forecast 2024-2029 ($ million)
        • Chart on Synthetic base - Year-over-year growth 2024-2029 (%)
        • Data Table on Synthetic base - Year-over-year growth 2024-2029 (%)
      • 8.5 Bio-based - Market size and forecast 2024-2029
        • Chart on Bio-based - Market size and forecast 2024-2029 ($ million)
        • Data Table on Bio-based - Market size and forecast 2024-2029 ($ million)
        • Chart on Bio-based - Year-over-year growth 2024-2029 (%)
        • Data Table on Bio-based - Year-over-year growth 2024-2029 (%)
      • 8.6 Market opportunity by Type
        • Market opportunity by Type ($ million)
        • Data Table on Market opportunity by Type ($ million)

      9 Market Segmentation by Application

      • 9.1 Market segments
        • Chart on Application - Market share 2024-2029 (%)
        • Data Table on Application - Market share 2024-2029 (%)
      • 9.2 Comparison by Application
        • Chart on Comparison by Application
        • Data Table on Comparison by Application
      • 9.3 Construction machinery - Market size and forecast 2024-2029
        • Chart on Construction machinery - Market size and forecast 2024-2029 ($ million)
        • Data Table on Construction machinery - Market size and forecast 2024-2029 ($ million)
        • Chart on Construction machinery - Year-over-year growth 2024-2029 (%)
        • Data Table on Construction machinery - Year-over-year growth 2024-2029 (%)
      • 9.4 Agricultural machinery - Market size and forecast 2024-2029
        • Chart on Agricultural machinery - Market size and forecast 2024-2029 ($ million)
        • Data Table on Agricultural machinery - Market size and forecast 2024-2029 ($ million)
        • Chart on Agricultural machinery - Year-over-year growth 2024-2029 (%)
        • Data Table on Agricultural machinery - Year-over-year growth 2024-2029 (%)
      • 9.5 Mining machinery - Market size and forecast 2024-2029
        • Chart on Mining machinery - Market size and forecast 2024-2029 ($ million)
        • Data Table on Mining machinery - Market size and forecast 2024-2029 ($ million)
        • Chart on Mining machinery - Year-over-year growth 2024-2029 (%)
        • Data Table on Mining machinery - Year-over-year growth 2024-2029 (%)
      • 9.6 Oil and gas machinery - Market size and forecast 2024-2029
        • Chart on Oil and gas machinery - Market size and forecast 2024-2029 ($ million)
        • Data Table on Oil and gas machinery - Market size and forecast 2024-2029 ($ million)
        • Chart on Oil and gas machinery - Year-over-year growth 2024-2029 (%)
        • Data Table on Oil and gas machinery - Year-over-year growth 2024-2029 (%)
      • 9.7 Others - Market size and forecast 2024-2029
        • Chart on Others - Market size and forecast 2024-2029 ($ million)
        • Data Table on Others - Market size and forecast 2024-2029 ($ million)
        • Chart on Others - Year-over-year growth 2024-2029 (%)
        • Data Table on Others - Year-over-year growth 2024-2029 (%)
      • 9.8 Market opportunity by Application
        • Market opportunity by Application ($ million)
        • Data Table on Market opportunity by Application ($ million)

      10 Customer Landscape

      • 10.1 Customer landscape overview
        • Analysis of price sensitivity, lifecycle, customer purchase basket, adoption rates, and purchase criteria

      11 Geographic Landscape

      • 11.1 Geographic segmentation
        • Chart on Market share by geography 2024-2029 (%)
        • Data Table on Market share by geography 2024-2029 (%)
      • 11.2 Geographic comparison
        • Chart on Geographic comparison
        • Data Table on Geographic comparison
      • 11.3 APAC - Market size and forecast 2024-2029
        • Chart on APAC - Market size and forecast 2024-2029 ($ million)
        • Data Table on APAC - Market size and forecast 2024-2029 ($ million)
        • Chart on APAC - Year-over-year growth 2024-2029 (%)
        • Data Table on APAC - Year-over-year growth 2024-2029 (%)
      • 11.4 North America - Market size and forecast 2024-2029
        • Chart on North America - Market size and forecast 2024-2029 ($ million)
        • Data Table on North America - Market size and forecast 2024-2029 ($ million)
        • Chart on North America - Year-over-year growth 2024-2029 (%)
        • Data Table on North America - Year-over-year growth 2024-2029 (%)
      • 11.5 Europe - Market size and forecast 2024-2029
        • Chart on Europe - Market size and forecast 2024-2029 ($ million)
        • Data Table on Europe - Market size and forecast 2024-2029 ($ million)
        • Chart on Europe - Year-over-year growth 2024-2029 (%)
        • Data Table on Europe - Year-over-year growth 2024-2029 (%)
      • 11.6 Middle East and Africa - Market size and forecast 2024-2029
        • Chart on Middle East and Africa - Market size and forecast 2024-2029 ($ million)
        • Data Table on Middle East and Africa - Market size and forecast 2024-2029 ($ million)
        • Chart on Middle East and Africa - Year-over-year growth 2024-2029 (%)
        • Data Table on Middle East and Africa - Year-over-year growth 2024-2029 (%)
      • 11.7 South America - Market size and forecast 2024-2029
        • Chart on South America - Market size and forecast 2024-2029 ($ million)
        • Data Table on South America - Market size and forecast 2024-2029 ($ million)
        • Chart on South America - Year-over-year growth 2024-2029 (%)
        • Data Table on South America - Year-over-year growth 2024-2029 (%)
      • 11.8 US - Market size and forecast 2024-2029
        • Chart on US - Market size and forecast 2024-2029 ($ million)
        • Data Table on US - Market size and forecast 2024-2029 ($ million)
        • Chart on US - Year-over-year growth 2024-2029 (%)
        • Data Table on US - Year-over-year growth 2024-2029 (%)
      • 11.9 China - Market size and forecast 2024-2029
        • Chart on China - Market size and forecast 2024-2029 ($ million)
        • Data Table on China - Market size and forecast 2024-2029 ($ million)
        • Chart on China - Year-over-year growth 2024-2029 (%)
        • Data Table on China - Year-over-year growth 2024-2029 (%)
      • 11.10 India - Market size and forecast 2024-2029
        • Chart on India - Market size and forecast 2024-2029 ($ million)
        • Data Table on India - Market size and forecast 2024-2029 ($ million)
        • Chart on India - Year-over-year growth 2024-2029 (%)
        • Data Table on India - Year-over-year growth 2024-2029 (%)
      • 11.11 Germany - Market size and forecast 2024-2029
        • Chart on Germany - Market size and forecast 2024-2029 ($ million)
        • Data Table on Germany - Market size and forecast 2024-2029 ($ million)
        • Chart on Germany - Year-over-year growth 2024-2029 (%)
        • Data Table on Germany - Year-over-year growth 2024-2029 (%)
      • 11.12 Japan - Market size and forecast 2024-2029
        • Chart on Japan - Market size and forecast 2024-2029 ($ million)
        • Data Table on Japan - Market size and forecast 2024-2029 ($ million)
        • Chart on Japan - Year-over-year growth 2024-2029 (%)
        • Data Table on Japan - Year-over-year growth 2024-2029 (%)
      • 11.13 UK - Market size and forecast 2024-2029
        • Chart on UK - Market size and forecast 2024-2029 ($ million)
        • Data Table on UK - Market size and forecast 2024-2029 ($ million)
        • Chart on UK - Year-over-year growth 2024-2029 (%)
        • Data Table on UK - Year-over-year growth 2024-2029 (%)
      • 11.14 Canada - Market size and forecast 2024-2029
        • Chart on Canada - Market size and forecast 2024-2029 ($ million)
        • Data Table on Canada - Market size and forecast 2024-2029 ($ million)
        • Chart on Canada - Year-over-year growth 2024-2029 (%)
        • Data Table on Canada - Year-over-year growth 2024-2029 (%)
      • 11.15 South Korea - Market size and forecast 2024-2029
        • Chart on South Korea - Market size and forecast 2024-2029 ($ million)
        • Data Table on South Korea - Market size and forecast 2024-2029 ($ million)
        • Chart on South Korea - Year-over-year growth 2024-2029 (%)
        • Data Table on South Korea - Year-over-year growth 2024-2029 (%)
      • 11.16 France - Market size and forecast 2024-2029
        • Chart on France - Market size and forecast 2024-2029 ($ million)
        • Data Table on France - Market size and forecast 2024-2029 ($ million)
        • Chart on France - Year-over-year growth 2024-2029 (%)
        • Data Table on France - Year-over-year growth 2024-2029 (%)
      • 11.17 Russia - Market size and forecast 2024-2029
        • Chart on Russia - Market size and forecast 2024-2029 ($ million)
        • Data Table on Russia - Market size and forecast 2024-2029 ($ million)
        • Chart on Russia - Year-over-year growth 2024-2029 (%)
        • Data Table on Russia - Year-over-year growth 2024-2029 (%)
      • 11.18 Market opportunity by geography
        • Market opportunity by geography ($ million)
        • Data Tables on Market opportunity by geography ($ million)

      12 Drivers, Challenges, and Opportunity/Restraints

      • 12.1 Market drivers
        • 12.2 Market challenges
          • 12.3 Impact of drivers and challenges
            • Impact of drivers and challenges in 2024 and 2029
          • 12.4 Market opportunities/restraints

            13 Competitive Landscape

            • 13.1 Overview
              • 13.2 Competitive Landscape
                • Overview on criticality of inputs and factors of differentiation
              • 13.3 Landscape disruption
                • Overview on factors of disruption
              • 13.4 Industry risks
                • Impact of key risks on business

              14 Competitive Analysis

              • 14.1 Companies profiled
                • Companies covered
              • 14.2 Company ranking index
                • Company ranking index
              • 14.3 Market positioning of companies
                • Matrix on companies position and classification
              • 14.4 BASF SE
                • BASF SE - Overview
                • BASF SE - Business segments
                • BASF SE - Key news
                • BASF SE - Key offerings
                • BASF SE - Segment focus
                • SWOT
              • 14.5 BP Plc
                • BP Plc - Overview
                • BP Plc - Business segments
                • BP Plc - Key news
                • BP Plc - Key offerings
                • BP Plc - Segment focus
                • SWOT
              • 14.6 Chevron Corp.
                • Chevron Corp. - Overview
                • Chevron Corp. - Business segments
                • Chevron Corp. - Key news
                • Chevron Corp. - Key offerings
                • Chevron Corp. - Segment focus
                • SWOT
              • 14.7 Eastman Chemical Co.
                • Eastman Chemical Co. - Overview
                • Eastman Chemical Co. - Business segments
                • Eastman Chemical Co. - Key news
                • Eastman Chemical Co. - Key offerings
                • Eastman Chemical Co. - Segment focus
                • SWOT
              • 14.8 Exxon Mobil Corp.
                • Exxon Mobil Corp. - Overview
                • Exxon Mobil Corp. - Business segments
                • Exxon Mobil Corp. - Key news
                • Exxon Mobil Corp. - Key offerings
                • Exxon Mobil Corp. - Segment focus
                • SWOT
              • 14.9 FUCHS SE
                • FUCHS SE - Overview
                • FUCHS SE - Business segments
                • FUCHS SE - Key news
                • FUCHS SE - Key offerings
                • FUCHS SE - Segment focus
                • SWOT
              • 14.10 NYCO
                • NYCO - Overview
                • NYCO - Product / Service
                • NYCO - Key offerings
                • SWOT
              • 14.11 PCC SE
                • PCC SE - Overview
                • PCC SE - Product / Service
                • PCC SE - Key offerings
                • SWOT
              • 14.12 Phillips 66 Co.
                • Phillips 66 Co. - Overview
                • Phillips 66 Co. - Business segments
                • Phillips 66 Co. - Key offerings
                • Phillips 66 Co. - Segment focus
                • SWOT
              • 14.13 PJSC LUKOIL
                • PJSC LUKOIL - Overview
                • PJSC LUKOIL - Product / Service
                • PJSC LUKOIL - Key offerings
                • SWOT
              • 14.14 Schaeffer Manufacturing Co.
                • Schaeffer Manufacturing Co. - Overview
                • Schaeffer Manufacturing Co. - Product / Service
                • Schaeffer Manufacturing Co. - Key offerings
                • SWOT
              • 14.15 Shell plc
                • Shell plc - Overview
                • Shell plc - Business segments
                • Shell plc - Key news
                • Shell plc - Key offerings
                • Shell plc - Segment focus
                • SWOT
              • 14.16 Sinopec Shanghai Petrochemical Co. Ltd.
                • Sinopec Shanghai Petrochemical Co. Ltd. - Overview
                • Sinopec Shanghai Petrochemical Co. Ltd. - Business segments
                • Sinopec Shanghai Petrochemical Co. Ltd. - Key news
                • Sinopec Shanghai Petrochemical Co. Ltd. - Key offerings
                • Sinopec Shanghai Petrochemical Co. Ltd. - Segment focus
                • SWOT
              • 14.17 TotalEnergies SE
                • TotalEnergies SE - Overview
                • TotalEnergies SE - Business segments
                • TotalEnergies SE - Key news
                • TotalEnergies SE - Key offerings
                • TotalEnergies SE - Segment focus
                • SWOT
              • 14.18 Valvoline Inc.
                • Valvoline Inc. - Overview
                • Valvoline Inc. - Product / Service
                • Valvoline Inc. - Key news
                • Valvoline Inc. - Key offerings
                • SWOT

              15 Appendix

              • 15.1 Scope of the report
                • 15.2 Inclusions and exclusions checklist
                  • Inclusions checklist
                  • Exclusions checklist
                • 15.3 Currency conversion rates for US$
                  • Currency conversion rates for US$
                • 15.4 Research methodology
                  • Research methodology
                • 15.5 Data procurement
                  • Information sources
                • 15.6 Data validation
                  • Data validation
                • 15.7 Validation techniques employed for market sizing
                  • Validation techniques employed for market sizing
                • 15.8 Data synthesis
                  • Data synthesis
                • 15.9 360 degree market analysis
                  • 360 degree market analysis
                • 15.10 List of abbreviations
                  • List of abbreviations

                Research Methodology

                Technavio presents a detailed picture of the market by way of study, synthesis, and summation of data from multiple sources. The analysts have presented the various facets of the market with a particular focus on identifying the key industry influencers. The data thus presented is comprehensive, reliable, and the result of extensive research, both primary and secondary.

                INFORMATION SOURCES

                Primary sources

                • Manufacturers and suppliers
                • Channel partners
                • Industry experts
                • Strategic decision makers

                Secondary sources

                • Industry journals and periodicals
                • Government data
                • Financial reports of key industry players
                • Historical data
                • Press releases

                DATA ANALYSIS

                Data Synthesis

                • Collation of data
                • Estimation of key figures
                • Analysis of derived insights

                Data Validation

                • Triangulation with data models
                • Reference against proprietary databases
                • Corroboration with industry experts

                REPORT WRITING

                Qualitative

                • Market drivers
                • Market challenges
                • Market trends
                • Five forces analysis

                Quantitative

                • Market size and forecast
                • Market segmentation
                • Geographical insights
                • Competitive landscape

                Interested in this report?

                Get your sample now to see our research methodology and insights!

                Download Now

                Frequently Asked Questions

                Hydraulic Fluids market growth will increase by $ 1484.4 mn during 2025-2029 .

                The Hydraulic Fluids market is expected to grow at a CAGR of 3.1% during 2025-2029 .

                Hydraulic Fluids market is segmented by Type( Mineral-base, Synthetic base, Bio-based, Oil and gas machinery, Others) Application( Construction machinery, Agricultural machinery, Mining machinery, Oil and gas machinery, Others)

                BASF SE, BP Plc, Chevron Corp., Clariant International Ltd., CONDAT, Eastman Chemical Co., Exxon Mobil Corp., FUCHS SE, NYCO, PCC SE, Petro Canada Lubricants Inc, Phillips 66 Co., PJSC LUKOIL, Schaeffer Manufacturing Co., Shell plc, Sinopec Shanghai Petrochemical Co. Ltd., The Dow Chemical Co., TotalEnergies SE, Valvoline Inc. are a few of the key vendors in the Hydraulic Fluids market.

                APAC will register the highest growth rate of 45% among the other regions. Therefore, the Hydraulic Fluids market in APAC is expected to garner significant business opportunities for the vendors during the forecast period.

                US, China, India, Germany, Japan, UK, Canada, South Korea, France, Russia

                • Rapid industrialization in emerging economiesRapid industrialization in emerging economies is a key driver for the global hydraulic fluids market. This industrial growth is characterized by significant increases in production and manufacturing activities is the driving factor this market.
                • which necessitate the use of hydraulic systems in various machinery and equipment. In China is the driving factor this market.
                • the industrial sector has seen remarkable growth is the driving factor this market.
                • with a 5.8 percent year-on-year increase in industrial production in 2024 is the driving factor this market.
                • as reported by the National Bureau of Statistics of China. This growth enhances the demand for hydraulic fluids used in industrial machinery and equipment is the driving factor this market.
                • essential for manufacturing processes. The rise in industrial activities necessitates the use of hydraulic systems for efficient operation is the driving factor this market.
                • lubrication is the driving factor this market.
                • and power transmission is the driving factor this market.
                • thereby boosting the global hydraulic fluids market. The Indian industrial sector is experiencing significant growth is the driving factor this market.
                • with the manufacturing sector leading the way. According to the Economic Survey is the driving factor this market.
                • in the fiscal year 2023 is the driving factor this market.
                • the gross value added by the manufacturing sector stood at 14.3 percent is the driving factor this market.
                • with an output share of 35.2 percent. This substantial contribution to the economy underscores the importance of hydraulic systems in manufacturing processes. Hydraulic fluids are crucial for the efficient operation of machinery used in production lines is the driving factor this market.
                • ensuring smooth and reliable performance. In South America is the driving factor this market.
                • the industrial sector of Brazil recorded an expansion of 3.2 percent in June 2024 compared to the same month in 2023 is the driving factor this market.
                • according to the Brazilian Institute of Geography and Statistics. This growth in industrial activities drives the demand for hydraulic fluids used in industrial machinery and equipment. The rise in industrial production necessitates the use of hydraulic systems for efficient operation is the driving factor this market.
                • lubrication is the driving factor this market.
                • and power transmission is the driving factor this market.
                • thereby boosting the global hydraulic fluids market. In conclusion is the driving factor this market.
                • rapid industrialization in emerging economies such as China is the driving factor this market.
                • India is the driving factor this market.
                • and Brazil significantly drive the demand for hydraulic fluids. The growth in industrial activities and manufacturing processes necessitates the use of hydraulic systems is the driving factor this market.
                • ensuring efficient operation and maintenance of machinery. This trend underscores the importance of hydraulic fluids in supporting industrial growth and development in these regions. is the driving factor this market.

                The Hydraulic Fluids market vendors should focus on grabbing business opportunities from the Mineral-base segment as it accounted for the largest market share in the base year.