Infrastructure Asset Intelligence Market Analysis, Size, and Forecast 2026-2030: North America (US, Canada, and Mexico), APAC (China, Japan, and India), Europe (Germany, UK, and France), Middle East and Africa (Saudi Arabia, UAE, and South Africa), South America (Brazil, Argentina, and Colombia), and Rest of World (ROW)

Infrastructure Asset Intelligence Market Analysis, Size, and Forecast 2026-2030:
North America (US, Canada, and Mexico), APAC (China, Japan, and India), Europe (Germany, UK, and France), Middle East and Africa (Saudi Arabia, UAE, and South Africa), South America (Brazil, Argentina, and Colombia), and Rest of World (ROW)

Published: May 2026 315 Pages SKU: IRTNTR81502

Market Overview at a Glance

$5.11 B
Market Opportunity
15.5%
CAGR 2025 - 2030
32.9%
North America Growth
$2.40 B
Software segment 2024

Infrastructure Asset Intelligence Market Size 2026-2030

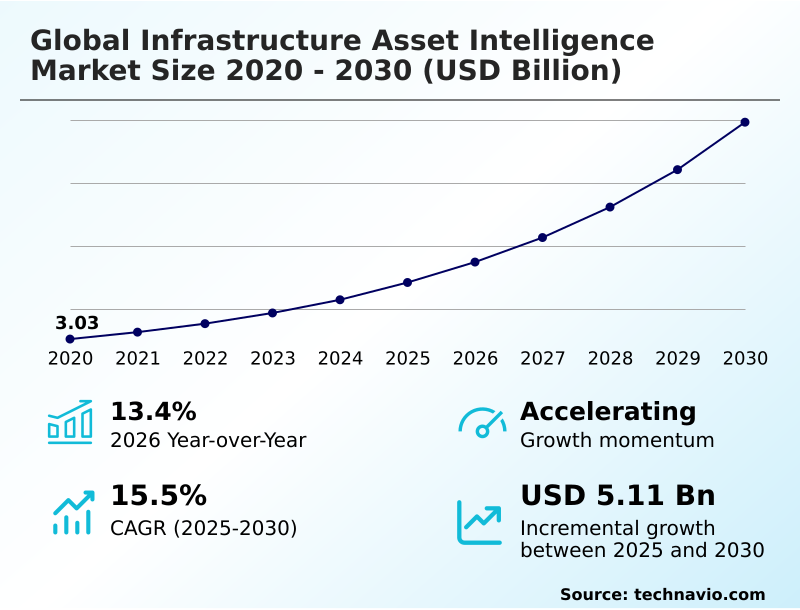
The infrastructure asset intelligence market size is valued to increase by USD 5.11 billion, at a CAGR of 15.5% from 2025 to 2030. Increasing demand for predictive maintenance and lifecycle optimization will drive the infrastructure asset intelligence market.

Major Market Trends & Insights

  • North America dominated the market and accounted for a 32.9% growth during the forecast period.
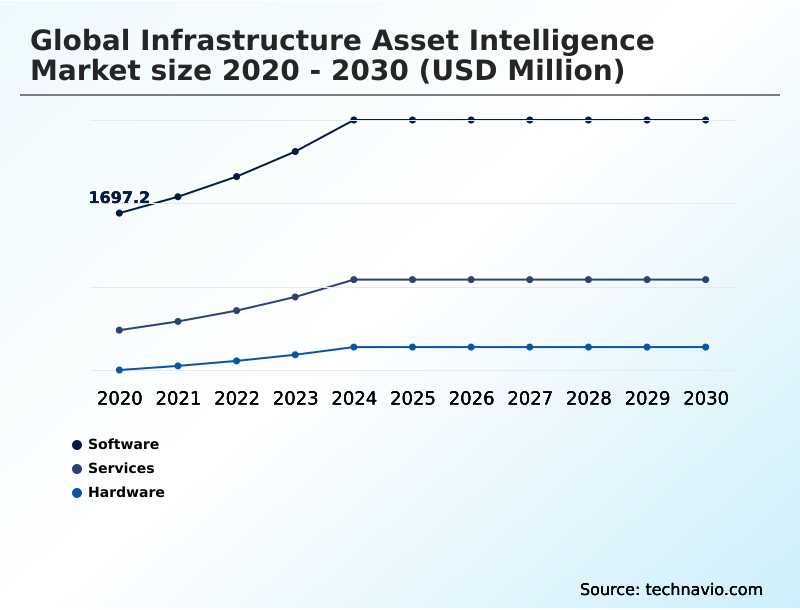
  • By Component - Software segment was valued at USD 2.40 billion in 2024
  • By Type - Transportation infrastructure segment accounted for the largest market revenue share in 2024

Market Size & Forecast

  • Market Opportunities: USD 6.90 billion
  • Market Future Opportunities: USD 5.11 billion
  • CAGR from 2025 to 2030 : 15.5%

Market Summary

  • The Infrastructure Asset Intelligence Market is fundamentally reshaping how municipalities and private enterprises oversee physical structures, pivoting operations from reactive repairs to predictive preservation. By deploying advanced predictive maintenance algorithms, facility managers continuously capture vital structural data.
  • In the energy sector, operators use these systems to monitor critical networks, instantly detecting pressure anomalies to prevent catastrophic environmental leaks and optimizing overall supply chain reliability. This proactive capability yields profound business impact; facilities utilizing intelligent monitoring have demonstrated a 25% increase in operational downtime reduction compared to those relying on traditional maintenance schedules.
  • A primary driver of this transition is the stringent regulatory demand for environmental compliance, which forces operators to maintain immutable digital safety logs. Conversely, the sector faces substantial challenges regarding cybersecurity vulnerabilities, as expanding connected networks inadvertently widens the attack surface for malicious actors. Addressing these vulnerabilities ensures secure data transmission, making resilient data architecture essential for sustained efficiency.

What will be the Size of the Infrastructure Asset Intelligence Market during the forecast period?

Get Key Insights on Market Forecast (PDF) Get Free Sample

How is the Infrastructure Asset Intelligence Market Segmented?

The infrastructure asset intelligence industry research report provides comprehensive data (region-wise segment analysis), with forecasts and estimates in "USD million" for the period 2026-2030, as well as historical data from 2020-2024 for the following segments.

  • Component
    • Software
    • Services
    • Hardware
  • Type
    • Transportation infrastructure
    • Energy infrastructure
    • Water and wastewater infrastructure
    • Smart‑city and urban infrastructure
    • Industrial and critical‑infrastructure
  • Application
    • Asset performance management
    • Predictive maintenance
    • Condition monitoring
  • Geography
    • North America
      • US
      • Canada
      • Mexico
    • APAC
      • China
      • Japan
      • India
      • South Korea
      • Australia
      • Indonesia
    • Europe
      • Germany
      • UK
      • France
      • Italy
      • Spain
      • The Netherlands
    • Middle East and Africa
      • Saudi Arabia
      • UAE
      • South Africa
      • Turkey
      • Israel
    • South America
      • Brazil
      • Argentina
      • Colombia

By Component Insights

The software segment is estimated to witness significant growth during the forecast period.

The software component functions as the primary analytical engine within the Infrastructure Asset Intelligence domain, translating raw operational inputs into strategic business value.

By integrating predictive maintenance algorithms and structural health monitoring sensors, organizations shift from reactive fixes to proactive maintenance frameworks. This evolution is continuously driven by the deployment of connected sensor ecosystems, which capture real time environmental metrics.

Consequently, operators leverage digital twin modeling to create virtual asset replicas, enabling highly accurate network evaluations without risking physical disruption.

By applying vibration anomaly detection, operators identify micro-failures early, resulting in a 15% improvement in fault detection compared to legacy manual inspections. This targeted digital strategy directly reduces costly operational disruptions and secures vital public works.

Get Free Sample

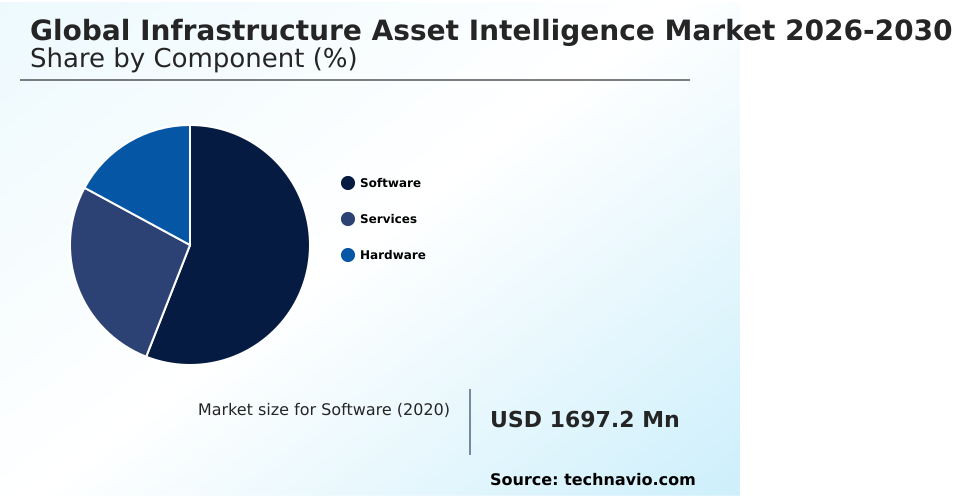
The Software segment was valued at USD 2.40 billion in 2024 and showed a gradual increase during the forecast period.

Get Free Sample

Regional Analysis

North America is estimated to contribute 32.9% to the growth of the global market during the forecast period.Technavio’s analysts have elaborately explained the regional trends and drivers that shape the market during the forecast period.

See How Infrastructure Asset Intelligence Market Demand is Rising in North America Get Free Sample

The geographic landscape of the Infrastructure Asset Intelligence sector reveals distinct strategic priorities across major regions.

North America leads the rapid modernization of aging public works by deploying advanced edge computing processors and internet of things gateways to secure critical utility grids.

This aggressive digital overhaul has generated a 20% higher rate of lifecycle extension compared to developing markets.

Conversely, European operators focus heavily on regulatory safety, utilizing cyber threat mitigation protocols and localized edge analytics to align with stringent environmental directives, lowering waste processing costs by 18%.

Because Asian municipalities grapple with hyper-dense urbanization, they prioritize spatial analytics integration and infrastructure network simulation to ensure transit stability.

By incorporating autonomous drone inspection for automated visual data capture, these industrializing nations optimize massive construction budgets, resulting in a 12% improvement in project efficiency.

Market Dynamics

Our researchers analyzed the data with 2025 as the base year, along with the key drivers, trends, and challenges. A holistic analysis of drivers will help companies refine their marketing strategies to gain a competitive advantage.

  • The progressive digitization of heavy physical networks completely redefines operational strategies for municipal planners and industrial operators. Modern administrators rapidly transition away from manual inspection protocols, increasingly favoring the deployment of real time structural health monitoring systems. This technological shift provides unprecedented visibility into subtle material degradation, allowing engineering teams to identify mechanical vulnerabilities without disrupting critical public services.
  • By utilizing ai driven predictive maintenance algorithms, organizations achieve superior equipment longevity, recording maintenance intervals that are roughly 20% more efficient than those adhering to static, calendar-based schedules. Furthermore, digital twin integration for portfolio management allows civic leaders to test urban expansion scenarios within a purely virtual environment, drastically lowering the financial risks associated with physical construction.
  • When overseeing highly isolated energy grids or offshore platforms, the implementation of edge computing in remote structural diagnostics ensures instantaneous data processing without relying on intermittent centralized cloud connections. This decentralized approach enhances supply chain resilience by triggering automatic safety shutoffs the moment anomalies are detected.
  • Ultimately, the adoption of automated continuous infrastructure lifecycle optimization empowers stakeholders to allocate capital budgets with exceptional precision. By continuously analyzing environmental stressors and operational loads, decision makers proactively safeguard vital public works, ensuring sustainable economic expansion and robust structural integrity across diverse regional topographies.

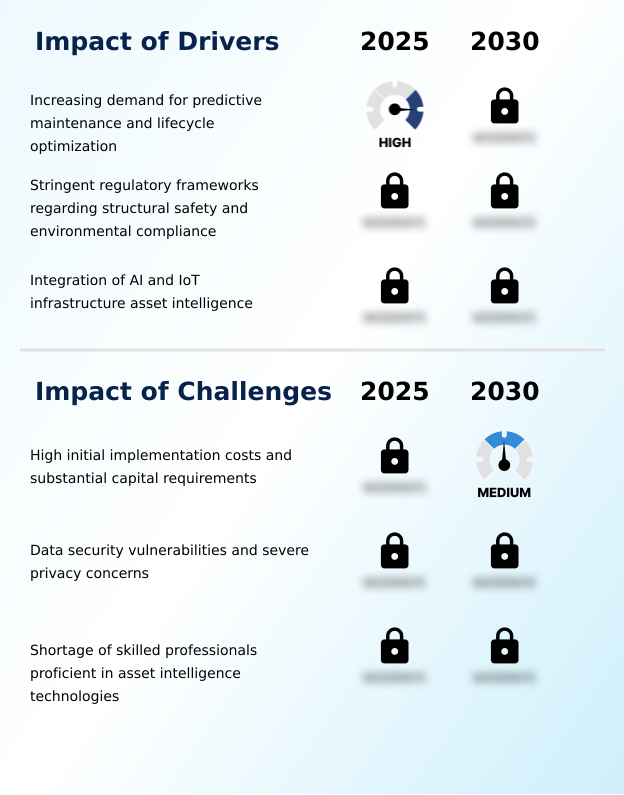
What are the key market drivers leading to the rise in the adoption of Infrastructure Asset Intelligence Industry?

  • The escalating demand for predictive maintenance and infrastructure lifecycle optimization serves as the primary catalyst propelling continuous structural monitoring adoption.

  • The urgent necessity to preemptively address structural vulnerabilities heavily propels the expansion of continuous monitoring technologies. By integrating decentralized data architectures and machine learning pattern recognition, organizations completely eliminate the reliance on subjective visual assessments.
  • This proactive transition enhances subterranean utility visualization and secures extreme weather resilience, drastically cutting catastrophic failure events. Consequently, operators utilizing advanced asset performance optimization experience a 25% reduction in emergency repair expenses and a 12% decrease in overall operational downtime.
  • Because seismic activity assessment ensures immediate anomaly detection, maintenance teams deploy resources only when empirically necessary.
  • This targeted efficiency improves capital allocation modeling and supports the generation of circular economy material passports, providing an unassailable financial incentive for widespread digital adoption across the global supply chain.

What are the market trends shaping the Infrastructure Asset Intelligence Industry?

  • The transition toward digital twins facilitates holistic portfolio management across structural networks.

  • The rapid proliferation of holistic virtual models marks a profound transformation in how organizations manage physical networks. By leveraging cloud computing infrastructure, operators seamlessly integrate modern digital capabilities into aging frameworks, establishing cohesive environments for heavy machinery diagnostics and water distribution optimization. This strategic modernization enables continuous thermal imaging diagnostics for vast geographic spans, reducing manual field inspections by 30%.
  • Because utility providers actively deploy acoustic emission sensors and conduct pipeline integrity verification, they successfully mitigate resource waste, lowering unnecessary energy consumption by an impressive 15%. This convergence of dynamic modeling and structural strain measurement ensures that metropolitan administrators optimize ongoing capital expenditures, driving an 18% improvement in preventative maintenance accuracy.
  • By prioritizing operational downtime reduction, operators significantly minimize physical risk and enhance overall structural resilience.

What challenges does the Infrastructure Asset Intelligence Industry face during its growth?

  • Substantial capital requirements and high initial implementation costs present formidable barriers to the widespread integration of advanced structural monitoring networks.

  • Severe cybersecurity vulnerabilities and complex integration hurdles significantly impede the universal deployment of sophisticated structural monitoring networks. As municipalities scale smart grid load balancing and intelligent traffic management systems, they inadvertently widen the digital attack surface available to malicious entities. Failing to secure continuous operational telemetry can result in debilitating service outages, causing a 20% drop in overall civic efficiency.
  • Furthermore, accurately translating raw sensor data into actionable insights for automated leakage detection requires specialized engineering expertise, which remains in critically short supply. This workforce deficit restricts legacy system retrofitting and complex automated waste routing integrations, frequently inflating operational budgets by up to 15%.
  • Overcoming these technical barriers remains absolutely essential for organizations attempting to execute systematic deconstruction tracking and robotic assembly inspection safely.

Exclusive Technavio Analysis on Customer Landscape

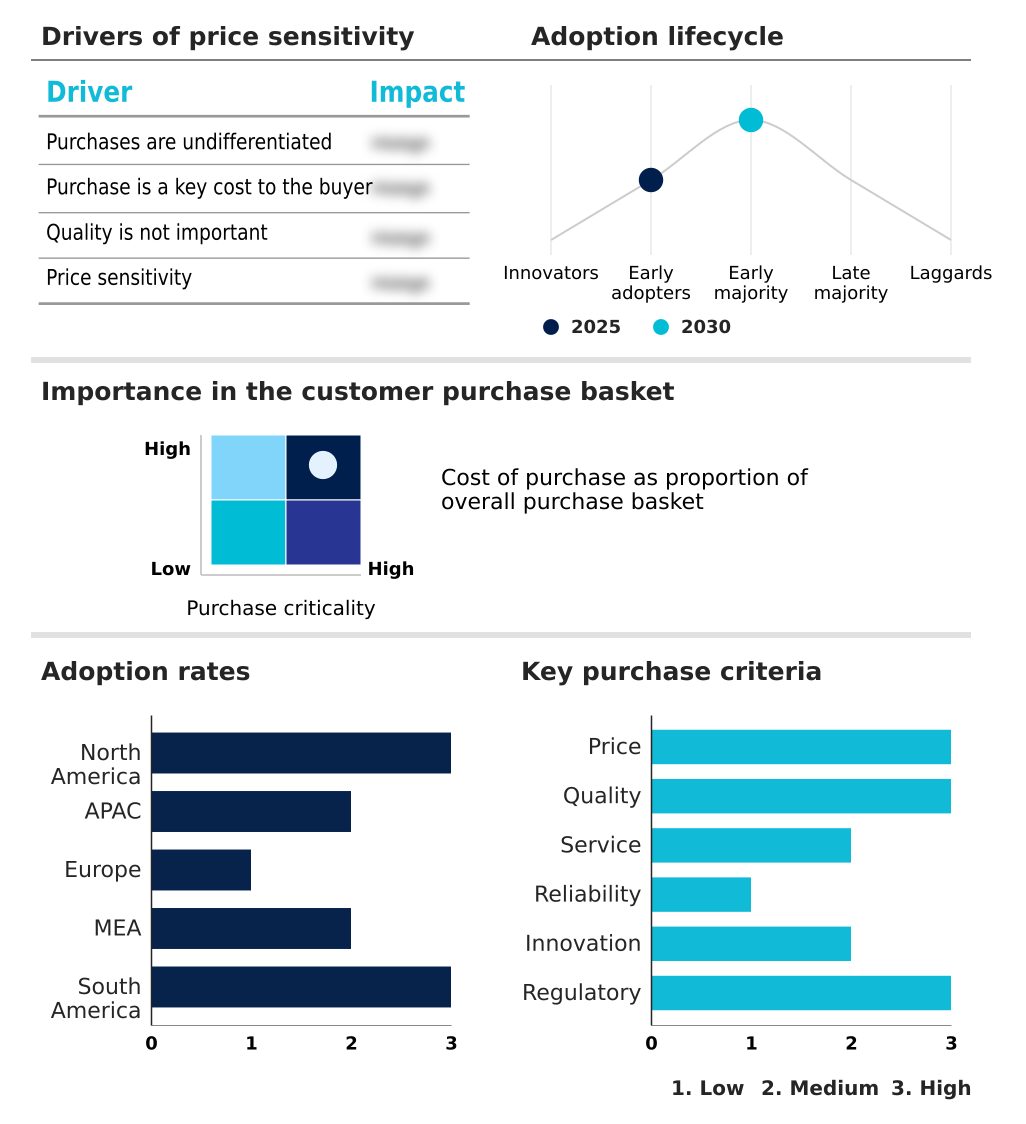
The infrastructure asset intelligence market forecasting report includes the adoption lifecycle of the market, covering from the innovator’s stage to the laggard’s stage. It focuses on adoption rates in different regions based on penetration. Furthermore, the infrastructure asset intelligence market report also includes key purchase criteria and drivers of price sensitivity to help companies evaluate and develop their market growth analysis strategies.

Customer Landscape of Infrastructure Asset Intelligence Industry

Competitive Landscape

Companies are implementing various strategies, such as strategic alliances, infrastructure asset intelligence market forecast, partnerships, mergers and acquisitions, geographical expansion, and product/service launches, to enhance their presence in the industry.

ABB Ltd. - The company delivers comprehensive asset performance platforms integrating connected sensors to significantly enhance the reliability and automation of industrial and energy grids.

The industry research and growth report includes detailed analyses of the competitive landscape of the market and information about key companies, including:

  • ABB Ltd.
  • Autodesk Inc.
  • AVEVA Group Ltd.
  • Bentley Systems Inc.
  • Cisco Systems Inc.
  • DroneDeploy Inc.
  • Esri Inc.
  • Fugro NV
  • GE Vernova Inc.
  • Hexagon AB
  • Hitachi Vantara LLC
  • IBM Corp.
  • Oracle Corp.
  • Palantir Technologies Inc.
  • Samsara Inc.
  • SAP SE
  • Schneider Electric SE
  • Siemens AG
  • Skydio Inc.
  • Trimble Inc.

Qualitative and quantitative analysis of companies has been conducted to help clients understand the wider business environment as well as the strengths and weaknesses of key industry players. Data is qualitatively analyzed to categorize companies as pure play, category-focused, industry-focused, and diversified; it is quantitatively analyzed to categorize companies as dominant, leading, strong, tentative, and weak.

Recent Development and News in Infrastructure asset intelligence market

  • In the Application Software industry, the transition toward decentralized database management accelerated the deployment of localized edge analytics, directly impacting Infrastructure Asset Intelligence demand by enhancing heavy machinery diagnostics in remote manufacturing environments.
  • Stringent data privacy mandates such as GDPR forced enterprise developers to embed advanced cyber threat mitigation protocols, driving the adoption of secure monitoring networks for public utility oversight.
  • The advancement of interconnected workflow standards accelerated the development of automated visual data capture, reducing the reliance on manual assessments during complex pipeline integrity verification processes.
  • The widespread adoption of interoperable supply chain software allowed seamless legacy system retrofitting, enhancing the deployment of platforms engineered specifically for water distribution optimization.

Dive into Technavio’s robust research methodology, blending expert interviews, extensive data synthesis, and validated models for unparalleled Infrastructure Asset Intelligence Market insights. See full methodology.

Market Scope
Page number 315
Base year 2025
Historic period 2020-2024
Forecast period 2026-2030
Growth momentum & CAGR Accelerate at a CAGR of 15.5%
Market growth 2026-2030 USD 5106.9 million
Market structure Fragmented
YoY growth 2025-2026(%) 13.4%
Key countries US, Canada, Mexico, China, Japan, India, South Korea, Australia, Indonesia, Germany, UK, France, Italy, Spain, The Netherlands, Saudi Arabia, UAE, South Africa, Turkey, Israel, Brazil, Argentina and Colombia
Competitive landscape Leading Companies, Market Positioning of Companies, Competitive Strategies, and Industry Risks

Request Free Sample

Research Analyst Overview

  • Corporate executives increasingly view structural intelligence not merely as a maintenance function, but as a foundational element of strategic boardroom planning. The expansive deployment of continuous telemetry provides leadership with empirical data necessary to guide long-term capital investments and ensure strict regulatory compliance.
  • By harnessing sophisticated digital twin modeling and decentralized data protocols, organizations proactively map vulnerabilities across their physical portfolios. This transition empowers operators to execute infrastructure evaluations with unparalleled accuracy, directly preventing catastrophic urban excavations. Consequently, firms leveraging internet of things gateways achieve a 25% decrease in unexpected operational downtime compared to organizations relying on traditional manual oversight.
  • The integration of automated inspections within heavy industrial facilities further streamlines supply chain continuity, minimizing human exposure to hazardous environments. Ultimately, scaling robust computing infrastructure drives holistic asset performance optimization, allowing financial officers to redirect emergency repair budgets toward sustainable expansion. This data-driven precision firmly establishes intelligent monitoring as a core determinant of enterprise resilience.

What are the Key Data Covered in this Infrastructure Asset Intelligence Market Research and Growth Report?

  • What is the expected growth of the Infrastructure Asset Intelligence Market between 2026 and 2030?

    • USD 5.11 billion, at a CAGR of 15.5%

  • What segmentation does the market report cover?

    • The report is segmented by Component (Software, Services, and Hardware), Type (Transportation infrastructure, Energy infrastructure, Water and wastewater infrastructure, Smart‑city and urban infrastructure, and Industrial and critical‑infrastructure), Application (Asset performance management, Predictive maintenance, and Condition monitoring) and Geography (North America, APAC, Europe, Middle East and Africa, South America)

  • Which regions are analyzed in the report?

    • North America, APAC, Europe, Middle East and Africa and South America

  • What are the key growth drivers and market challenges?

    • Increasing demand for predictive maintenance and lifecycle optimization, High initial implementation costs and substantial capital requirements

  • Who are the major players in the Infrastructure Asset Intelligence Market?

    • ABB Ltd., Autodesk Inc., AVEVA Group Ltd., Bentley Systems Inc., Cisco Systems Inc., DroneDeploy Inc., Esri Inc., Fugro NV, GE Vernova Inc., Hexagon AB, Hitachi Vantara LLC, IBM Corp., Oracle Corp., Palantir Technologies Inc., Samsara Inc., SAP SE, Schneider Electric SE, Siemens AG, Skydio Inc. and Trimble Inc.

Market Research Insights

  • The modern Infrastructure Asset Intelligence landscape increasingly relies on connected technology to secure essential physical frameworks. Through rigorous proactive maintenance frameworks and real time environmental metrics, organizations identify subtle material fatigue long before physical failures manifest.
  • Implementing these intelligent connected sensor ecosystems drives substantial business value; companies achieve a 30% reduction in emergency repair expenses and improve operational uptime by 22%. Furthermore, municipalities prioritize the creation of virtual asset replicas to simulate urban expansion, driving a 15% increase in project efficiency compared to outdated civic systems.
  • By integrating advanced analytics, administrators continuously adapt to environmental pressures while significantly minimizing unnecessary maintenance expenditures and fortifying public safety mandates.

We can help! Our analysts can customize this infrastructure asset intelligence market research report to meet your requirements.

Get in touch

1. Executive Summary

1.1 Market overview

Executive Summary - Chart on Market Overview
Executive Summary - Data Table on Market Overview
Executive Summary - Chart on Global Market Characteristics
Executive Summary - Chart on Market by Geography
Executive Summary - Chart on Market Segmentation by Component
Executive Summary - Chart on Market Segmentation by Type
Executive Summary - Chart on Market Segmentation by Application
Executive Summary - Chart on Incremental Growth
Executive Summary - Data Table on Incremental Growth
Executive Summary - Chart on Company Market Positioning

2. Technavio Analysis

2.1 Analysis of price sensitivity, lifecycle, customer purchase basket, adoption rates, and purchase criteria

2.2 Criticality of inputs and Factors of differentiation

Chart on Overview on criticality of inputs and factors of differentiation

2.3 Factors of disruption

Chart on Overview on factors of disruption

2.4 Impact of drivers and challenges

Chart on Impact of drivers and challenges in 2025 and 2030

3. Market Landscape

3.1 Market ecosystem

Chart on Parent Market
Data Table on - Parent Market

3.2 Market characteristics

Chart on Market characteristics analysis

3.3 Value chain analysis

Chart on Value chain analysis

4. Market Sizing

4.1 Market definition

Data Table on Offerings of companies included in the market definition

4.2 Market segment analysis

Market segments

4.3 Market size 2025

4.4 Market outlook: Forecast for 2025-2030

Chart on Global - Market size and forecast 2025-2030 ($ million)
Data Table on Global - Market size and forecast 2025-2030 ($ million)
Chart on Global Market: Year-over-year growth 2025-2030 (%)
Data Table on Global Market: Year-over-year growth 2025-2030 (%)

5. Historic Market Size

5.1 Global Infrastructure Asset Intelligence Market 2020 - 2024

Historic Market Size - Data Table on Global Infrastructure Asset Intelligence Market 2020 - 2024 ($ million)

5.2 Component segment analysis 2020 - 2024

Historic Market Size - Component Segment 2020 - 2024 ($ million)

5.3 Type segment analysis 2020 - 2024

Historic Market Size - Type Segment 2020 - 2024 ($ million)

5.4 Application segment analysis 2020 - 2024

Historic Market Size - Application Segment 2020 - 2024 ($ million)

5.5 Geography segment analysis 2020 - 2024

Historic Market Size - Geography Segment 2020 - 2024 ($ million)

5.6 Country segment analysis 2020 - 2024

Historic Market Size - Country Segment 2020 - 2024 ($ million)

6. Qualitative Analysis

6.1 Impact of AI on Global Infrastructure Asset Intelligence Market

6.2 Impact of Geopolitical Conflicts on Global Infrastructure Asset Intelligence Market

7. Five Forces Analysis

7.1 Five forces summary

Five forces analysis - Comparison between 2025 and 2030

7.2 Bargaining power of buyers

Bargaining power of buyers - Impact of key factors 2025 and 2030

7.3 Bargaining power of suppliers

Bargaining power of suppliers - Impact of key factors in 2025 and 2030

7.4 Threat of new entrants

Threat of new entrants - Impact of key factors in 2025 and 2030

7.5 Threat of substitutes

Threat of substitutes - Impact of key factors in 2025 and 2030

7.6 Threat of rivalry

Threat of rivalry - Impact of key factors in 2025 and 2030

7.7 Market condition

Chart on Market condition - Five forces 2025 and 2030

8. Market Segmentation by Component

8.1 Market segments

Chart on Component - Market share 2025-2030 (%)
Data Table on Component - Market share 2025-2030 (%)

8.2 Comparison by Component

Chart on Comparison by Component
Data Table on Comparison by Component

8.3 Software - Market size and forecast 2025-2030

Chart on Software - Market size and forecast 2025-2030 ($ million)
Data Table on Software - Market size and forecast 2025-2030 ($ million)
Chart on Software - Year-over-year growth 2025-2030 (%)
Data Table on Software - Year-over-year growth 2025-2030 (%)

8.4 Services - Market size and forecast 2025-2030

Chart on Services - Market size and forecast 2025-2030 ($ million)
Data Table on Services - Market size and forecast 2025-2030 ($ million)
Chart on Services - Year-over-year growth 2025-2030 (%)
Data Table on Services - Year-over-year growth 2025-2030 (%)

8.5 Hardware - Market size and forecast 2025-2030

Chart on Hardware - Market size and forecast 2025-2030 ($ million)
Data Table on Hardware - Market size and forecast 2025-2030 ($ million)
Chart on Hardware - Year-over-year growth 2025-2030 (%)
Data Table on Hardware - Year-over-year growth 2025-2030 (%)

8.6 Market opportunity by Component

Market opportunity by Component ($ million)
Data Table on Market opportunity by Component ($ million)

9. Market Segmentation by Type

9.1 Market segments

Chart on Type - Market share 2025-2030 (%)
Data Table on Type - Market share 2025-2030 (%)

9.2 Comparison by Type

Chart on Comparison by Type
Data Table on Comparison by Type

9.3 Transportation infrastructure - Market size and forecast 2025-2030

Chart on Transportation infrastructure - Market size and forecast 2025-2030 ($ million)
Data Table on Transportation infrastructure - Market size and forecast 2025-2030 ($ million)
Chart on Transportation infrastructure - Year-over-year growth 2025-2030 (%)
Data Table on Transportation infrastructure - Year-over-year growth 2025-2030 (%)

9.4 Energy infrastructure - Market size and forecast 2025-2030

Chart on Energy infrastructure - Market size and forecast 2025-2030 ($ million)
Data Table on Energy infrastructure - Market size and forecast 2025-2030 ($ million)
Chart on Energy infrastructure - Year-over-year growth 2025-2030 (%)
Data Table on Energy infrastructure - Year-over-year growth 2025-2030 (%)

9.5 Water and wastewater infrastructure - Market size and forecast 2025-2030

Chart on Water and wastewater infrastructure - Market size and forecast 2025-2030 ($ million)
Data Table on Water and wastewater infrastructure - Market size and forecast 2025-2030 ($ million)
Chart on Water and wastewater infrastructure - Year-over-year growth 2025-2030 (%)
Data Table on Water and wastewater infrastructure - Year-over-year growth 2025-2030 (%)

9.6 Smart‑city and urban infrastructure - Market size and forecast 2025-2030

Chart on Smart‑city and urban infrastructure - Market size and forecast 2025-2030 ($ million)
Data Table on Smart‑city and urban infrastructure - Market size and forecast 2025-2030 ($ million)
Chart on Smart‑city and urban infrastructure - Year-over-year growth 2025-2030 (%)
Data Table on Smart‑city and urban infrastructure - Year-over-year growth 2025-2030 (%)

9.7 Industrial and critical‑infrastructure - Market size and forecast 2025-2030

Chart on Industrial and critical‑infrastructure - Market size and forecast 2025-2030 ($ million)
Data Table on Industrial and critical‑infrastructure - Market size and forecast 2025-2030 ($ million)
Chart on Industrial and critical‑infrastructure - Year-over-year growth 2025-2030 (%)
Data Table on Industrial and critical‑infrastructure - Year-over-year growth 2025-2030 (%)

9.8 Market opportunity by Type

Market opportunity by Type ($ million)
Data Table on Market opportunity by Type ($ million)

10. Market Segmentation by Application

10.1 Market segments

Chart on Application - Market share 2025-2030 (%)
Data Table on Application - Market share 2025-2030 (%)

10.2 Comparison by Application

Chart on Comparison by Application
Data Table on Comparison by Application

10.3 Asset performance management - Market size and forecast 2025-2030

Chart on Asset performance management - Market size and forecast 2025-2030 ($ million)
Data Table on Asset performance management - Market size and forecast 2025-2030 ($ million)
Chart on Asset performance management - Year-over-year growth 2025-2030 (%)
Data Table on Asset performance management - Year-over-year growth 2025-2030 (%)

10.4 Predictive maintenance - Market size and forecast 2025-2030

Chart on Predictive maintenance - Market size and forecast 2025-2030 ($ million)
Data Table on Predictive maintenance - Market size and forecast 2025-2030 ($ million)
Chart on Predictive maintenance - Year-over-year growth 2025-2030 (%)
Data Table on Predictive maintenance - Year-over-year growth 2025-2030 (%)

10.5 Condition monitoring - Market size and forecast 2025-2030

Chart on Condition monitoring - Market size and forecast 2025-2030 ($ million)
Data Table on Condition monitoring - Market size and forecast 2025-2030 ($ million)
Chart on Condition monitoring - Year-over-year growth 2025-2030 (%)
Data Table on Condition monitoring - Year-over-year growth 2025-2030 (%)

10.6 Market opportunity by Application

Market opportunity by Application ($ million)
Data Table on Market opportunity by Application ($ million)

11. Customer Landscape

11.1 Customer landscape overview

Analysis of price sensitivity, lifecycle, customer purchase basket, adoption rates, and purchase criteria

12. Geographic Landscape

12.1 Geographic segmentation

Chart on Market share by geography 2025-2030 (%)
Data Table on Market share by geography 2025-2030 (%)

12.2 Geographic comparison

Chart on Geographic comparison
Data Table on Geographic comparison

12.3 North America - Market size and forecast 2025-2030

Chart on North America - Market size and forecast 2025-2030 ($ million)
Data Table on North America - Market size and forecast 2025-2030 ($ million)
Chart on North America - Year-over-year growth 2025-2030 (%)
Data Table on North America - Year-over-year growth 2025-2030 (%)
Chart on Regional Comparison - North America
Data Table on Regional Comparison - North America

12.3.1 US - Market size and forecast 2025-2030

Chart on US - Market size and forecast 2025-2030 ($ million)
Data Table on US - Market size and forecast 2025-2030 ($ million)
Chart on US - Year-over-year growth 2025-2030 (%)
Data Table on US - Year-over-year growth 2025-2030 (%)

12.3.2 Canada - Market size and forecast 2025-2030

Chart on Canada - Market size and forecast 2025-2030 ($ million)
Data Table on Canada - Market size and forecast 2025-2030 ($ million)
Chart on Canada - Year-over-year growth 2025-2030 (%)
Data Table on Canada - Year-over-year growth 2025-2030 (%)

12.3.3 Mexico - Market size and forecast 2025-2030

Chart on Mexico - Market size and forecast 2025-2030 ($ million)
Data Table on Mexico - Market size and forecast 2025-2030 ($ million)
Chart on Mexico - Year-over-year growth 2025-2030 (%)
Data Table on Mexico - Year-over-year growth 2025-2030 (%)

12.4 APAC - Market size and forecast 2025-2030

Chart on APAC - Market size and forecast 2025-2030 ($ million)
Data Table on APAC - Market size and forecast 2025-2030 ($ million)
Chart on APAC - Year-over-year growth 2025-2030 (%)
Data Table on APAC - Year-over-year growth 2025-2030 (%)
Chart on Regional Comparison - APAC
Data Table on Regional Comparison - APAC

12.4.1 China - Market size and forecast 2025-2030

Chart on China - Market size and forecast 2025-2030 ($ million)
Data Table on China - Market size and forecast 2025-2030 ($ million)
Chart on China - Year-over-year growth 2025-2030 (%)
Data Table on China - Year-over-year growth 2025-2030 (%)

12.4.2 Japan - Market size and forecast 2025-2030

Chart on Japan - Market size and forecast 2025-2030 ($ million)
Data Table on Japan - Market size and forecast 2025-2030 ($ million)
Chart on Japan - Year-over-year growth 2025-2030 (%)
Data Table on Japan - Year-over-year growth 2025-2030 (%)

12.4.3 India - Market size and forecast 2025-2030

Chart on India - Market size and forecast 2025-2030 ($ million)
Data Table on India - Market size and forecast 2025-2030 ($ million)
Chart on India - Year-over-year growth 2025-2030 (%)
Data Table on India - Year-over-year growth 2025-2030 (%)

12.4.4 South Korea - Market size and forecast 2025-2030

Chart on South Korea - Market size and forecast 2025-2030 ($ million)
Data Table on South Korea - Market size and forecast 2025-2030 ($ million)
Chart on South Korea - Year-over-year growth 2025-2030 (%)
Data Table on South Korea - Year-over-year growth 2025-2030 (%)

12.4.5 Australia - Market size and forecast 2025-2030

Chart on Australia - Market size and forecast 2025-2030 ($ million)
Data Table on Australia - Market size and forecast 2025-2030 ($ million)
Chart on Australia - Year-over-year growth 2025-2030 (%)
Data Table on Australia - Year-over-year growth 2025-2030 (%)

12.4.6 Indonesia - Market size and forecast 2025-2030

Chart on Indonesia - Market size and forecast 2025-2030 ($ million)
Data Table on Indonesia - Market size and forecast 2025-2030 ($ million)
Chart on Indonesia - Year-over-year growth 2025-2030 (%)
Data Table on Indonesia - Year-over-year growth 2025-2030 (%)

12.5 Europe - Market size and forecast 2025-2030

Chart on Europe - Market size and forecast 2025-2030 ($ million)
Data Table on Europe - Market size and forecast 2025-2030 ($ million)
Chart on Europe - Year-over-year growth 2025-2030 (%)
Data Table on Europe - Year-over-year growth 2025-2030 (%)
Chart on Regional Comparison - Europe
Data Table on Regional Comparison - Europe

12.5.1 Germany - Market size and forecast 2025-2030

Chart on Germany - Market size and forecast 2025-2030 ($ million)
Data Table on Germany - Market size and forecast 2025-2030 ($ million)
Chart on Germany - Year-over-year growth 2025-2030 (%)
Data Table on Germany - Year-over-year growth 2025-2030 (%)

12.5.2 UK - Market size and forecast 2025-2030

Chart on UK - Market size and forecast 2025-2030 ($ million)
Data Table on UK - Market size and forecast 2025-2030 ($ million)
Chart on UK - Year-over-year growth 2025-2030 (%)
Data Table on UK - Year-over-year growth 2025-2030 (%)

12.5.3 France - Market size and forecast 2025-2030

Chart on France - Market size and forecast 2025-2030 ($ million)
Data Table on France - Market size and forecast 2025-2030 ($ million)
Chart on France - Year-over-year growth 2025-2030 (%)
Data Table on France - Year-over-year growth 2025-2030 (%)

12.5.4 Italy - Market size and forecast 2025-2030

Chart on Italy - Market size and forecast 2025-2030 ($ million)
Data Table on Italy - Market size and forecast 2025-2030 ($ million)
Chart on Italy - Year-over-year growth 2025-2030 (%)
Data Table on Italy - Year-over-year growth 2025-2030 (%)

12.5.5 Spain - Market size and forecast 2025-2030

Chart on Spain - Market size and forecast 2025-2030 ($ million)
Data Table on Spain - Market size and forecast 2025-2030 ($ million)
Chart on Spain - Year-over-year growth 2025-2030 (%)
Data Table on Spain - Year-over-year growth 2025-2030 (%)

12.5.6 The Netherlands - Market size and forecast 2025-2030

Chart on The Netherlands - Market size and forecast 2025-2030 ($ million)
Data Table on The Netherlands - Market size and forecast 2025-2030 ($ million)
Chart on The Netherlands - Year-over-year growth 2025-2030 (%)
Data Table on The Netherlands - Year-over-year growth 2025-2030 (%)

12.6 Middle East and Africa - Market size and forecast 2025-2030

Chart on Middle East and Africa - Market size and forecast 2025-2030 ($ million)
Data Table on Middle East and Africa - Market size and forecast 2025-2030 ($ million)
Chart on Middle East and Africa - Year-over-year growth 2025-2030 (%)
Data Table on Middle East and Africa - Year-over-year growth 2025-2030 (%)
Chart on Regional Comparison - Middle East and Africa
Data Table on Regional Comparison - Middle East and Africa

12.6.1 Saudi Arabia - Market size and forecast 2025-2030

Chart on Saudi Arabia - Market size and forecast 2025-2030 ($ million)
Data Table on Saudi Arabia - Market size and forecast 2025-2030 ($ million)
Chart on Saudi Arabia - Year-over-year growth 2025-2030 (%)
Data Table on Saudi Arabia - Year-over-year growth 2025-2030 (%)

12.6.2 UAE - Market size and forecast 2025-2030

Chart on UAE - Market size and forecast 2025-2030 ($ million)
Data Table on UAE - Market size and forecast 2025-2030 ($ million)
Chart on UAE - Year-over-year growth 2025-2030 (%)
Data Table on UAE - Year-over-year growth 2025-2030 (%)

12.6.3 South Africa - Market size and forecast 2025-2030

Chart on South Africa - Market size and forecast 2025-2030 ($ million)
Data Table on South Africa - Market size and forecast 2025-2030 ($ million)
Chart on South Africa - Year-over-year growth 2025-2030 (%)
Data Table on South Africa - Year-over-year growth 2025-2030 (%)

12.6.4 Turkey - Market size and forecast 2025-2030

Chart on Turkey - Market size and forecast 2025-2030 ($ million)
Data Table on Turkey - Market size and forecast 2025-2030 ($ million)
Chart on Turkey - Year-over-year growth 2025-2030 (%)
Data Table on Turkey - Year-over-year growth 2025-2030 (%)

12.6.5 Israel - Market size and forecast 2025-2030

Chart on Israel - Market size and forecast 2025-2030 ($ million)
Data Table on Israel - Market size and forecast 2025-2030 ($ million)
Chart on Israel - Year-over-year growth 2025-2030 (%)
Data Table on Israel - Year-over-year growth 2025-2030 (%)

12.7 South America - Market size and forecast 2025-2030

Chart on South America - Market size and forecast 2025-2030 ($ million)
Data Table on South America - Market size and forecast 2025-2030 ($ million)
Chart on South America - Year-over-year growth 2025-2030 (%)
Data Table on South America - Year-over-year growth 2025-2030 (%)
Chart on Regional Comparison - South America
Data Table on Regional Comparison - South America

12.7.1 Brazil - Market size and forecast 2025-2030

Chart on Brazil - Market size and forecast 2025-2030 ($ million)
Data Table on Brazil - Market size and forecast 2025-2030 ($ million)
Chart on Brazil - Year-over-year growth 2025-2030 (%)
Data Table on Brazil - Year-over-year growth 2025-2030 (%)

12.7.2 Argentina - Market size and forecast 2025-2030

Chart on Argentina - Market size and forecast 2025-2030 ($ million)
Data Table on Argentina - Market size and forecast 2025-2030 ($ million)
Chart on Argentina - Year-over-year growth 2025-2030 (%)
Data Table on Argentina - Year-over-year growth 2025-2030 (%)

12.7.3 Colombia - Market size and forecast 2025-2030

Chart on Colombia - Market size and forecast 2025-2030 ($ million)
Data Table on Colombia - Market size and forecast 2025-2030 ($ million)
Chart on Colombia - Year-over-year growth 2025-2030 (%)
Data Table on Colombia - Year-over-year growth 2025-2030 (%)

12.8 Market opportunity by geography

Market opportunity by geography ($ million)
Data Tables on Market opportunity by geography ($ million)

13. Drivers, Challenges, and Opportunity

13.1 Market drivers

Increasing demand for predictive maintenance and lifecycle optimization
Stringent regulatory frameworks regarding structural safety and environmental compliance
Integration of AI and IoT infrastructure asset intelligence

13.2 Market challenges

High initial implementation costs and substantial capital requirements
Data security vulnerabilities and severe privacy concerns
Shortage of skilled professionals proficient in asset intelligence technologies

13.3 Impact of drivers and challenges

Impact of drivers and challenges in 2025 and 2030

13.4 Market opportunities

Shift toward digital twins for holistic portfolio management
Rise of decentralized data architectures and edge computing
Growing emphasis on circular economy practices and sustainable material tracking

14. Competitive Landscape

14.1 Overview

14.2

Overview on criticality of inputs and factors of differentiation

14.3 Landscape disruption

Overview on factors of disruption

14.4 Industry risks

Impact of key risks on business

15. Competitive Analysis

15.1 Companies profiled

Companies covered

15.2 Company ranking index

15.3 Market positioning of companies

Matrix on companies position and classification

15.4 ABB Ltd.

ABB Ltd. - Overview
ABB Ltd. - Business segments
ABB Ltd. - Key news
ABB Ltd. - Key offerings
ABB Ltd. - Segment focus
SWOT

15.5 Autodesk Inc.

Autodesk Inc. - Overview
Autodesk Inc. - Business segments
Autodesk Inc. - Key offerings
Autodesk Inc. - Segment focus
SWOT

15.6 AVEVA Group Ltd.

AVEVA Group Ltd. - Overview
AVEVA Group Ltd. - Product / Service
AVEVA Group Ltd. - Key offerings
SWOT

15.7 Bentley Systems Inc.

Bentley Systems Inc. - Overview
Bentley Systems Inc. - Business segments
Bentley Systems Inc. - Key offerings
Bentley Systems Inc. - Segment focus
SWOT

15.8 Esri Inc.

Esri Inc. - Overview
Esri Inc. - Product / Service
Esri Inc. - Key offerings
SWOT

15.9 GE Vernova Inc.

GE Vernova Inc. - Overview
GE Vernova Inc. - Business segments
GE Vernova Inc. - Key offerings
GE Vernova Inc. - Segment focus
SWOT

15.10 Hexagon AB

Hexagon AB - Overview
Hexagon AB - Business segments
Hexagon AB - Key news
Hexagon AB - Key offerings
Hexagon AB - Segment focus
SWOT

15.11 Hitachi Vantara LLC

Hitachi Vantara LLC - Overview
Hitachi Vantara LLC - Product / Service
Hitachi Vantara LLC - Key offerings
SWOT

15.12 IBM Corp.

IBM Corp. - Overview
IBM Corp. - Business segments
IBM Corp. - Key news
IBM Corp. - Key offerings
IBM Corp. - Segment focus
SWOT

15.13 Oracle Corp.

Oracle Corp. - Overview
Oracle Corp. - Business segments
Oracle Corp. - Key news
Oracle Corp. - Key offerings
Oracle Corp. - Segment focus
SWOT

15.14 Samsara Inc.

Samsara Inc. - Overview
Samsara Inc. - Product / Service
Samsara Inc. - Key offerings
SWOT

15.15 SAP SE

SAP SE - Overview
SAP SE - Business segments
SAP SE - Key news
SAP SE - Key offerings
SAP SE - Segment focus
SWOT

15.16 Schneider Electric SE

Schneider Electric SE - Overview
Schneider Electric SE - Business segments
Schneider Electric SE - Key news
Schneider Electric SE - Key offerings
Schneider Electric SE - Segment focus
SWOT

15.17 Siemens AG

Siemens AG - Overview
Siemens AG - Business segments
Siemens AG - Key news
Siemens AG - Key offerings
Siemens AG - Segment focus
SWOT

15.18 Trimble Inc.

Trimble Inc. - Overview
Trimble Inc. - Business segments
Trimble Inc. - Key offerings
Trimble Inc. - Segment focus
SWOT

16. Appendix

16.1 Scope of the report

Market definition
Objectives
Notes and caveats

16.2 Inclusions and exclusions checklist

Inclusions checklist
Exclusions checklist

16.3 Currency conversion rates for US$

16.4 Research methodology

16.5 Data procurement

Information sources

16.6 Data validation

16.7 Validation techniques employed for market sizing

16.8 Data synthesis

16.9 360 degree market analysis

16.10 List of abbreviations

Research Methodology

Technavio presents a detailed picture of the market by way of study, synthesis, and summation of data from multiple sources. The analysts have presented the various facets of the market with a particular focus on identifying the key industry influencers. The data thus presented is comprehensive, reliable, and the result of extensive research, both primary and secondary.

INFORMATION SOURCES

Primary sources

  • Manufacturers and suppliers
  • Channel partners
  • Industry experts
  • Strategic decision makers

Secondary sources

  • Industry journals and periodicals
  • Government data
  • Financial reports of key industry players
  • Historical data
  • Press releases

DATA ANALYSIS

Data Synthesis

  • Collation of data
  • Estimation of key figures
  • Analysis of derived insights

Data Validation

  • Triangulation with data models
  • Reference against proprietary databases
  • Corroboration with industry experts

REPORT WRITING

Qualitative

  • Market drivers
  • Market challenges
  • Market trends
  • Five forces analysis

Quantitative

  • Market size and forecast
  • Market segmentation
  • Geographical insights
  • Competitive landscape

Interested in this report?

Get your sample now to see our research methodology and insights!

Download Now

Frequently Asked Questions

Infrastructure Asset Intelligence market growth will increase by USD 5106.9 million during 2026-2030.

The Infrastructure Asset Intelligence market is expected to grow at a CAGR of 15.5% during 2026-2030.

Infrastructure Asset Intelligence market is segmented by Component (Software, Services, Hardware) Type (Transportation infrastructure, Energy infrastructure, Water and wastewater infrastructure, Smart‑city and urban infrastructure, Industrial and critical‑infrastructure) Application (Asset performance management, Predictive maintenance, Condition monitoring)

ABB Ltd., Autodesk Inc., AVEVA Group Ltd., Bentley Systems Inc., Cisco Systems Inc., DroneDeploy Inc., Esri Inc., Fugro NV, GE Vernova Inc., Hexagon AB, Hitachi Vantara LLC, IBM Corp., Oracle Corp., Palantir Technologies Inc., Samsara Inc., SAP SE, Schneider Electric SE, Siemens AG, Skydio Inc., Trimble Inc. are a few of the key vendors in the Infrastructure Asset Intelligence market.

North America will register the highest growth rate of 32.9% among the other regions. Therefore, the Infrastructure Asset Intelligence market in North America is expected to garner significant business opportunities for the vendors during the forecast period.

US, Canada, Mexico, China, Japan, India, South Korea, Australia, Indonesia, Germany, UK, France, Italy, Spain, The Netherlands, Saudi Arabia, UAE, South Africa, Turkey, Israel, Brazil, Argentina, Colombia

  • Increasing demand for predictive maintenance and lifecycle optimization is the driving factor this market.

The Infrastructure Asset Intelligence market vendors should focus on grabbing business opportunities from the Component segment as it accounted for the largest market share in the base year.
RIA - Research AI Assistant
Ask RIA