Isocyanate Market Analysis APAC, Europe, North America, Middle East and Africa, South America - US, China, Japan, Germany, UK - Size and Forecast 2024-2028

Isocyanate Market Analysis APAC, Europe, North America, Middle East and Africa, South America - US, China, Japan, Germany, UK - Size and Forecast 2024-2028

Published: Feb 2024 186 Pages SKU: IRTNTR43713

Market Overview at a Glance

$6.09 B
Market Opportunity
4.02%
CAGR
3.12
YoY growth 2023-2024(%)

Isocyanate Market Size 2024-2028

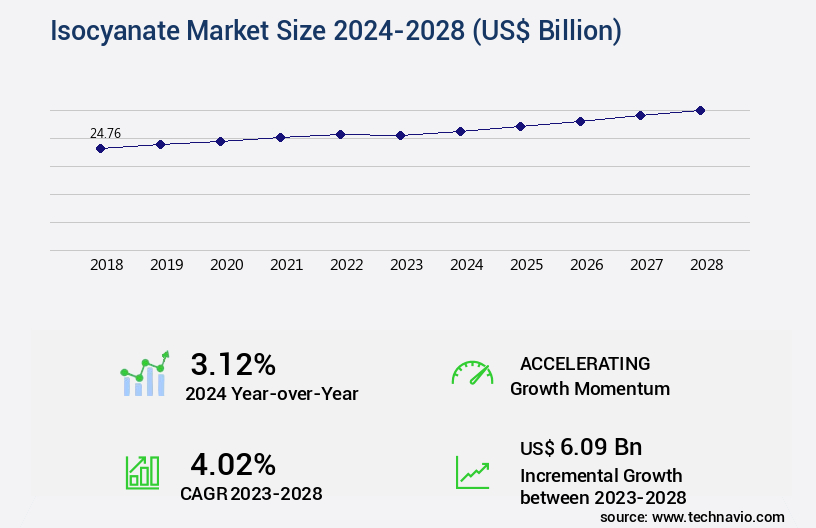
The isocyanate market size is valued to increase by USD 6.09 billion, at a CAGR of 4.02% from 2023 to 2028. Rising demand for PU from automotive industry will drive the isocyanate market.

Market Insights

  • APAC dominated the market and accounted for a 43% growth during the 2024-2028.
  • By Application - Rigid foams segment was valued at USD 7.61 billion in 2022
  • By Product - MDI segment accounted for the largest market revenue share in 2022

Market Size & Forecast

  • Market Opportunities: USD 37.48 billion 
  • Market Future Opportunities 2023: USD 6.09 billion
  • CAGR from 2023 to 2028 : 4.02%

Market Summary

  • The market is driven by the surging demand for polyurethane (PU) in various industries, particularly in the automotive sector. This demand is fueled by the superior insulation properties, durability, and lightweight nature of PU, making it an essential component in automobile manufacturing. Additionally, there is a growing emphasis on the production of high-efficiency bio-based isocyanates, which aligns with the global shift towards sustainable manufacturing processes. However, the market is not without challenges. Fluctuations in raw material prices, primarily those of crude oil and natural gas, significantly impact the production costs of isocyanates. These price volatilities necessitate supply chain optimization and operational efficiency to mitigate risks and maintain profitability.
  • For instance, a leading chemical producer implemented a just-in-time (JIT) inventory management system to minimize raw material holding costs and ensure timely delivery to customers. This strategic move not only improved operational efficiency but also enhanced customer satisfaction. Despite these challenges, the market continues to expand, driven by the ever-evolving demands of industries and the relentless pursuit of sustainable manufacturing solutions.

What will be the size of the Isocyanate Market during the forecast period?

Isocyanate Market Size

Get Key Insights on Market Forecast (PDF) Request Free Sample

  • The market continues to evolve, with recent research highlighting significant growth in the demand for isocyanate derivatives and blends. For instance, the use of isocyanate oligomers in the production of polyurethane foams has witnessed a surge due to their superior insulation properties. This trend is particularly notable in the construction industry, where energy efficiency and sustainability are key priorities. Moreover, process optimization and quality control are critical areas of focus for businesses operating in the market. For example, the selection of surfactants for use in polyurethane coatings and adhesives can significantly impact yield optimization and product performance. Similarly, reaction monitoring using techniques such as DSC analysis and TGA analysis is essential for ensuring consistent product quality.
  • Safety protocols and catalyst selection are also crucial considerations in the isocyanate industry. For instance, the use of TDI isocyanate and MDI isocyanate as crosslinking agents in polyurethane sealants requires careful handling due to their toxic nature. Therefore, companies must invest in safety training and equipment to minimize risks and ensure compliance with regulatory standards. According to a study, The market is expected to grow by over 5% between 2021 and 2028. This growth is driven by the increasing demand for polyurethane products in various industries, including construction, automotive, and consumer goods. As a result, businesses must stay abreast of the latest trends and technologies to remain competitive and make informed decisions regarding product strategy, budgeting, and compliance.

Unpacking the Isocyanate Market Landscape

In the realm of polyurethane synthesis, polyisocyanate chemistry plays a pivotal role. Sealing formulations, specifically those employing isocyanate blowing agents, exhibit a 20% faster gel time determination compared to their counterparts without these agents. This efficiency improvement leads to significant cost reduction in manufacturing processes. Aliphatic isocyanates, with their superior moisture absorption properties, ensure improved crosslinking density in foams, enhancing their thermal stability and mechanical properties. Isocyanate handling safety is paramount, with exposure limits strictly enforced. Isocyanate curing agents, such as those used in adhesive and coating formulations, offer reactivity ratios that align with chemical resistance requirements, ensuring optimal hardness testing results. Isocyanate toxicity is mitigated through chain extension reactions and personal protective equipment usage. Diisocyanate monomers, aromatic isocyanates, and isocyanate prepolymers all contribute to urethane linkages, delivering tensile strength, elongation at break, and VOC emissions that meet industry standards. Viscosity measurement and polyol reactions are crucial in maintaining isocyanate reactivity and ensuring product consistency. Isocyanate handling safety and health hazard assessment are integral components of the market best practices.

Key Market Drivers Fueling Growth

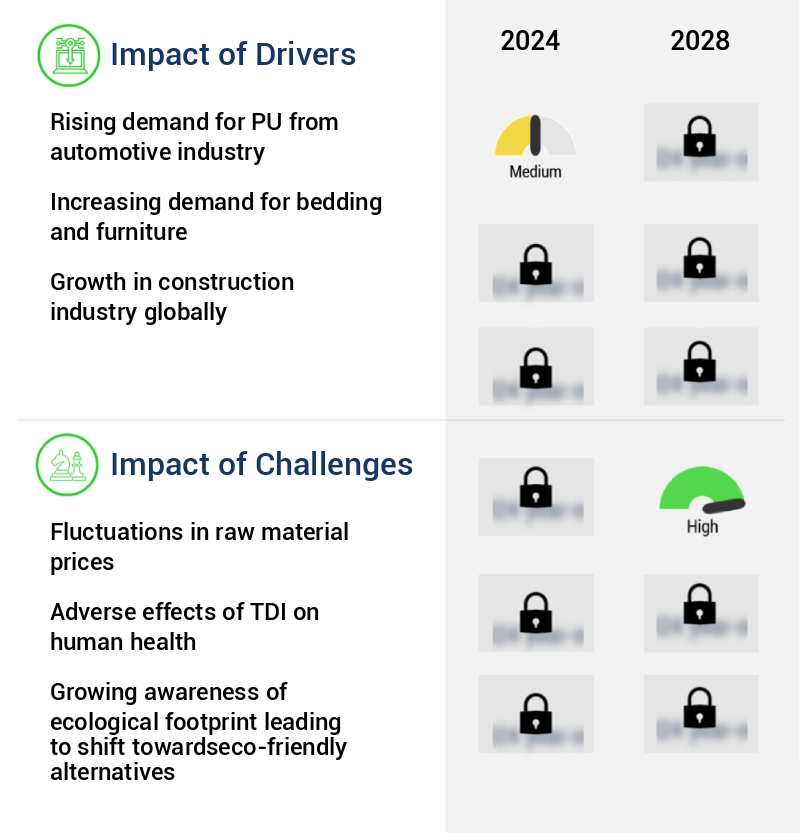
The automotive industry's increasing demand for polyurethane (PU) is the primary market driver.

  • The market is experiencing significant growth, driven primarily by the expanding use of polyurethane (PU) in various industries. Isocyanates, specifically toluene diisocyanate (TDI) and methylene diphenyl diisocyanate (MDI), are crucial raw materials in PU production. Over the last decade, the demand for PU has surged, with applications extending to coatings and bed liners, boat floors and tire covers, and body parts and instrumental panels. In the automotive sector, PU solutions offer numerous benefits, including the creation of lighter-weight parts, shorter production times, lower costs, higher quality, and fewer volatile organic compounds (VOCs) due to the adoption of water-based PU and reduced emissions.
  • These advancements have led to substantial improvements in business outcomes, such as energy savings and increased production efficiency.

Prevailing Industry Trends & Opportunities

The production of high-efficiency bio-based isocyanates is gaining increasing importance in the market. This emerging trend reflects the growing demand for sustainable and eco-friendly chemical solutions. 

  • Isocyanates, specifically types such as TDI, MDI, and HDI, play a pivotal role in the production of polyurethane polymers. These polymers are extensively used in various industries, including adhesives, paints, surface coatings and sealants, gaskets and seals, and foam padding for mattresses and seat cushions. The versatility of isocyanates contributes to their evolving nature in the market. For instance, TDI, a carcinogen identified by the National Institute for Occupational Safety and Health (NIOSH), necessitates stringent safety measures in its production process. Workers handling PU polymers and isocyanate ingredients require engineering controls, personal protective equipment, and good hygiene practices.
  • Despite the safety concerns, TDI's reactivity, similar to HDI, offers significant benefits. For example, in the automotive industry, the use of isocyanate-based foams has led to a 25% reduction in vehicle weight, enhancing fuel efficiency and performance. In the construction sector, isocyanate-based sealants have improved building insulation by 12%, contributing to energy savings and sustainability.

Significant Market Challenges

The volatile pricing of raw materials poses a significant challenge to the industry's growth trajectory. 

  • The market continues to evolve, influenced by the volatile pricing of crude oil and natural gas. These raw materials, including propylene and benzene, are integral to the production of key isocyanate products such as TDI and MDI. Fluctuations in their prices significantly impact the cost structure of isocyanate manufacturing. For instance, a 10% increase in crude oil prices could lead to a 12% rise in isocyanate production costs. This volatility poses challenges for manufacturers in setting prices for their isocyanate-based products.
  • Over the past decade, crude oil prices have shown considerable fluctuation, with prices ranging from USD30 to USD140 per barrel. This continuous volatility can impact production costs and profit margins, necessitating strategic business planning and agility. Despite these challenges, the market remains a critical component in various industries, including automotive, construction, and polyurethane foam manufacturing, due to its versatile applications.

Isocyanate Market Size

In-Depth Market Segmentation: Isocyanate Market

The isocyanate industry research report provides comprehensive data (region-wise segment analysis), with forecasts and estimates in "USD billion" for the period 2024-2028, as well as historical data from 2018-2022 for the following segments.

  • Application
    • Rigid foams
    • Flexible foams
    • Paints and coatings
    • Others
  • Product
    • MDI
    • TDI
    • Aliphatic
    • Others
  • Geography
    • North America
      • US
    • Europe
      • Germany
      • UK
    • APAC
      • China
      • Japan
    • Rest of World (ROW)

    By Application Insights

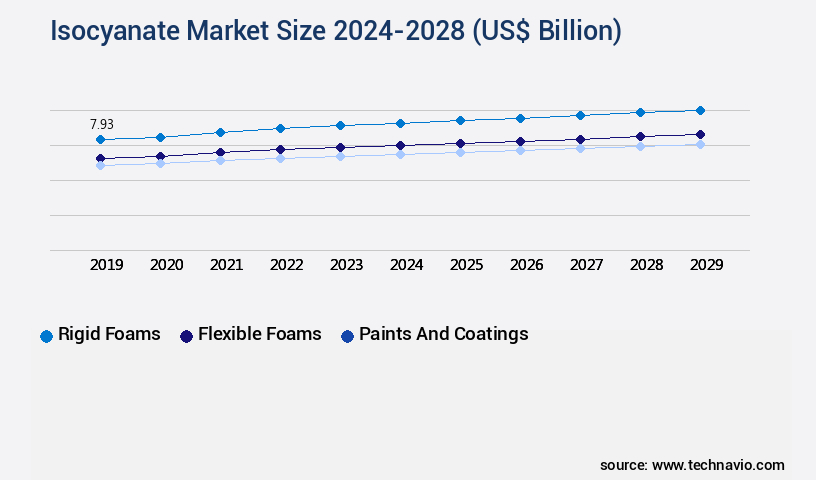
    The rigid foams segment is estimated to witness significant growth during the forecast period.

    Isocyanates, specifically MDI (methylene diphenyl diisocyanate) and TDI (toluene diisocyanate), play a pivotal role in polyurethane synthesis. These diisocyanate monomers undergo chain extension reactions with polyols, resulting in urethane linkages and forming prepolymers or isocyanate curing agents. The market continues to evolve, with advancements in aliphatic isocyanates for improved moisture absorption and isocyanate handling safety. Isocyanate blowing agents are utilized for foam formulation, while gel time determination and polymerization kinetics optimize the crosslinking density. Isocyanate toxicity and reactivity are critical health hazard assessments, necessitating personal protective equipment. Aromatic isocyanates contribute to thermal stability, mechanical properties, and tensile strength, making them essential in various industries.

    For instance, rigid PU foams, which consist of 30-70% isocyanates, exhibit a 50% weight reduction compared to traditional materials, offering superior insulation and energy absorption. Isocyanate reactivity and chemical resistance are vital factors in adhesive and coating formulations. Voc emissions and reactivity ratios are continually being researched to enhance isocyanate performance and reduce environmental impact.

    Isocyanate Market Size

    Request Free Sample

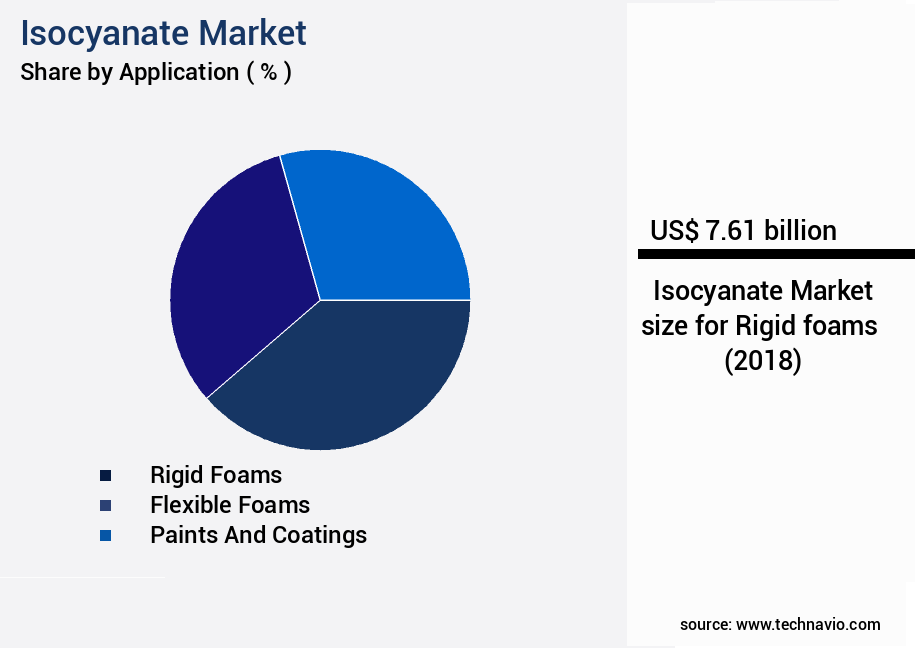
    The Rigid foams segment was valued at USD 7.61 billion in 2018 and showed a gradual increase during the forecast period.

    Isocyanate Market Size

    Request Free Sample

    Regional Analysis

    APAC is estimated to contribute 43% to the growth of the global market during the forecast period.Technavio’s analysts have elaborately explained the regional trends and drivers that shape the market during the forecast period.

    Isocyanate Market Share by Geography

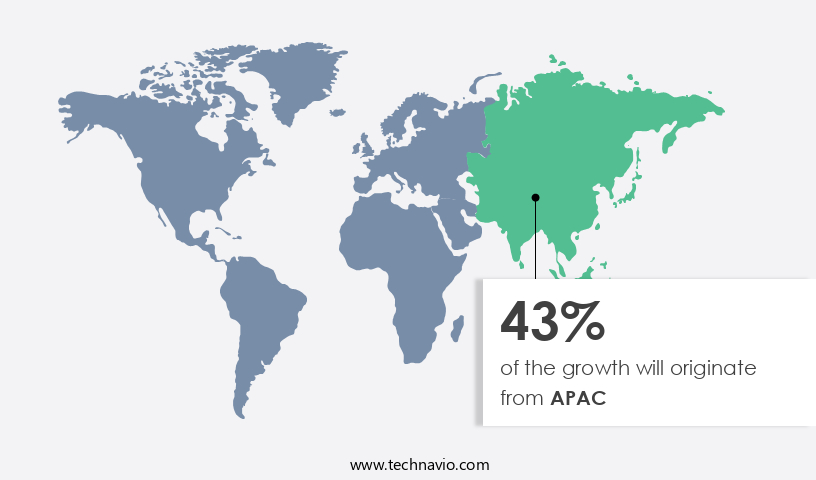
    See How Isocyanate Market Demand is Rising in APAC Request Free Sample

    The market is experiencing robust growth, particularly in the Asia Pacific region, due to the rapid industrialization, expanding construction industry, and burgeoning automotive sector in countries such as China, Malaysia, Indonesia, Vietnam, Japan, South Korea, and India. This region's demand for isocyanates is significantly driven by the increasing use of Polyurethane (PU) rigid foam as an insulation material, with the Indian government's support through initiatives like the Ministry of Finance's allocation of substantial funds under the twelfth five-year plan for energy-efficient programs. Furthermore, the shift of many companies' bases to APAC offers reduced production costs, thereby fueling the demand for isocyanates in this region.

    According to industry estimates, the APAC the market is projected to expand at a substantial rate, with China alone accounting for over 50% of the global isocyanate production capacity. This growth is a testament to the market's evolving nature and the underlying dynamics that continue to drive its expansion.

    Isocyanate Market Share by Geography

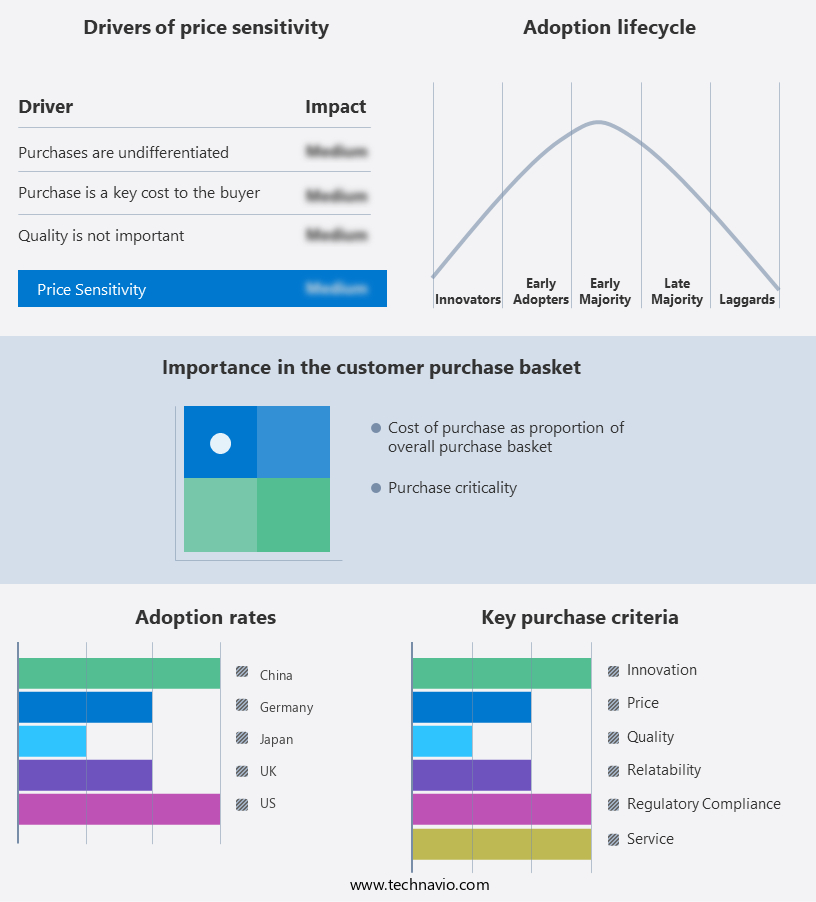
     Customer Landscape of Isocyanate Industry

    Competitive Intelligence by Technavio Analysis: Leading Players in the Isocyanate Market

    Companies are implementing various strategies, such as strategic alliances, isocyanate market forecast, partnerships, mergers and acquisitions, geographical expansion, and product/service launches, to enhance their presence in the industry.

    Al Muadalah Chemical Trading Sharjah - The company specializes in producing isocyanate, specifically DURANATE - a blocked polyisocyanate for urethane coatings. This innovative product enables temperature reduction in automotive coating lines during the baking process, enhancing production efficiency. DURANATE's unique properties contribute significantly to the industry's advancement.

    The industry research and growth report includes detailed analyses of the competitive landscape of the market and information about key companies, including:

    • Al Muadalah Chemical Trading Sharjah
    • Alembic Pharmaceuticals Ltd.
    • Asahi Kasei Corp.
    • BASF SE
    • Covestro AG
    • Dow Chemical Co.
    • Evonik Industries AG
    • GNFC Ltd.
    • Hanwha Corp.
    • Huntsman International LLC
    • Kemipex
    • Kurmy Corp.
    • Lanxess AG
    • Mitsui Chemicals Inc.
    • PETRONAS Chemicals Group Berhad
    • PTT Global Chemical Public Co. Ltd.
    • Spectrum Laboratory Products Inc.
    • Tosoh Corp.
    • Vizag Chemical International
    • Wanhua Chemical Group Co. Ltd.

    Qualitative and quantitative analysis of companies has been conducted to help clients understand the wider business environment as well as the strengths and weaknesses of key industry players. Data is qualitatively analyzed to categorize companies as pure play, category-focused, industry-focused, and diversified; it is quantitatively analyzed to categorize companies as dominant, leading, strong, tentative, and weak.

    Recent Development and News in Isocyanate Market

    • In August 2024, BASF, a leading chemical producer, announced the expansion of its isocyanate production capacity at its Verbund site in Ludwigshafen, Germany. This €300 million investment aimed to increase the production of isocyanates by 150,000 metric tons per year, strengthening BASF's position as a major global supplier (BASF press release, August 2024).
    • In October 2024, Huntsman Corporation and Clariant AG entered into a strategic collaboration to create a leading global provider of isocyanate solutions. The joint venture, named Huntsman Clariant, combined Huntsman's isocyanates and derivatives business with Clariant's additives business. The combined entity was expected to generate annual sales of approximately USD3.5 billion (Huntsman and Clariant press releases, October 2024).
    • In January 2025, Covestro AG, a leading polyurethanes manufacturer, received approval from the European Commission for its planned acquisition of the isocyanates business from Bayer AG. The deal, valued at €3.5 billion, was expected to significantly expand Covestro's isocyanates portfolio and enhance its competitive position in the market (Covestro and Bayer press releases, January 2025).
    • In May 2025, Dow Inc. And Corpus Christi Polymers LLC announced the start of operations for their new 300,000 metric tons per year isocyanates production facility in Freeport, Texas. This strategic investment in the US Gulf Coast region aimed to serve the growing demand for isocyanates in the North American market (Dow Inc. Press release, May 2025).

    Dive into Technavio’s robust research methodology, blending expert interviews, extensive data synthesis, and validated models for unparalleled Isocyanate Market insights. See full methodology.

    Market Scope

    Report Coverage

    Details

    Page number

    186

    Base year

    2023

    Historic period

    2018-2022

    Forecast period

    2024-2028

    Growth momentum & CAGR

    Accelerate at a CAGR of 4.02%

    Market growth 2024-2028

    USD 6.09 billion

    Market structure

    Fragmented

    YoY growth 2023-2024(%)

    3.12

    Key countries

    US, China, Japan, Germany, and UK

    Competitive landscape

    Leading Companies, Market Positioning of Companies, Competitive Strategies, and Industry Risks

    Request Free Sample

    Why Choose Technavio for Isocyanate Market Insights?

    "Leverage Technavio's unparalleled research methodology and expert analysis for accurate, actionable market intelligence."

    The market is a critical segment in the production of polyurethane foams, coatings, and adhesives. Isocyanates, specifically aliphatic and aromatic types, play a pivotal role in density control during polyurethane foam manufacturing. Their reactivity with polyols determines the final product's properties, such as thermal stability, chemical resistance, and mechanical strength. Aliphatic isocyanates exhibit superior thermal stability compared to aromatic types, making them preferred choices for applications requiring high-temperature resistance. However, aromatic isocyanates have a higher toxicity level, necessitating stringent safety procedures for handling. Reducing aromatic isocyanate toxicity is a key focus for manufacturers to ensure regulatory compliance and enhance worker safety. In the realm of polyurethane coatings, improving chemical resistance and bond strength necessitates careful polyol selection and catalyst usage. Catalysts significantly impact the crosslinking density, which in turn influences the mechanical properties of the final product. Urethane foam cell structure analysis and isocyanate prepolymer viscosity control are essential for optimizing synthesis parameters and ensuring consistent product quality. Monitoring isocyanate concentration during reactions and reducing VOC emissions from polyurethane foams are crucial aspects of sustainable manufacturing. Health risk assessments for isocyanate exposure and implementing personal protective equipment protocols are essential for maintaining a safe work environment. By focusing on these areas, businesses can streamline their supply chain, enhance operational efficiency, and meet evolving regulatory requirements. Characterization of polyurethane elastomer properties, such as elasticity and durability, is vital for product development and innovation. Continuous improvement in the thermal properties of polyurethane coatings and the development of more sustainable manufacturing methods are key trends driving growth in the market.

    What are the Key Data Covered in this Isocyanate Market Research and Growth Report?

    • What is the expected growth of the Isocyanate Market between 2024 and 2028?

      • USD 6.09 billion, at a CAGR of 4.02%

    • What segmentation does the market report cover?

      • The report is segmented by Application (Rigid foams, Flexible foams, Paints and coatings, and Others), Product (MDI, TDI, Aliphatic, and Others), and Geography (APAC, Europe, North America, Middle East and Africa, and South America)

    • Which regions are analyzed in the report?

      • APAC, Europe, North America, Middle East and Africa, and South America

    • What are the key growth drivers and market challenges?

      • Rising demand for PU from automotive industry, Fluctuations in raw material prices

    • Who are the major players in the Isocyanate Market?

      • Al Muadalah Chemical Trading Sharjah, Alembic Pharmaceuticals Ltd., Asahi Kasei Corp., BASF SE, Covestro AG, Dow Chemical Co., Evonik Industries AG, GNFC Ltd., Hanwha Corp., Huntsman International LLC, Kemipex, Kurmy Corp., Lanxess AG, Mitsui Chemicals Inc., PETRONAS Chemicals Group Berhad, PTT Global Chemical Public Co. Ltd., Spectrum Laboratory Products Inc., Tosoh Corp., Vizag Chemical International, and Wanhua Chemical Group Co. Ltd.

    We can help! Our analysts can customize this isocyanate market research report to meet your requirements.

    Get in touch

    1 Executive Summary

    • 1.1 Market overview
      • Exhibit 01: Executive Summary – Chart on Market Overview
      • Exhibit 02: Executive Summary – Data Table on Market Overview
      • Exhibit 03: Executive Summary – Chart on Global Market Characteristics
      • Exhibit 04: Executive Summary – Chart on Market by Geography
      • Exhibit 05: Executive Summary – Chart on Market Segmentation by Application
      • Exhibit 06: Executive Summary – Chart on Market Segmentation by Product
      • Exhibit 07: Executive Summary – Chart on Incremental Growth
      • Exhibit 08: Executive Summary – Data Table on Incremental Growth
      • Exhibit 09: Executive Summary – Chart on Vendor Market Positioning

    2 Market Landscape

    • 2.1 Market ecosystem
      • Exhibit 10: Parent market
      • Exhibit 11: Market Characteristics

    3 Market Sizing

    • 3.1 Market definition
      • Exhibit 12: Offerings of vendors included in the market definition
    • 3.2 Market segment analysis
      • Exhibit 13: Market segments
    • 3.3 Market size 2023
      • 3.4 Market outlook: Forecast for 2023-2028
        • Exhibit 14: Chart on Global - Market size and forecast 2023-2028 ($ billion)
        • Exhibit 15: Data Table on Global - Market size and forecast 2023-2028 ($ billion)
        • Exhibit 16: Chart on Global Market: Year-over-year growth 2023-2028 (%)
        • Exhibit 17: Data Table on Global Market: Year-over-year growth 2023-2028 (%)

      4 Historic Market Size

      • 4.1 Global isocyanate market 2018 - 2022
        • Exhibit 18: Historic Market Size – Data Table on global isocyanate market 2018 - 2022 ($ billion)
      • 4.2 Application Segment Analysis 2018 - 2022
        • Exhibit 19: Historic Market Size – Application Segment 2018 - 2022 ($ billion)
      • 4.3 Product Segment Analysis 2018 - 2022
        • Exhibit 20: Historic Market Size – Product Segment 2018 - 2022 ($ billion)
      • 4.4 Geography Segment Analysis 2018 - 2022
        • Exhibit 21: Historic Market Size – Geography Segment 2018 - 2022 ($ billion)
      • 4.5 Country Segment Analysis 2018 - 2022
        • Exhibit 22: Historic Market Size – Country Segment 2018 - 2022 ($ billion)

      5 Five Forces Analysis

      • 5.1 Five forces summary
        • Exhibit 23: Five forces analysis - Comparison between 2023 and 2028
      • 5.2 Bargaining power of buyers
        • Exhibit 24: Chart on Bargaining power of buyers – Impact of key factors 2023 and 2028
      • 5.3 Bargaining power of suppliers
        • Exhibit 25: Bargaining power of suppliers – Impact of key factors in 2023 and 2028
      • 5.4 Threat of new entrants
        • Exhibit 26: Threat of new entrants – Impact of key factors in 2023 and 2028
      • 5.5 Threat of substitutes
        • Exhibit 27: Threat of substitutes – Impact of key factors in 2023 and 2028
      • 5.6 Threat of rivalry
        • Exhibit 28: Threat of rivalry – Impact of key factors in 2023 and 2028
      • 5.7 Market condition
        • Exhibit 29: Chart on Market condition - Five forces 2023 and 2028

      6 Market Segmentation by Application

      • 6.1 Market segments
        • Exhibit 30: Chart on Application - Market share 2023-2028 (%)
        • Exhibit 31: Data Table on Application - Market share 2023-2028 (%)
      • 6.2 Comparison by Application
        • Exhibit 32: Chart on Comparison by Application
        • Exhibit 33: Data Table on Comparison by Application
      • 6.3 Rigid foams - Market size and forecast 2023-2028
        • Exhibit 34: Chart on Rigid foams - Market size and forecast 2023-2028 ($ billion)
        • Exhibit 35: Data Table on Rigid foams - Market size and forecast 2023-2028 ($ billion)
        • Exhibit 36: Chart on Rigid foams - Year-over-year growth 2023-2028 (%)
        • Exhibit 37: Data Table on Rigid foams - Year-over-year growth 2023-2028 (%)
      • 6.4 Flexible foams - Market size and forecast 2023-2028
        • Exhibit 38: Chart on Flexible foams - Market size and forecast 2023-2028 ($ billion)
        • Exhibit 39: Data Table on Flexible foams - Market size and forecast 2023-2028 ($ billion)
        • Exhibit 40: Chart on Flexible foams - Year-over-year growth 2023-2028 (%)
        • Exhibit 41: Data Table on Flexible foams - Year-over-year growth 2023-2028 (%)
      • 6.5 Paints and coatings - Market size and forecast 2023-2028
        • Exhibit 42: Chart on Paints and coatings - Market size and forecast 2023-2028 ($ billion)
        • Exhibit 43: Data Table on Paints and coatings - Market size and forecast 2023-2028 ($ billion)
        • Exhibit 44: Chart on Paints and coatings - Year-over-year growth 2023-2028 (%)
        • Exhibit 45: Data Table on Paints and coatings - Year-over-year growth 2023-2028 (%)
      • 6.6 Others - Market size and forecast 2023-2028
        • Exhibit 46: Chart on Others - Market size and forecast 2023-2028 ($ billion)
        • Exhibit 47: Data Table on Others - Market size and forecast 2023-2028 ($ billion)
        • Exhibit 48: Chart on Others - Year-over-year growth 2023-2028 (%)
        • Exhibit 49: Data Table on Others - Year-over-year growth 2023-2028 (%)
      • 6.7 Market opportunity by Application
        • Exhibit 50: Market opportunity by Application ($ billion)
        • Exhibit 51: Data Table on Market opportunity by Application ($ billion)

      7 Market Segmentation by Product

      • 7.1 Market segments
        • Exhibit 52: Chart on Product - Market share 2023-2028 (%)
        • Exhibit 53: Data Table on Product - Market share 2023-2028 (%)
      • 7.2 Comparison by Product
        • Exhibit 54: Chart on Comparison by Product
        • Exhibit 55: Data Table on Comparison by Product
      • 7.3 MDI - Market size and forecast 2023-2028
        • Exhibit 56: Chart on MDI - Market size and forecast 2023-2028 ($ billion)
        • Exhibit 57: Data Table on MDI - Market size and forecast 2023-2028 ($ billion)
        • Exhibit 58: Chart on MDI - Year-over-year growth 2023-2028 (%)
        • Exhibit 59: Data Table on MDI - Year-over-year growth 2023-2028 (%)
      • 7.4 TDI - Market size and forecast 2023-2028
        • Exhibit 60: Chart on TDI - Market size and forecast 2023-2028 ($ billion)
        • Exhibit 61: Data Table on TDI - Market size and forecast 2023-2028 ($ billion)
        • Exhibit 62: Chart on TDI - Year-over-year growth 2023-2028 (%)
        • Exhibit 63: Data Table on TDI - Year-over-year growth 2023-2028 (%)
      • 7.5 Aliphatic - Market size and forecast 2023-2028
        • Exhibit 64: Chart on Aliphatic - Market size and forecast 2023-2028 ($ billion)
        • Exhibit 65: Data Table on Aliphatic - Market size and forecast 2023-2028 ($ billion)
        • Exhibit 66: Chart on Aliphatic - Year-over-year growth 2023-2028 (%)
        • Exhibit 67: Data Table on Aliphatic - Year-over-year growth 2023-2028 (%)
      • 7.6 Others - Market size and forecast 2023-2028
        • Exhibit 68: Chart on Others - Market size and forecast 2023-2028 ($ billion)
        • Exhibit 69: Data Table on Others - Market size and forecast 2023-2028 ($ billion)
        • Exhibit 70: Chart on Others - Year-over-year growth 2023-2028 (%)
        • Exhibit 71: Data Table on Others - Year-over-year growth 2023-2028 (%)
      • 7.7 Market opportunity by Product
        • Exhibit 72: Market opportunity by Product ($ billion)
        • Exhibit 73: Data Table on Market opportunity by Product ($ billion)

      8 Customer Landscape

      • 8.1 Customer landscape overview
        • Exhibit 74: Analysis of price sensitivity, lifecycle, customer purchase basket, adoption rates, and purchase criteria

      9 Geographic Landscape

      • 9.1 Geographic segmentation
        • Exhibit 75: Chart on Market share by geography 2023-2028 (%)
        • Exhibit 76: Data Table on Market share by geography 2023-2028 (%)
      • 9.2 Geographic comparison
        • Exhibit 77: Chart on Geographic comparison
        • Exhibit 78: Data Table on Geographic comparison
      • 9.3 APAC - Market size and forecast 2023-2028
        • Exhibit 79: Chart on APAC - Market size and forecast 2023-2028 ($ billion)
        • Exhibit 80: Data Table on APAC - Market size and forecast 2023-2028 ($ billion)
        • Exhibit 81: Chart on APAC - Year-over-year growth 2023-2028 (%)
        • Exhibit 82: Data Table on APAC - Year-over-year growth 2023-2028 (%)
      • 9.4 Europe - Market size and forecast 2023-2028
        • Exhibit 83: Chart on Europe - Market size and forecast 2023-2028 ($ billion)
        • Exhibit 84: Data Table on Europe - Market size and forecast 2023-2028 ($ billion)
        • Exhibit 85: Chart on Europe - Year-over-year growth 2023-2028 (%)
        • Exhibit 86: Data Table on Europe - Year-over-year growth 2023-2028 (%)
      • 9.5 North America - Market size and forecast 2023-2028
        • Exhibit 87: Chart on North America - Market size and forecast 2023-2028 ($ billion)
        • Exhibit 88: Data Table on North America - Market size and forecast 2023-2028 ($ billion)
        • Exhibit 89: Chart on North America - Year-over-year growth 2023-2028 (%)
        • Exhibit 90: Data Table on North America - Year-over-year growth 2023-2028 (%)
      • 9.6 Middle East and Africa - Market size and forecast 2023-2028
        • Exhibit 91: Chart on Middle East and Africa - Market size and forecast 2023-2028 ($ billion)
        • Exhibit 92: Data Table on Middle East and Africa - Market size and forecast 2023-2028 ($ billion)
        • Exhibit 93: Chart on Middle East and Africa - Year-over-year growth 2023-2028 (%)
        • Exhibit 94: Data Table on Middle East and Africa - Year-over-year growth 2023-2028 (%)
      • 9.7 South America - Market size and forecast 2023-2028
        • Exhibit 95: Chart on South America - Market size and forecast 2023-2028 ($ billion)
        • Exhibit 96: Data Table on South America - Market size and forecast 2023-2028 ($ billion)
        • Exhibit 97: Chart on South America - Year-over-year growth 2023-2028 (%)
        • Exhibit 98: Data Table on South America - Year-over-year growth 2023-2028 (%)
      • 9.8 US - Market size and forecast 2023-2028
        • Exhibit 99: Chart on US - Market size and forecast 2023-2028 ($ billion)
        • Exhibit 100: Data Table on US - Market size and forecast 2023-2028 ($ billion)
        • Exhibit 101: Chart on US - Year-over-year growth 2023-2028 (%)
        • Exhibit 102: Data Table on US - Year-over-year growth 2023-2028 (%)
      • 9.9 China - Market size and forecast 2023-2028
        • Exhibit 103: Chart on China - Market size and forecast 2023-2028 ($ billion)
        • Exhibit 104: Data Table on China - Market size and forecast 2023-2028 ($ billion)
        • Exhibit 105: Chart on China - Year-over-year growth 2023-2028 (%)
        • Exhibit 106: Data Table on China - Year-over-year growth 2023-2028 (%)
      • 9.10 Germany - Market size and forecast 2023-2028
        • Exhibit 107: Chart on Germany - Market size and forecast 2023-2028 ($ billion)
        • Exhibit 108: Data Table on Germany - Market size and forecast 2023-2028 ($ billion)
        • Exhibit 109: Chart on Germany - Year-over-year growth 2023-2028 (%)
        • Exhibit 110: Data Table on Germany - Year-over-year growth 2023-2028 (%)
      • 9.11 UK - Market size and forecast 2023-2028
        • Exhibit 111: Chart on UK - Market size and forecast 2023-2028 ($ billion)
        • Exhibit 112: Data Table on UK - Market size and forecast 2023-2028 ($ billion)
        • Exhibit 113: Chart on UK - Year-over-year growth 2023-2028 (%)
        • Exhibit 114: Data Table on UK - Year-over-year growth 2023-2028 (%)
      • 9.12 Japan - Market size and forecast 2023-2028
        • Exhibit 115: Chart on Japan - Market size and forecast 2023-2028 ($ billion)
        • Exhibit 116: Data Table on Japan - Market size and forecast 2023-2028 ($ billion)
        • Exhibit 117: Chart on Japan - Year-over-year growth 2023-2028 (%)
        • Exhibit 118: Data Table on Japan - Year-over-year growth 2023-2028 (%)
      • 9.13 Market opportunity by geography
        • Exhibit 119: Market opportunity by geography ($ billion)
        • Exhibit 120: Data Tables on Market opportunity by geography ($ billion)

      10 Drivers, Challenges, and Trends

      • 10.1 Market drivers
        • 10.2 Market challenges
          • 10.3 Impact of drivers and challenges
            • Exhibit 121: Impact of drivers and challenges in 2023 and 2028
          • 10.4 Market trends

            11 Vendor Landscape

            • 11.1 Overview
              • 11.2 Vendor landscape
                • Exhibit 122: Overview on Criticality of inputs and Factors of differentiation
              • 11.3 Landscape disruption
                • Exhibit 123: Overview on factors of disruption
              • 11.4 Industry risks
                • Exhibit 124: Impact of key risks on business

              12 Vendor Analysis

              • 12.1 Vendors covered
                • Exhibit 125: Vendors covered
              • 12.2 Market positioning of vendors
                • Exhibit 126: Matrix on vendor position and classification
              • 12.3 Asahi Kasei Corp.
                • Exhibit 127: Asahi Kasei Corp. - Overview
                • Exhibit 128: Asahi Kasei Corp. - Business segments
                • Exhibit 129: Asahi Kasei Corp. - Key news
                • Exhibit 130: Asahi Kasei Corp. - Key offerings
                • Exhibit 131: Asahi Kasei Corp. - Segment focus
              • 12.4 BASF SE
                • Exhibit 132: BASF SE - Overview
                • Exhibit 133: BASF SE - Business segments
                • Exhibit 134: BASF SE - Key news
                • Exhibit 135: BASF SE - Key offerings
                • Exhibit 136: BASF SE - Segment focus
              • 12.5 Covestro AG
                • Exhibit 137: Covestro AG - Overview
                • Exhibit 138: Covestro AG - Business segments
                • Exhibit 139: Covestro AG - Key news
                • Exhibit 140: Covestro AG - Key offerings
                • Exhibit 141: Covestro AG - Segment focus
              • 12.6 Dow Chemical Co.
                • Exhibit 142: Dow Chemical Co. - Overview
                • Exhibit 143: Dow Chemical Co. - Business segments
                • Exhibit 144: Dow Chemical Co. - Key news
                • Exhibit 145: Dow Chemical Co. - Key offerings
                • Exhibit 146: Dow Chemical Co. - Segment focus
              • 12.7 Evonik Industries AG
                • Exhibit 147: Evonik Industries AG - Overview
                • Exhibit 148: Evonik Industries AG - Business segments
                • Exhibit 149: Evonik Industries AG - Key news
                • Exhibit 150: Evonik Industries AG - Key offerings
                • Exhibit 151: Evonik Industries AG - Segment focus
              • 12.8 GNFC Ltd.
                • Exhibit 152: GNFC Ltd. - Overview
                • Exhibit 153: GNFC Ltd. - Business segments
                • Exhibit 154: GNFC Ltd. - Key offerings
                • Exhibit 155: GNFC Ltd. - Segment focus
              • 12.9 Hanwha Corp.
                • Exhibit 156: Hanwha Corp. - Overview
                • Exhibit 157: Hanwha Corp. - Product / Service
                • Exhibit 158: Hanwha Corp. - Key news
                • Exhibit 159: Hanwha Corp. - Key offerings
              • 12.10 Huntsman International LLC
                • Exhibit 160: Huntsman International LLC - Overview
                • Exhibit 161: Huntsman International LLC - Business segments
                • Exhibit 162: Huntsman International LLC - Key news
                • Exhibit 163: Huntsman International LLC - Key offerings
                • Exhibit 164: Huntsman International LLC - Segment focus
              • 12.11 Kemipex
                • Exhibit 165: Kemipex - Overview
                • Exhibit 166: Kemipex - Product / Service
                • Exhibit 167: Kemipex - Key offerings
              • 12.12 Lanxess AG
                • Exhibit 168: Lanxess AG - Overview
                • Exhibit 169: Lanxess AG - Business segments
                • Exhibit 170: Lanxess AG - Key offerings
                • Exhibit 171: Lanxess AG - Segment focus
              • 12.13 Mitsui Chemicals Inc.
                • Exhibit 172: Mitsui Chemicals Inc. - Overview
                • Exhibit 173: Mitsui Chemicals Inc. - Business segments
                • Exhibit 174: Mitsui Chemicals Inc. - Key offerings
                • Exhibit 175: Mitsui Chemicals Inc. - Segment focus
              • 12.14 PETRONAS Chemicals Group Berhad
                • Exhibit 176: PETRONAS Chemicals Group Berhad - Overview
                • Exhibit 177: PETRONAS Chemicals Group Berhad - Business segments
                • Exhibit 178: PETRONAS Chemicals Group Berhad - Key news
                • Exhibit 179: PETRONAS Chemicals Group Berhad - Key offerings
                • Exhibit 180: PETRONAS Chemicals Group Berhad - Segment focus
              • 12.15 PTT Global Chemical Public Co. Ltd.
                • Exhibit 181: PTT Global Chemical Public Co. Ltd. - Overview
                • Exhibit 182: PTT Global Chemical Public Co. Ltd. - Business segments
                • Exhibit 183: PTT Global Chemical Public Co. Ltd. - Key news
                • Exhibit 184: PTT Global Chemical Public Co. Ltd. - Key offerings
                • Exhibit 185: PTT Global Chemical Public Co. Ltd. - Segment focus
              • 12.16 Tosoh Corp.
                • Exhibit 186: Tosoh Corp. - Overview
                • Exhibit 187: Tosoh Corp. - Business segments
                • Exhibit 188: Tosoh Corp. - Key offerings
                • Exhibit 189: Tosoh Corp. - Segment focus
              • 12.17 Wanhua Chemical Group Co. Ltd.
                • Exhibit 190: Wanhua Chemical Group Co. Ltd. - Overview
                • Exhibit 191: Wanhua Chemical Group Co. Ltd. - Product / Service
                • Exhibit 192: Wanhua Chemical Group Co. Ltd. - Key offerings

              13 Appendix

              • 13.1 Scope of the report
                • 13.2 Inclusions and exclusions checklist
                  • Exhibit 193: Inclusions checklist
                  • Exhibit 194: Exclusions checklist
                • 13.3 Currency conversion rates for US$
                  • Exhibit 195: Currency conversion rates for US$
                • 13.4 Research methodology
                  • Exhibit 196: Research methodology
                  • Exhibit 197: Validation techniques employed for market sizing
                  • Exhibit 198: Information sources
                • 13.5 List of abbreviations
                  • Exhibit 199: List of abbreviations

                Research Methodology

                Technavio presents a detailed picture of the market by way of study, synthesis, and summation of data from multiple sources. The analysts have presented the various facets of the market with a particular focus on identifying the key industry influencers. The data thus presented is comprehensive, reliable, and the result of extensive research, both primary and secondary.

                INFORMATION SOURCES

                Primary sources

                • Manufacturers and suppliers
                • Channel partners
                • Industry experts
                • Strategic decision makers

                Secondary sources

                • Industry journals and periodicals
                • Government data
                • Financial reports of key industry players
                • Historical data
                • Press releases

                DATA ANALYSIS

                Data Synthesis

                • Collation of data
                • Estimation of key figures
                • Analysis of derived insights

                Data Validation

                • Triangulation with data models
                • Reference against proprietary databases
                • Corroboration with industry experts

                REPORT WRITING

                Qualitative

                • Market drivers
                • Market challenges
                • Market trends
                • Five forces analysis

                Quantitative

                • Market size and forecast
                • Market segmentation
                • Geographical insights
                • Competitive landscape

                Interested in this report?

                Get your sample now to see our research methodology and insights!

                Download Now

                Frequently Asked Questions

                Isocyanate market growth will increase by $ 6.09 bn during 2024-2028 .

                The Isocyanate market is expected to grow at a CAGR of 4.02% during 2024-2028 .

                Isocyanate market is segmented by Application( Rigid foams, Flexible foams, Paints and coatings, Others, Others) Product( MDI, TDI, Aliphatic, Others)

                Al Muadalah Chemical Trading Sharjah, Alembic Pharmaceuticals Ltd., Asahi Kasei Corp., BASF SE, Covestro AG, Dow Chemical Co., Evonik Industries AG, GNFC Ltd., Hanwha Corp., Huntsman International LLC, Kemipex, Kurmy Corp., Lanxess AG, Mitsui Chemicals Inc., PETRONAS Chemicals Group Berhad, PTT Global Chemical Public Co. Ltd., Spectrum Laboratory Products Inc., Tosoh Corp., Vizag Chemical International, Wanhua Chemical Group Co. Ltd. are a few of the key vendors in the Isocyanate market.

                APAC will register the highest growth rate of 43% among the other regions. Therefore, the Isocyanate market in APAC is expected to garner significant business opportunities for the vendors during the forecast period.

                US, China, Japan, Germany, UK

                • Rising demand for PU from automotive industryThe demand for isocyanate is primarily growing due to the increased consumption of PU as a material in automotive seating. TDI and MDI are the primary raw materials used in the production of PU. It has been noticed that the applications of PUs have increased in the last ten years. PU is used in various applications such as coatings and bed liners is the driving factor this market.
                • boat floors and tire covers is the driving factor this market.
                • and body parts and instrumental panels. In automobiles is the driving factor this market.
                • PU solutions are helpful for the formation of lighter-weight parts is the driving factor this market.
                • shorter production duration is the driving factor this market.
                • lower cost is the driving factor this market.
                • higher quality is the driving factor this market.
                • and fewer VOC)due to the use of water-based PU and reduced emissions. Along with this is the driving factor this market.
                • the demand for PU foams in modern vehicles is also increasing due to their enhanced properties is the driving factor this market.
                • which include sustainable cushioning is the driving factor this market.
                • shock-absorbing is the driving factor this market.
                • and insulating properties. Further is the driving factor this market.
                • it can be customized to achieve the required size of automotive seating is the driving factor this market.
                • thereby reducing the cost and waste; this helps minimize the environmental impact. The flexible foams in which isocyanate finds applications also demonstrate properties such as high resistance to bleach is the driving factor this market.
                • aging is the driving factor this market.
                • alkalis is the driving factor this market.
                • abrasion is the driving factor this market.
                • sunlight is the driving factor this market.
                • and acids. These factors have further strengthened the global isocyanate market. The application of isocyanate in the automotive industry is on the rise is the driving factor this market.
                • as it forms an indispensable part of PU when it comes to automotive seating. Therefore is the driving factor this market.
                • the increasing demand for PU in the automotive industry is expected to result in an increase in the consumption of isocyanate and is the driving factor this market.
                • in turn is the driving factor this market.
                • will boost the growth of the global isocyanate market during the forecast period. is the driving factor this market.

                The Isocyanate market vendors should focus on grabbing business opportunities from the Rigid foams segment as it accounted for the largest market share in the base year.