
K-12 Instruction Material Market Size 2026-2030
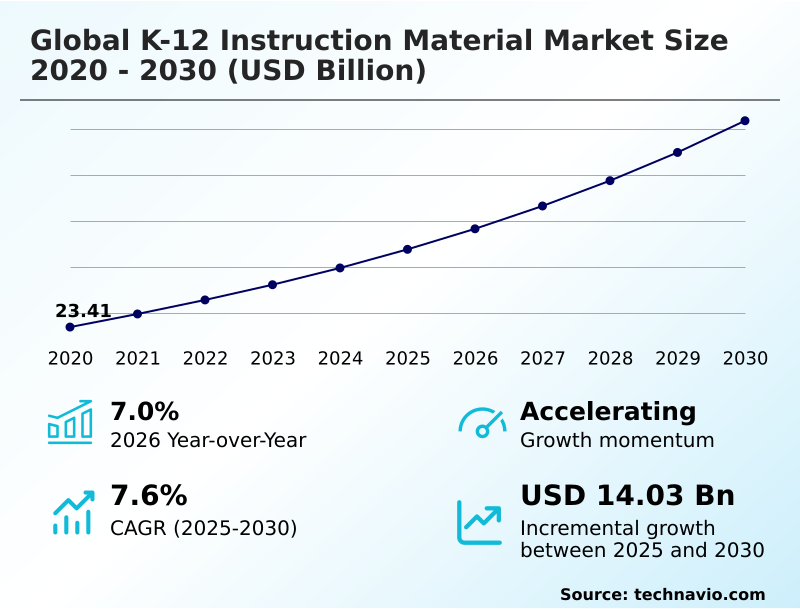
The k-12 instruction material market size is valued to increase by USD 14.03 billion, at a CAGR of 7.6% from 2025 to 2030. Proliferation of artificial intelligence and adaptive learning technologies will drive the k-12 instruction material market.
Major Market Trends & Insights
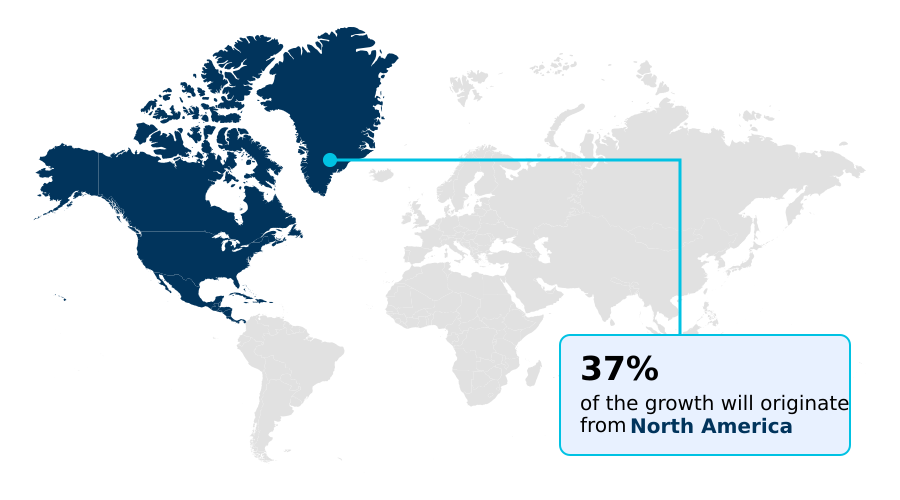
- North America dominated the market and accounted for a 36.9% growth during the forecast period.
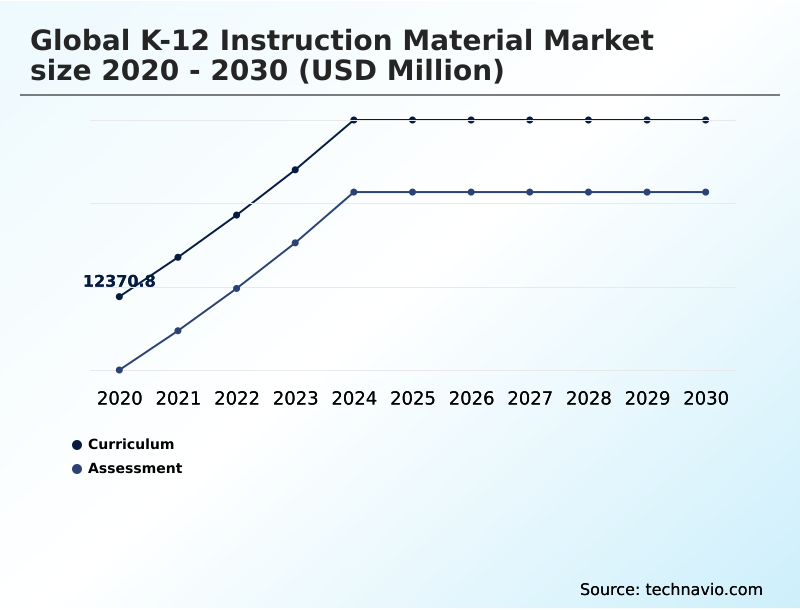
- By Courses - Curriculum segment was valued at USD 15.58 billion in 2024
- By Product - Traditional instruction material segment accounted for the largest market revenue share in 2024
Market Size & Forecast
- Market Opportunities: USD 22.51 billion
- Market Future Opportunities: USD 14.03 billion
- CAGR from 2025 to 2030 : 7.6%
Market Summary
- The K-12 instruction material market is undergoing a significant transformation, moving beyond static resources to dynamic digital ecosystems. This shift is propelled by the integration of technologies like adaptive learning platforms and generative AI curriculum design, which enable personalized student pathways and data-driven student dashboards.
- A key business focus is on optimizing resource allocation; for instance, a school district can leverage a unified instructional management system to analyze student performance tracking data and reallocate supplemental digital curriculum to schools with the greatest need, improving learning outcomes without increasing budgets.
- This approach addresses the demand for high-quality instructional materials and experiential learning activities while navigating challenges such as ensuring curriculum quality control and technological interoperability. The evolution toward interactive instructional ecosystems, incorporating elements like virtual lab simulations and immersive instructional content, reflects a broader move to enhance student engagement and prepare learners for future complexities.
What will be the Size of the K-12 Instruction Material Market during the forecast period?
Get Key Insights on Market Forecast (PDF) Get Free Sample
How is the K-12 Instruction Material Market Segmented?
The k-12 instruction material industry research report provides comprehensive data (region-wise segment analysis), with forecasts and estimates in "USD million" for the period 2026-2030, as well as historical data from 2020-2024 for the following segments.
- Courses
- Curriculum
- Assessment
- Product
- Traditional instruction material
- Digital instruction material
- Material
- Language arts
- Mathematics
- Science
- Social studies
- Others
- Geography
- North America
- US
- Canada
- Mexico
- APAC
- China
- Japan
- India
- Europe
- Germany
- UK
- France
- South America
- Brazil
- Argentina
- Middle East and Africa
- Saudi Arabia
- UAE
- South Africa
- Rest of World (ROW)
- North America
By Courses Insights
The curriculum segment is estimated to witness significant growth during the forecast period.
Market segmentation is increasingly defined by the function of materials, primarily split between curriculum and assessment. The curriculum segment, encompassing everything from core instructional frameworks to supplemental digital curriculum, is shifting toward dynamic, cloud-based curriculum delivery.
This involves integrating blended learning models and phygital learning models to support diverse instructional needs. Institutions are prioritizing competency-based education frameworks and structured literacy instruction to improve outcomes.
Assessment is evolving from summative tests to include formative assessment models and competency-based evaluations, with a focus on real-time performance analytics.
The adoption of such advanced assessment tools has led to a 15% faster identification of student learning gaps, enabling more timely intervention through automated tutoring systems and personalized student pathways. This granular segmentation ensures alignment with modern pedagogical goals.
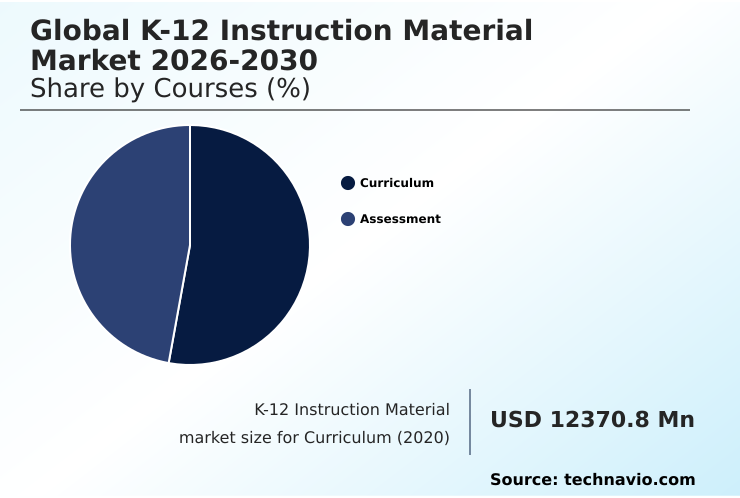
The Curriculum segment was valued at USD 15.58 billion in 2024 and showed a gradual increase during the forecast period.
Regional Analysis
North America is estimated to contribute 36.9% to the growth of the global market during the forecast period.Technavio’s analysts have elaborately explained the regional trends and drivers that shape the market during the forecast period.
See How K-12 Instruction Material Market Demand is Rising in North America Get Free Sample
Regional dynamics significantly shape the market, with North America leading in technological adoption while the APAC region focuses on scaling access to digital-first educational resources.
In North America, the emphasis is on sophisticated tools like inquiry-based learning platforms and three-dimensional science learning modules, supported by robust digital infrastructure.
In contrast, APAC's growth is driven by government initiatives to deploy bilingual instructional materials and foundational literacy skills programs to vast student populations.
This regional divergence in strategy impacts procurement; North American districts report that using integrated platforms for standards-aligned content delivery improves resource management efficiency by over 20%.
Meanwhile, successful deployments in APAC often feature offline capabilities, reflecting a practical approach to overcoming infrastructure gaps and ensuring equitable access to education.
Market Dynamics
Our researchers analyzed the data with 2025 as the base year, along with the key drivers, trends, and challenges. A holistic analysis of drivers will help companies refine their marketing strategies to gain a competitive advantage.
- The strategic direction of the K-12 instruction material market is increasingly influenced by the long-term impact of AI on curriculum development and the adoption of adaptive learning for personalized education. Educational institutions are moving beyond traditional methods, integrating gamified content for student engagement and exploring how integrating VR in K-12 science labs can transform learning.
- However, this transition is not without obstacles, as challenges in digital curriculum quality and data privacy in educational technology require careful management. The debate between open educational resources versus paid curriculum continues, with many districts evaluating the benefits of competency-based education and the ROI of edtech platforms.
- The focus has expanded to include social-emotional learning curriculum effectiveness and providing instructional materials for diverse learners. Central to successful implementation is robust teacher training for digital tool integration, ensuring educators can effectively use AI in K-12 student assessment tools.
- Institutions that successfully navigate this landscape, aligning digital content with state standards, report that teachers can reallocate up to 25% more time toward direct student interaction, a significant improvement over less integrated approaches. This shift highlights the importance of evaluating high-quality instructional materials to achieve both academic and operational goals.
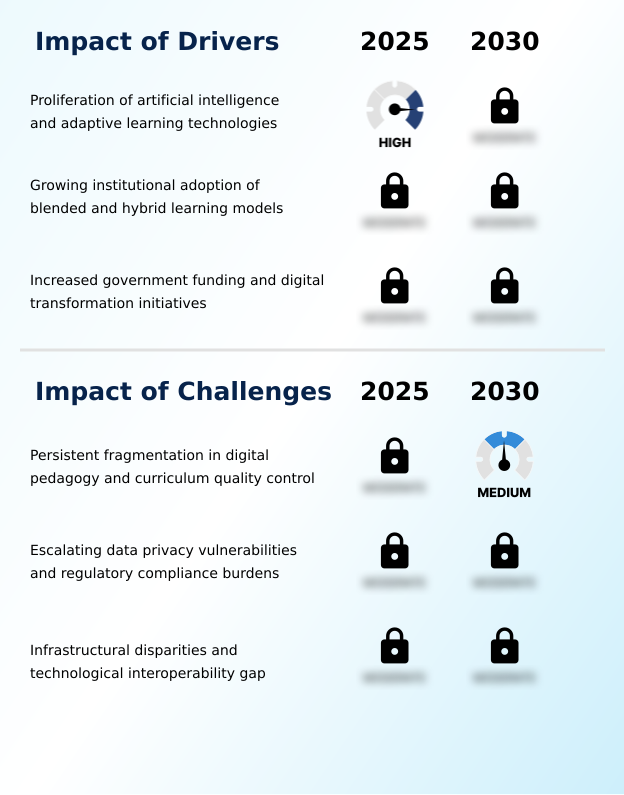
What are the key market drivers leading to the rise in the adoption of K-12 Instruction Material Industry?
- The proliferation of artificial intelligence and adaptive learning technologies serves as a key driver for the market.
- The market's momentum is fueled by the widespread adoption of digital curriculum ecosystems and collaborative software tools, which streamline instruction and communication.
- The push for data-driven decision-making has led to increased demand for learner analytics dashboards and platforms that support differentiated instruction strategies. This shift has improved resource allocation efficiency by over 25% in early-adopter districts.
- Additionally, the institutionalization of hybrid learning environments and the demand for subject-specific instructional programs are expanding the market.
- These drivers are compelling providers to offer comprehensive core curriculum packages and supplemental digital curriculum that are flexible, scalable, and aligned with evolving pedagogical standards, including conceptual mathematics understanding.
What are the market trends shaping the K-12 Instruction Material Industry?
- The proliferation of generative AI and large language models is an upcoming market trend. This development is reshaping curriculum design and content creation.
- A primary trend is the integration of generative capabilities into core instructional tools, with some systems now automating over 30% of supplemental content creation. This shift enables the deployment of phygital learning models and career and technical education (CTE) programs at scale. Another key trend is the use of evidence-based literacy programs and augmented reality experiences to deepen engagement.
- These tools, part of broader student engagement platforms, have demonstrated the ability to increase student focus by up to 20% compared to traditional methods. Furthermore, the focus on developing a robust digital citizenship curriculum and primary source analysis tools reflects a move toward cultivating critical thinking skills in a complex information environment.
What challenges does the K-12 Instruction Material Industry face during its growth?
- Persistent fragmentation in digital pedagogy and curriculum quality control presents a key challenge affecting industry growth.
- A significant market challenge is achieving effective educational technology integration amid persistent infrastructure disparities. The lack of standards-based content verification creates inconsistencies, with schools reporting that up to 40% of unvetted digital resources fail to align with curriculum goals. This fragmentation complicates the adoption of digital portfolio assessment and data-driven student dashboards.
- Furthermore, navigating complex regulations around student data privacy adds a significant layer of operational cost, estimated to be 20% higher for platforms handling sensitive performance data. Addressing these issues of interoperability and quality control is critical for realizing the full potential of advanced tools like interactive instructional ecosystems.
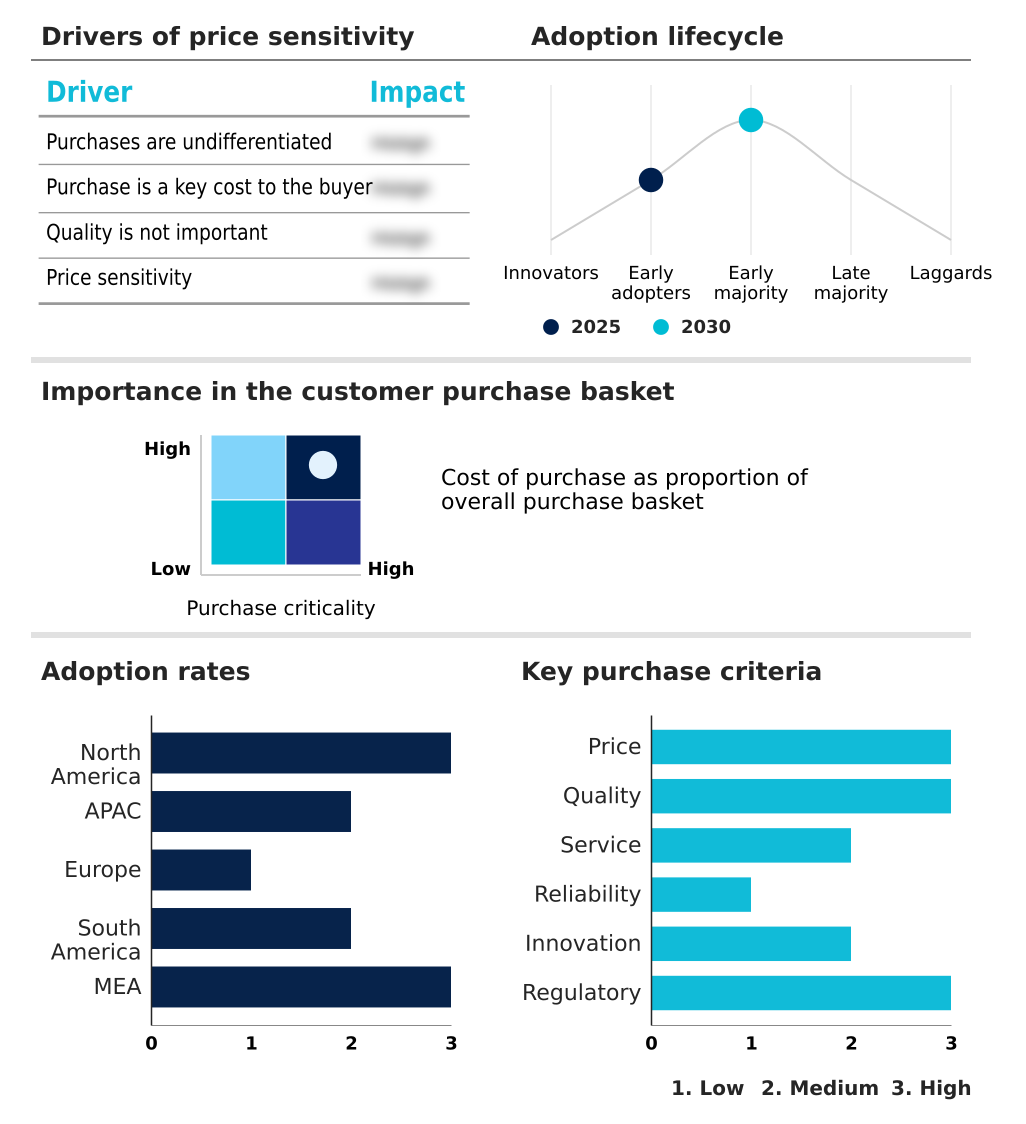
Exclusive Technavio Analysis on Customer Landscape
The k-12 instruction material market forecasting report includes the adoption lifecycle of the market, covering from the innovator’s stage to the laggard’s stage. It focuses on adoption rates in different regions based on penetration. Furthermore, the k-12 instruction material market report also includes key purchase criteria and drivers of price sensitivity to help companies evaluate and develop their market growth analysis strategies.
Customer Landscape of K-12 Instruction Material Industry
Competitive Landscape
Companies are implementing various strategies, such as strategic alliances, k-12 instruction material market forecast, partnerships, mergers and acquisitions, geographical expansion, and product/service launches, to enhance their presence in the industry.
Amplify Education Inc. - Offers K-12 instruction material solutions, including a literacy curriculum, math and science instructional programs, and personalized reading resources with various science programs.
The industry research and growth report includes detailed analyses of the competitive landscape of the market and information about key companies, including:
- Amplify Education Inc.
- ClassDojo Inc
- Curriculum Associates LLC
- Discovery Education Inc.
- Edmentum Inc.
- Extramarks Education Pvt. Ltd.
- Houghton Mifflin Harcourt Co.
- Imagine Learning LLC
- IXL Learning Inc.
- Kahoot
- McGraw Hill LLC
- Nearpod Inc.
- NextEducation India Pvt. Ltd.
- Pearson Plc
- Renaissance Learning Inc
- Savvas Learning Co. LLC
- Scholastic Corp.
- Think and Learn Pvt. Ltd.
- Toppr Technologies Pvt. Ltd.
- Vedantu Innovations Pvt. Ltd.
Qualitative and quantitative analysis of companies has been conducted to help clients understand the wider business environment as well as the strengths and weaknesses of key industry players. Data is qualitatively analyzed to categorize companies as pure play, category-focused, industry-focused, and diversified; it is quantitatively analyzed to categorize companies as dominant, leading, strong, tentative, and weak.
Recent Development and News in K-12 instruction material market
- In January 2025, the European Commission launched the European Higher Education Interoperability Framework, establishing a blueprint to address digital policy fragmentation across all educational sectors, including K-12.
- In February 2025, the Ministry of Education in India increased its budgetary allocation for the Samagra Shiksha scheme, dedicating funds to the NIPUN Bharat Mission to improve foundational literacy with new digital and physical instruction materials.
- In March 2025, McGraw Hill announced a significant expansion of its digital curriculum suite, adding advanced generative AI features to help educators customize lesson plans and instructional sequences in real-time.
- In April 2025, Houghton Mifflin Harcourt was recognized at the 2025 EdTech Awards for its social studies solution, which integrates writing instruction and literacy tools to enhance student communication skills through historical content.
Dive into Technavio’s robust research methodology, blending expert interviews, extensive data synthesis, and validated models for unparalleled K-12 Instruction Material Market insights. See full methodology.
| Market Scope | |
|---|---|
| Page number | 294 |
| Base year | 2025 |
| Historic period | 2020-2024 |
| Forecast period | 2026-2030 |
| Growth momentum & CAGR | Accelerate at a CAGR of 7.6% |
| Market growth 2026-2030 | USD 14030.2 million |
| Market structure | Fragmented |
| YoY growth 2025-2026(%) | 7.0% |
| Key countries | US, Canada, Mexico, China, Japan, India, South Korea, Australia, Indonesia, Germany, UK, France, Italy, Spain, The Netherlands, Brazil, Argentina, Chile, Saudi Arabia, UAE, South Africa, Israel and Turkey |
| Competitive landscape | Leading Companies, Market Positioning of Companies, Competitive Strategies, and Industry Risks |
Research Analyst Overview
- The market is evolving from a content-centric model to an integrated, technology-driven ecosystem where generative AI curriculum design and large language models in education are becoming standard. This transition is not merely about digitizing textbooks but about deploying adaptive learning platforms, immersive instructional content, and gamified learning environments to create personalized student pathways.
- A critical boardroom consideration is the investment in cloud-based curriculum delivery and real-time performance analytics, which demands new approaches to student data privacy and technological interoperability. For instance, districts adopting competency-based education frameworks supported by AI-driven assessment tools have seen a 15% improvement in student mastery of core concepts.
- This shift requires a focus on digital pedagogy standards, curriculum quality control, and robust virtual lab simulations. The successful integration of these elements, from social-emotional learning modules to structured literacy instruction, ultimately defines institutional competitiveness and student success.
What are the Key Data Covered in this K-12 Instruction Material Market Research and Growth Report?
-
What is the expected growth of the K-12 Instruction Material Market between 2026 and 2030?
-
USD 14.03 billion, at a CAGR of 7.6%
-
-
What segmentation does the market report cover?
-
The report is segmented by Courses (Curriculum, and Assessment), Product (Traditional instruction material, and Digital instruction material), Material (Language arts, Mathematics, Science, Social studies, and Others) and Geography (North America, APAC, Europe, South America, Middle East and Africa)
-
-
Which regions are analyzed in the report?
-
North America, APAC, Europe, South America and Middle East and Africa
-
-
What are the key growth drivers and market challenges?
-
Proliferation of artificial intelligence and adaptive learning technologies, Persistent fragmentation in digital pedagogy and curriculum quality control
-
-
Who are the major players in the K-12 Instruction Material Market?
-
Amplify Education Inc., ClassDojo Inc, Curriculum Associates LLC, Discovery Education Inc., Edmentum Inc., Extramarks Education Pvt. Ltd., Houghton Mifflin Harcourt Co., Imagine Learning LLC, IXL Learning Inc., Kahoot, McGraw Hill LLC, Nearpod Inc., NextEducation India Pvt. Ltd., Pearson Plc, Renaissance Learning Inc, Savvas Learning Co. LLC, Scholastic Corp., Think and Learn Pvt. Ltd., Toppr Technologies Pvt. Ltd. and Vedantu Innovations Pvt. Ltd.
-
Market Research Insights
- The market is defined by a rapid evolution toward digital-first educational resources and personalized learning software. The adoption of curriculum-as-a-service models and online learning platforms is accelerating, with data-driven decision-making becoming standard practice. For instance, implementing adaptive instruction technology has improved foundational literacy skills, boosting proficiency by up to 20%.
- Similarly, leveraging student engagement platforms with multimedia-rich content has correlated with a 15% increase in student participation. These instructional management systems reduce dependency on digital textbook alternatives and integrate classroom engagement tools that automate teacher administrative tools.
- This focus on educational technology integration, supported by professional development for educators, ensures that institutions can meet diverse learner needs effectively through inclusive curriculum design and differentiated instruction strategies.
We can help! Our analysts can customize this k-12 instruction material market research report to meet your requirements.
 RIA -
RIA - 
