Southeast Asia Laboratory Water Purifier Market Size 2025-2029
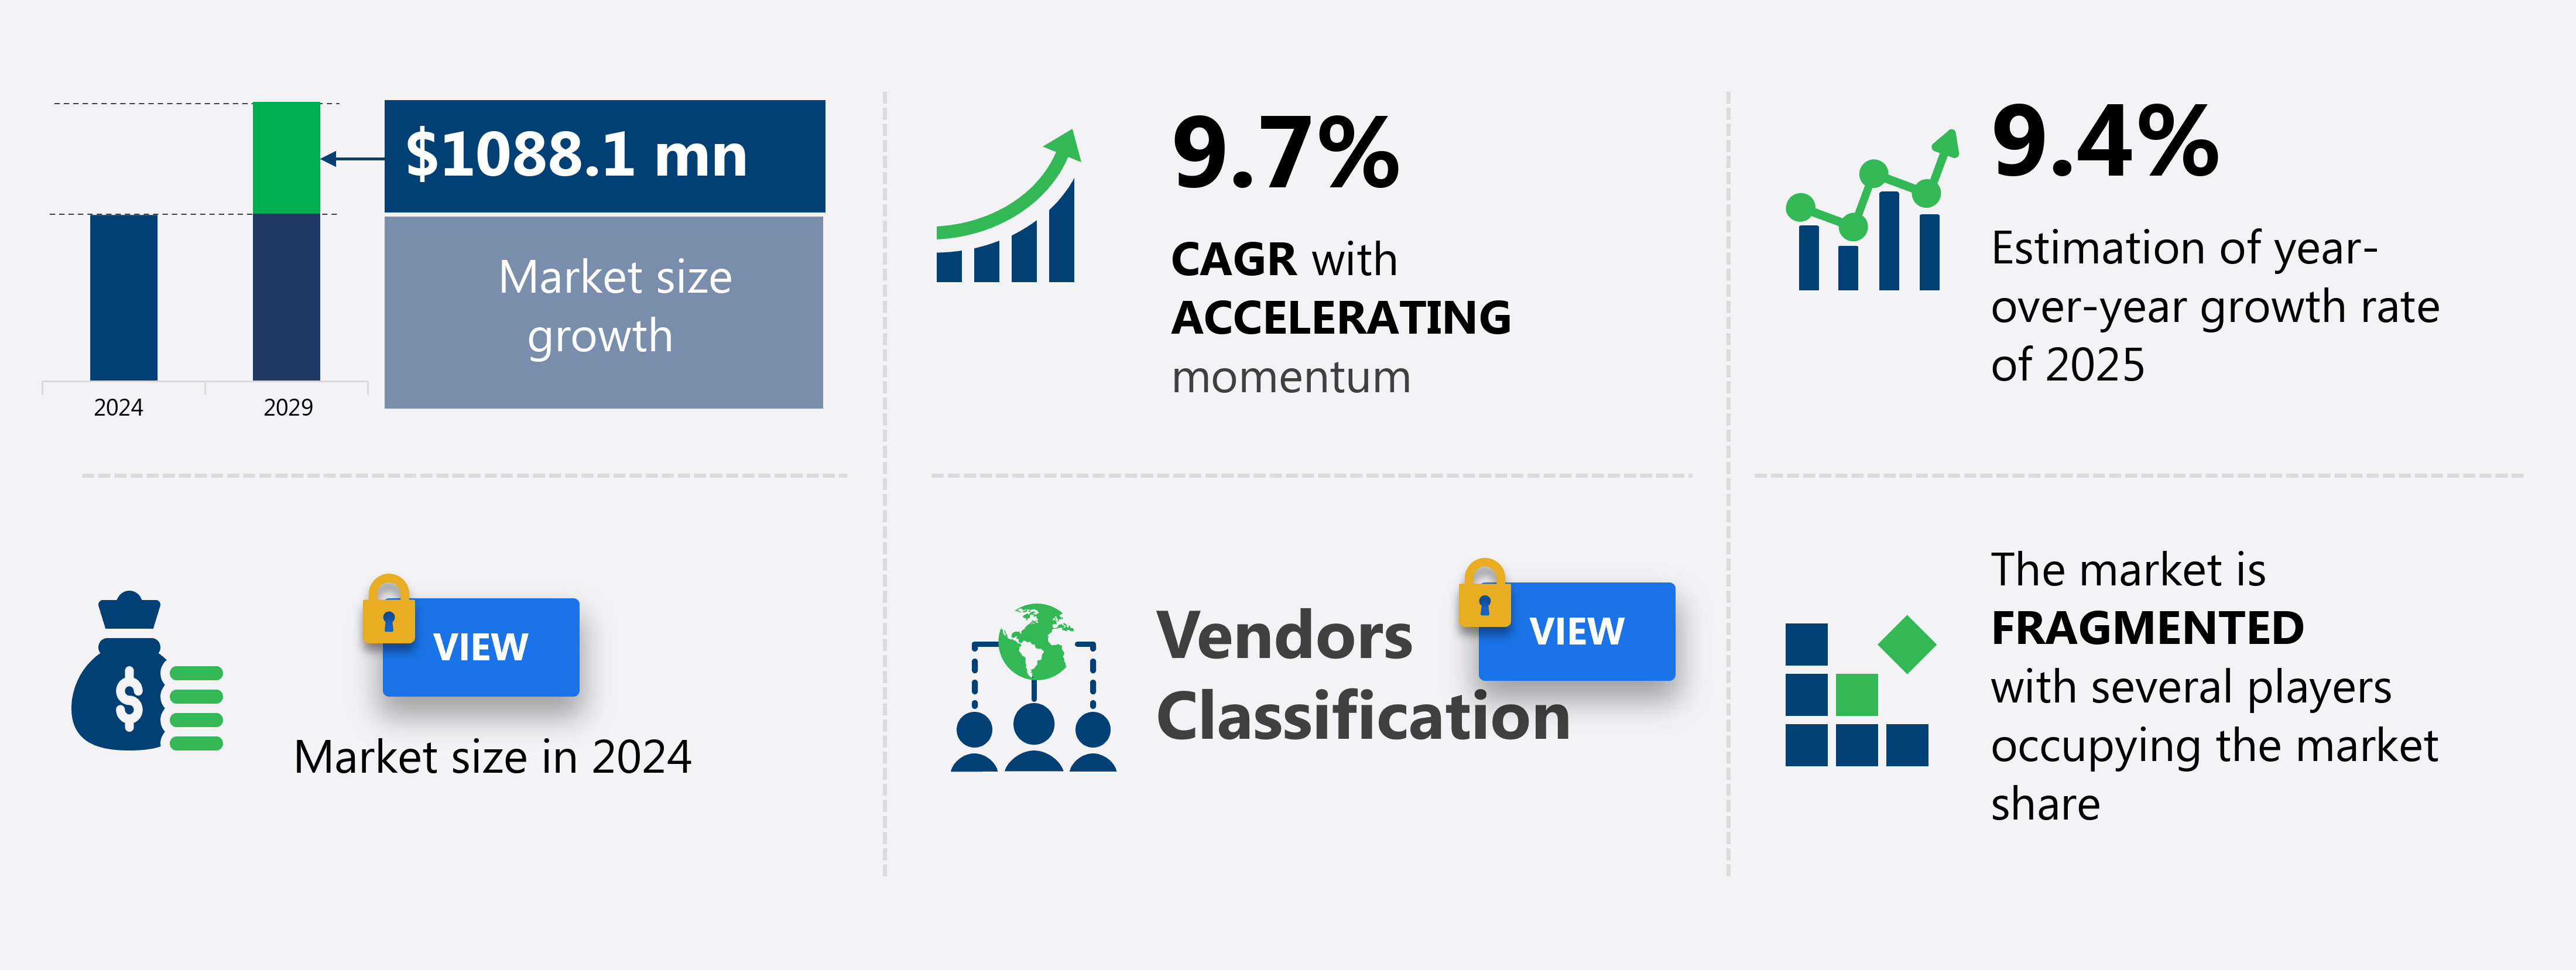
The southeast asia laboratory water purifier market size is forecast to increase by USD 1.09 billion at a CAGR of 9.7% between 2024 and 2029.
- The market is witnessing significant growth, driven by the implementation of innovative technologies and new product launches. Laboratory water purifiers are increasingly becoming essential in research and diagnostic facilities to ensure the production of high-quality water for critical experiments and tests. The growing applications of these purifiers in various industries, including pharmaceuticals, biotechnology, and academia, are fueling market expansion. However, the market faces challenges that require careful consideration. The lack of accessibility and affordability of diagnostic tests remains a significant obstacle. In many Southeast Asian countries, limited resources and infrastructure hinder the widespread adoption of laboratory water purifiers.
- Additionally, the high cost of these systems can be a barrier for smaller laboratories and research institutions. Companies seeking to capitalize on market opportunities must address these challenges by offering affordable and accessible solutions. Collaborating with local governments and organizations to provide subsidies or financing options could help make laboratory water purifiers more accessible to a broader range of customers. Innovative business models, such as rental or leasing schemes, could also help reduce the upfront cost for laboratories. By addressing these challenges, companies can effectively navigate the market landscape and tap into the significant growth potential of the market.
What will be the size of the Southeast Asia Laboratory Water Purifier Market during the forecast period?
Explore in-depth regional segment analysis with market size data - historical 2019-2023 and forecasts 2025-2029 - in the full report.
Request Free Sample
- In Southeast Asia's laboratory water purifier market, water purification capacity is a significant factor driving market growth. Purified water applications in research, pharmaceuticals, and biotechnology sectors necessitate high-efficiency water treatment systems. Predictive maintenance and data acquisition systems enable early detection of potential issues, reducing operational downtime. System automation level, chemical usage reduction, and membrane cleaning cycles contribute to improved water treatment efficiency. UV lamp replacement and filter media selection are essential for maintaining system performance and optimizing energy consumption rate. Cost-benefit analysis plays a crucial role in supplier relationships, with technical support and training programs essential for effective system operation.
- Compliance certification, safety features, system scalability, and performance optimization are key considerations for business decision-makers in this market. Wastewater recycling and remote diagnostics are emerging trends, with system validation protocols ensuring quality control checks and ensuring system reliability. Supplier relationships, maintenance schedules, and technical support are essential for ensuring system longevity and minimizing operational costs.
How is this market segmented?
The market research report provides comprehensive data (region-wise segment analysis), with forecasts and estimates in "USD million" for the period 2025-2029, as well as historical data from 2019-2023 for the following segments.
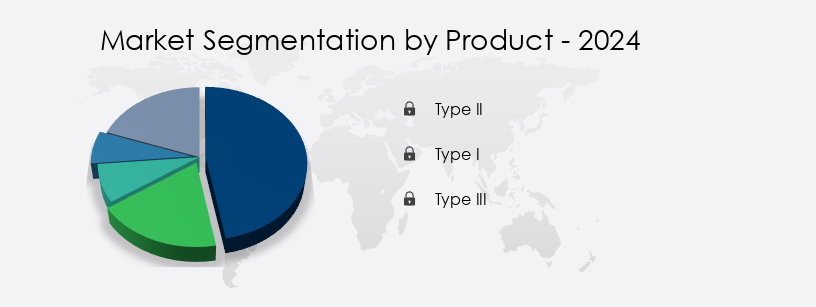
- Product
- Type II
- Type I
- Type III
- End-user
- Healthcare
- Research organizations and institutes
- Others
- Usage
- Point of use systems
- Large central systems
- Clinical analyzers
- Application
- Chromatography
- Spectrometry
- Clinical biochemistry analysis
- Cell and tissue cultures
- Others
- Geography
- APAC
- Indonesia
- Singapore
- Thailand
- Vietnam
- APAC
By Product Insights
The type ii segment is estimated to witness significant growth during the forecast period.
In the dynamic laboratory water purification market in Southeast Asia, various technologies are employed to meet the stringent requirements of Type II water, used primarily for laboratory applications and certain clinical analyzers. Ultraviolet sterilization ensures microbial contamination is eliminated, while remote monitoring enables real-time system checks. Reverse osmosis systems filter out total dissolved solids, and ultrafiltration membranes prevent particle contamination. System automation streamlines filter cartridge replacement and pressure gauge monitoring, while conductivity measurement ensures water purity. Pre-treatment filtration removes impurities before the main purification process, which can include distillation or deionization technology. Post-treatment polishing further refines water quality, addressing membrane fouling and maintaining consistent flow rate and pump performance.
Energy efficiency is a crucial consideration, with data logging facilitating wastewater management and alarm systems providing early warning of potential issues. Regulatory compliance is essential, with water quality standards rigorously enforced. Regular system maintenance, including sanitization procedures, is necessary to maintain water purity and extend the life of components such as ion exchange resin. Chemical oxidation and water purity testing are integral parts of the water purification process, ensuring the highest level of purity for laboratory applications.
The Type II segment was valued at USD million in 2019 and showed a gradual increase during the forecast period.
Market Dynamics
Our researchers analyzed the data with 2024 as the base year, along with the key drivers, trends, and challenges. A holistic analysis of drivers will help companies refine their marketing strategies to gain a competitive advantage.
What are the Southeast Asia Laboratory Water Purifier Market market drivers leading to the rise in adoption of the Industry?
- The implementation of innovative laboratory water purification technologies and the introduction of new product offerings in this market segment are primary growth drivers.
- The market is experiencing significant growth due to the increasing demand for high-purity water in scientific research and industrial applications. Companies are investing in advanced technologies such as deionization, water softener systems, and wastewater management to produce superior quality water. Merck KGaA's Milli-Q IQ 7000 system is an example of innovative technology in the market. This system offers features like a high-definition digital touchscreen, smaller purification cartridges, energy-saving hibernation mode, data logging, and mercury-free UV lamps for organic contaminant removal.
- Additionally, system maintenance is facilitated through easy resistivity testing and the use of ion exchange resin. Alarm systems ensure uninterrupted water production, making these purifiers an essential investment for laboratories. With a focus on energy efficiency and reliable performance, these water purifiers are a valuable addition to any laboratory setting.
What are the Southeast Asia Laboratory Water Purifier Market market trends shaping the Industry?
- The use of laboratory water purifiers is increasingly becoming a market trend due to their growing applications. Two lines: 1. The demand for laboratory water purifiers is escalating, driven by their expanding utilization in various scientific and research applications. 2. This trend reflects the importance of ensuring the highest purity standards in laboratory water for accurate and reliable experimental results.
- The market is experiencing significant growth due to the increasing demand for water purification in various industries. These industries include analytical chemistry, clinical analysis, environmental testing, food and beverage analysis, forensic analysis, life science research, material characterization and research, petrochemical testing, and pharmaceutical analysis. In these applications, water purifiers play a crucial role, ensuring regulatory compliance and maintaining high water quality standards through sanitization procedures and water purification processes such as chemical oxidation and water quality testing. For instance, in gas chromatography-mass spectrometry (GC-MS), purified water is essential for preparing blanks, standards, and sample pre-treatments. The importance of water purity in GC-MS cannot be overstated, as it significantly impacts the sensitivity of the analysis.
- Operating costs are a critical consideration for laboratories, making service contracts an attractive option for maintaining water purifiers and ensuring continuous, reliable operation. In conclusion, the market is a vital component of various industries, providing solutions for maintaining water purity and ensuring regulatory compliance. With the increasing demand for water purification and the introduction of advanced technologies, the market is poised for continued growth.
How does Southeast Asia Laboratory Water Purifier Market market faces challenges face during its growth?
- The diagnostic industry's growth is hindered by the lack of accessibility and affordability of tests, presenting a significant challenge.
- In Southeast Asia, the demand for laboratory water purifiers is driven by the need for reliable water sources for scientific research and diagnostic testing in healthcare facilities. However, the affordability and accessibility challenges in developing countries hinder the market growth. The use of advanced technologies such as ultraviolet sterilization, reverse osmosis systems, distillation method, ultrafiltration membranes, and system automation in laboratory water purifiers enhances water quality and reduces contamination. Remote monitoring and filter cartridge replacement systems ensure continuous operation and minimize downtime. Toc analysis and pressure gauge monitoring provide real-time data on water quality and system performance.
- Despite these benefits, the market growth is constrained by the lack of diagnostic tests and the resulting low adoption rates of laboratory water purifiers in developing nations. The need for evidence-based treatment and efficient disease management necessitates the adoption of laboratory water purifiers, making it a significant investment for healthcare facilities and research institutions in the region.
Exclusive Southeast Asia Laboratory Water Purifier Market Customer Landscape
The market forecasting report includes the adoption lifecycle of the market, covering from the innovator’s stage to the laggard’s stage. It focuses on adoption rates in different regions based on penetration. Furthermore, the report also includes key purchase criteria and drivers of price sensitivity to help companies evaluate and develop their market growth analysis strategies.
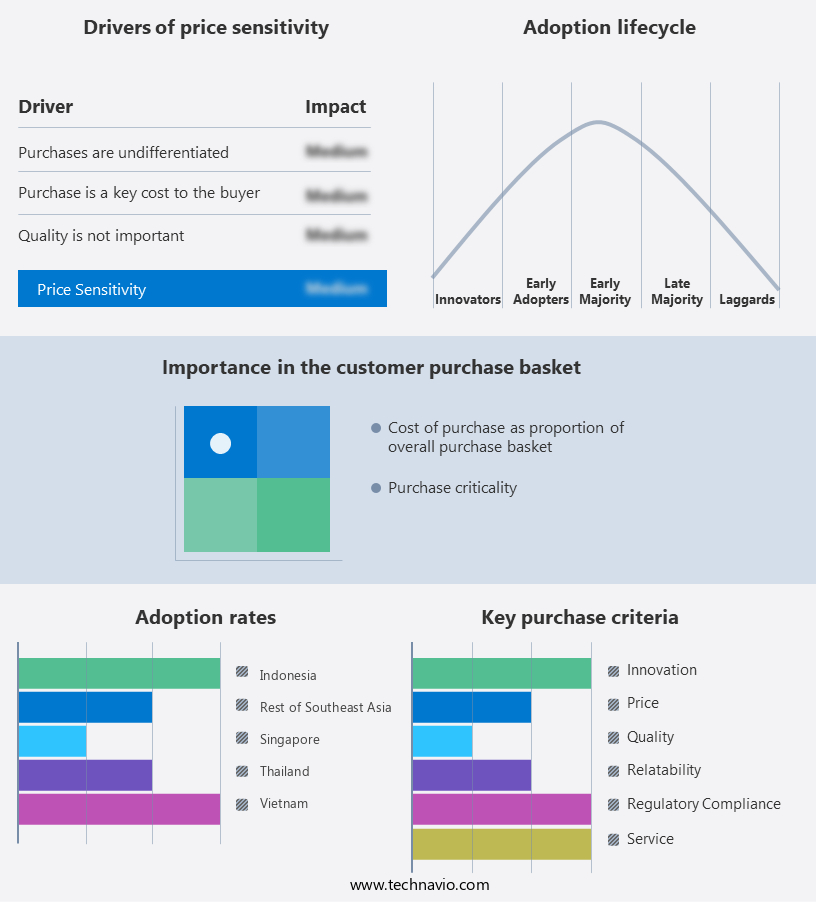
Customer Landscape
Key Companies & Market Insights
Companies are implementing various strategies, such as strategic alliances, market forecast partnerships, mergers and acquisitions, geographical expansion, and product/service launches, to enhance their presence in the market.
The market research and growth report includes detailed analyses of the competitive landscape of the market and information about key companies, including:
- Biobase Biodusty Shandong Co. Ltd.
- Biosan
- Coway Co. Ltd.
- DAIHAN Scientific Co. Ltd.
- Esco Micro Pte Ltd.
- IT Technologies Pte Ltd.
- Labconco Corp.
- Merck KGaA
- Pall Corp.
- Pure Aqua Inc.
- Sartorius AG
- SPT Instrument Co. Ltd.
- Thermo Fisher Scientific Inc.
- Veolia Environnement SA
- Xylem Inc.
- Yamato Scientific Co. Ltd.
Qualitative and quantitative analysis of companies has been conducted to help clients understand the wider business environment as well as the strengths and weaknesses of key market players. Data is qualitatively analyzed to categorize companies as pure play, category-focused, industry-focused, and diversified; it is quantitatively analyzed to categorize companies as dominant, leading, strong, tentative, and weak.
Recent Development and News in Laboratory Water Purifier Market In Southeast Asia
- In January 2024, Merck KGaA, a leading life science and healthcare company, announced the launch of its new laboratory water purification system, AQUASOLV Q series, in Southeast Asia. This system offers superior water quality and ease of use, addressing the growing demand for advanced water purification solutions in the region's research and biotech industries (Merck KGaA Press Release).
- In March 2024, Thermo Fisher Scientific, a global biotech company, entered into a strategic partnership with PT. Indah Water, an Indonesian water treatment solutions provider. The collaboration aimed to offer integrated laboratory water purification services, combining Thermo Fisher Scientific's expertise in laboratory water systems with PT. Indah Water's local market knowledge and distribution network (Thermo Fisher Scientific Press Release).
- In May 2024, Veolia Water Technologies, a global water technology company, secured a significant contract to provide water treatment solutions to a major pharmaceutical company in Malaysia. The project included the installation of laboratory water purification systems, further strengthening Veolia's presence in the Southeast Asian market (Veolia Water Technologies Press Release).
- In April 2025, the Singaporean Agency for Science, Technology and Research (A*STAR) and the National University of Singapore (NUS) jointly announced the development of a new membrane technology for water purification. This innovation could significantly improve the efficiency and cost-effectiveness of laboratory water purification systems in the Southeast Asian market (A*STAR Press Release).
Research Analyst Overview
The market continues to evolve, driven by the increasing demand for high-purity water in various sectors. The market dynamics are shaped by ongoing advancements in technology, regulatory requirements, and industry trends. Operating costs remain a significant consideration for laboratories, leading to the adoption of energy-efficient systems, such as reverse osmosis and ultrafiltration, which offer cost savings through reduced water consumption and lower maintenance requirements. Remote monitoring and system automation enable real-time tracking of system performance, ensuring optimal operation and minimizing downtime. Sanitization procedure and regulatory compliance are crucial aspects of the water purification process. Regular filter cartridge replacement, conductivity measurement, and resistivity testing are essential for maintaining water quality and ensuring regulatory compliance.
Chemical oxidation techniques, such as ultraviolet sterilization, are used to eliminate microbial contamination and maintain water purity. Water quality standards continue to evolve, with total dissolved solids and total organic carbon becoming increasingly important parameters. Pre-treatment filtration and post-treatment polishing are used to remove impurities and ensure water meets the required standards. Membrane fouling and pump performance are ongoing challenges in the water purification process. Regular system maintenance, including flow rate control and pressure gauge monitoring, is essential to maintain optimal system performance and minimize downtime. Wastewater management and alarm systems are also critical components of a comprehensive water purification system.
The market for laboratory water purifiers in Southeast Asia is characterized by continuous innovation and evolving patterns. Deionization technology, data logging, and wastewater management are emerging trends, offering opportunities for growth and improvement in the market. The market is expected to remain dynamic, with ongoing advancements in technology, regulatory requirements, and industry trends shaping its future.
Dive into Technavio’s robust research methodology, blending expert interviews, extensive data synthesis, and validated models for unparalleled Laboratory Water Purifier Market in Southeast Asia insights. See full methodology.
|
Market Scope |
|
|
Report Coverage |
Details |
|
Page number |
227 |
|
Base year |
2024 |
|
Historic period |
2019-2023 |
|
Forecast period |
2025-2029 |
|
Growth momentum & CAGR |
Accelerate at a CAGR of 9.7% |
|
Market growth 2025-2029 |
USD 1088.1 million |
|
Market structure |
Fragmented |
|
YoY growth 2024-2025(%) |
9.4 |
|
Competitive landscape |
Leading Companies, Market Positioning of Companies, Competitive Strategies, and Industry Risks |
What are the Key Data Covered in this Market Research Report?
- CAGR of the market during the forecast period
- Detailed information on factors that will drive the market growth and forecasting between 2025 and 2029
- Precise estimation of the size of the market and its contribution of the market in focus to the parent market
- Accurate predictions about upcoming market growth and trends and changes in consumer behaviour
- Growth of the market across Southeast Asia
- Thorough analysis of the market’s competitive landscape and detailed information about companies
- Comprehensive analysis of factors that will challenge the growth of market companies
We can help! Our analysts can customize this market research report to meet your requirements Get in touch
 RIA -
RIA - 
