Water Softener Market Size 2026-2030
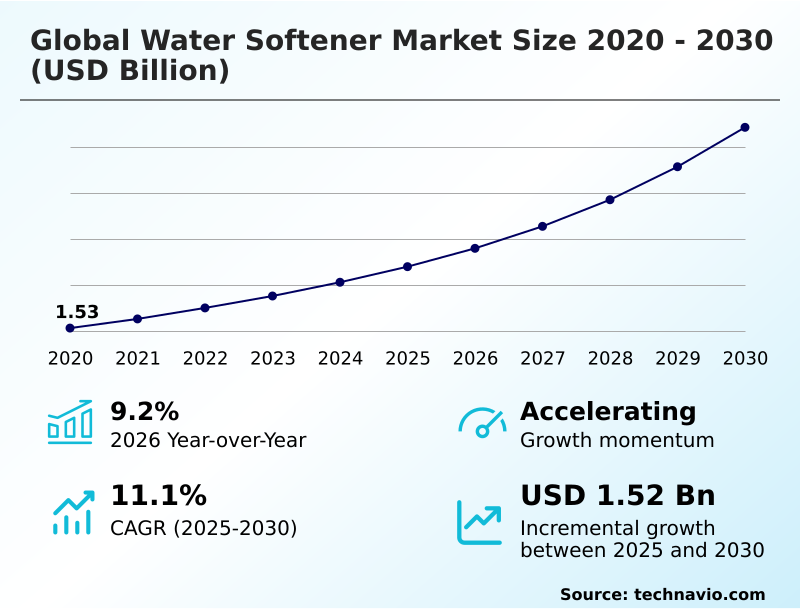
The water softener market size is valued to increase by USD 1.52 billion, at a CAGR of 11.1% from 2025 to 2030. Growing consumer awareness about water softening products will drive the water softener market.
Major Market Trends & Insights
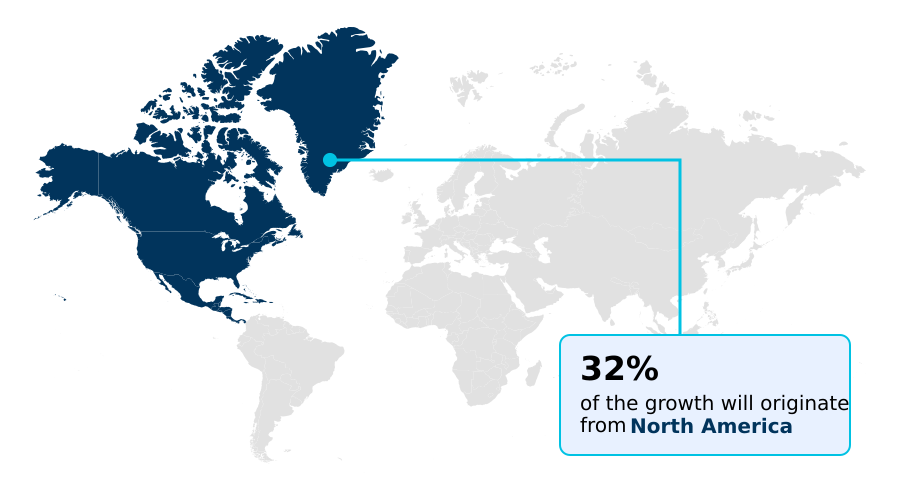
- North America dominated the market and accounted for a 31.8% growth during the forecast period.
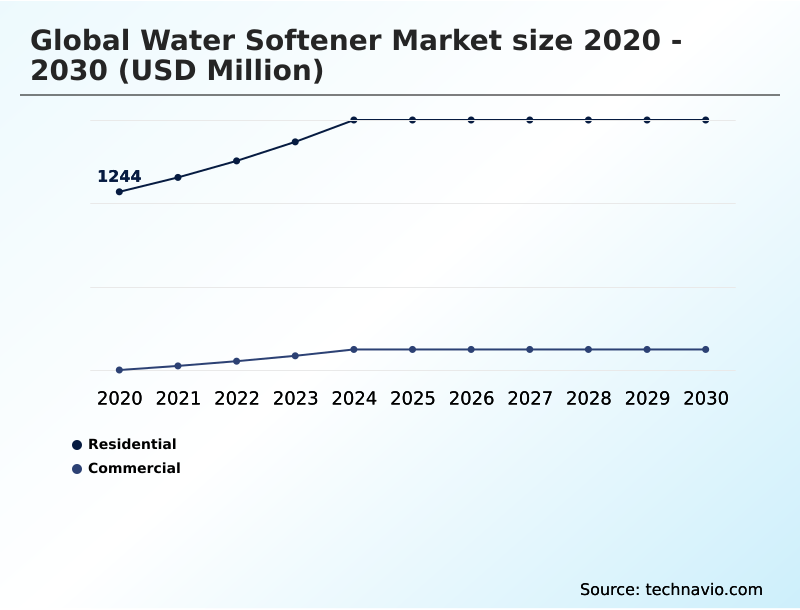
- By End-user - Residential segment was valued at USD 1.63 billion in 2024
- By Product - Salt-based segment accounted for the largest market revenue share in 2024
Market Size & Forecast
- Market Opportunities: USD 2.19 billion
- Market Future Opportunities: USD 1.52 billion
- CAGR from 2025 to 2030 : 11.1%
Market Summary
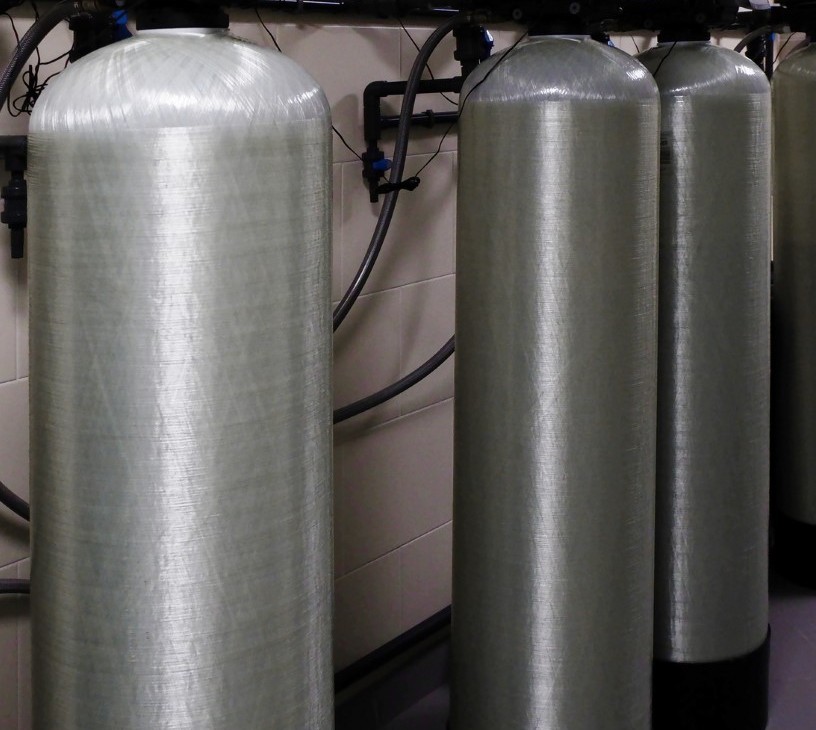
- The water softener market is defined by a continuous drive for efficiency and sustainability in water quality management for households and industries. Key advancements center on optimizing the classic ion exchange process with technologies like demand initiated regeneration and counter current regeneration, which significantly reduce salt and water waste. This addresses longstanding environmental concerns over brine discharge.
- Concurrently, the rise of salt-free water conditioner technology, such as template assisted crystallization, offers an alternative focused on mineral scale prevention without altering water chemistry. For businesses, adopting modern commercial water softening is critical; in a hospitality setting, for instance, it ensures equipment longevity and consistent service quality, directly impacting operational costs.
- The market is further shaped by the integration of smart features, including iot integration and remote diagnostics capability, transitioning systems from standalone hardware to connected components of a broader digital water management ecosystem. This evolution caters to both residential demand for convenience and industrial requirements for stringent water quality control.
What will be the Size of the Water Softener Market during the forecast period?
Get Key Insights on Market Forecast (PDF) Get Free Sample
How is the Water Softener Market Segmented?
The water softener industry research report provides comprehensive data (region-wise segment analysis), with forecasts and estimates in "USD million" for the period 2026-2030, as well as historical data from 2020-2024 for the following segments.
- End-user
- Residential
- Commercial
- Product
- Salt-based
- Salt-free
- Distribution channel
- Offline
- Online
- Geography
- North America
- US
- Canada
- Mexico
- Europe
- Germany
- UK
- France
- APAC
- China
- Japan
- India
- South America
- Brazil
- Argentina
- Colombia
- Middle East and Africa
- Saudi Arabia
- UAE
- South Africa
- Rest of World (ROW)
- North America
By End-user Insights
The residential segment is estimated to witness significant growth during the forecast period.
The residential sector is advancing with the adoption of the point of entry system for whole house water softener applications, driven by a desire for appliance lifespan extension and improved water quality.
Innovations in compact water softener design make these systems suitable for diverse housing types. Homeowners increasingly favor solutions offering high-efficiency salt usage and effective limescale buildup prevention.
The integration of smart water softener connectivity enables water consumption monitoring and simplifies maintenance, with some connected systems reducing unscheduled service calls by over 15%.
A focus on residential water treatment solutions also addresses hard water effects on skin, supporting both asset protection and personal wellness, while demand for septic safe water softeners is growing.
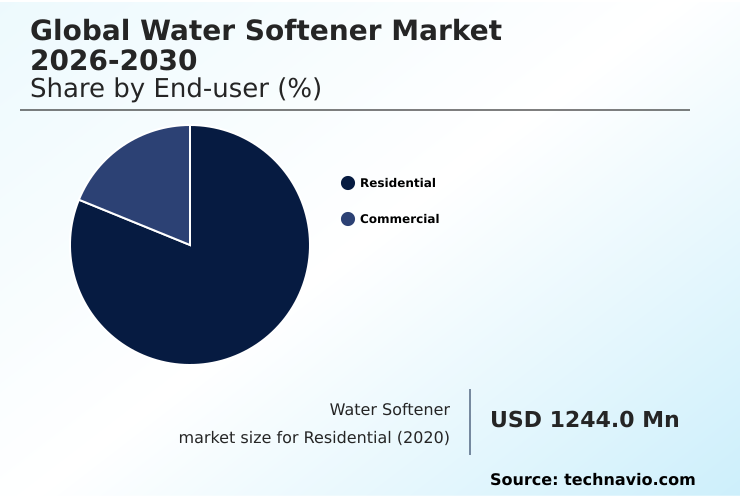
The Residential segment was valued at USD 1.63 billion in 2024 and showed a gradual increase during the forecast period.
Regional Analysis
North America is estimated to contribute 31.8% to the growth of the global market during the forecast period.Technavio’s analysts have elaborately explained the regional trends and drivers that shape the market during the forecast period.
See How Water Softener Market Demand is Rising in North America Get Free Sample
The market's geographic landscape is diverse, with North America accounting for 31.8% of the incremental growth, driven by high awareness of hard water effects.
The region sees strong demand for both residential water treatment solutions and industrial water quality control systems.
In APAC, which exhibits an expansion rate nearing 12%, rapid urbanization is fueling the need for effective water softener for well water applications and compact systems.
Meanwhile, European regulations are accelerating the adoption of systems with enhanced wastewater discharge management capabilities and eco-friendly water conditioning.
Across regions, there is a clear trend toward solutions that improve water quality improvement and offer a better user experience, with non-electric water softeners gaining traction in off-grid applications.
Market Dynamics
Our researchers analyzed the data with 2025 as the base year, along with the key drivers, trends, and challenges. A holistic analysis of drivers will help companies refine their marketing strategies to gain a competitive advantage.
- Strategic decisions in the water treatment industry are increasingly influenced by a nuanced understanding of system performance and environmental impact. A key consideration is the debate over salt-based vs salt-free water softeners, where the latter's effectiveness in preventing limescale buildup in appliances is a major selling point.
- For traditional systems, the benefits of demand initiated regeneration are clear, as it is crucial for reducing water consumption during regeneration. The total cost of ownership for water softeners is a critical metric for both residential and commercial buyers, where high efficiency water softener advantages, including lower salt usage, deliver measurable returns.
- Furthermore, iot integration in water softener systems provides smart water softener remote monitoring benefits, a feature that improves maintenance scheduling. Industrial applications for water softening require robust commercial water softener system maintenance protocols to ensure uptime. For homeowners, understanding the water softener impact on septic systems and choosing a water softener for well water are common concerns.
- Effective water quality management for households also includes weighing the benefits of soft water for skin care against the impact of hard water on plumbing. As technology advances, troubleshooting common water softener issues becomes simpler with better water softener control valve technology and accessible residential point of entry water treatment information, mitigating the environmental effects of brine discharge.
What are the key market drivers leading to the rise in the adoption of Water Softener Industry?
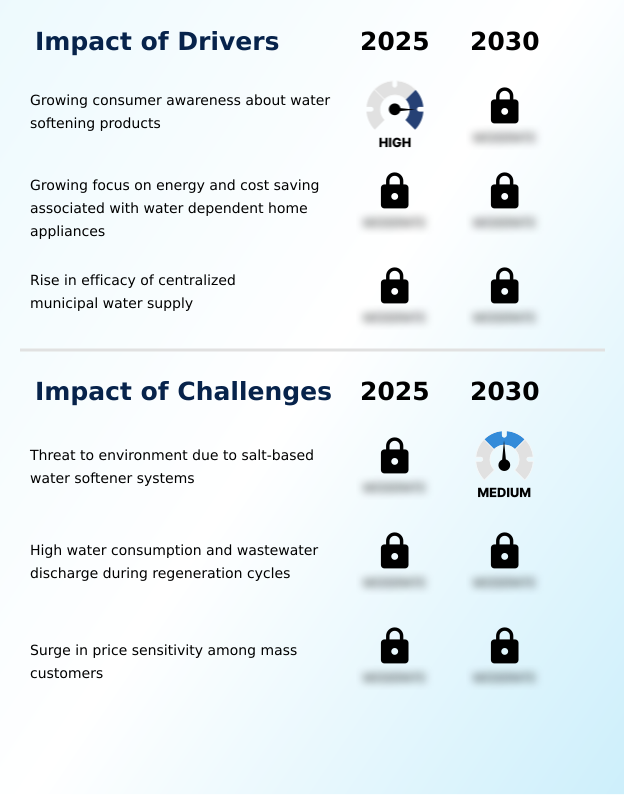
- Growing consumer awareness regarding the benefits of water softening products, such as appliance protection and improved personal hygiene, is a key driver for market expansion.
- Market growth is significantly driven by increasing consumer and commercial demand for asset protection and operational efficiency.
- The need for appliance lifespan extension is a primary motivator, as systems offering effective scale prevention technology can reduce appliance repair incidents by over 30%. Growing awareness of the hard water effects on skin is also fueling residential adoption.
- In commercial settings, the drive for reducing the total cost of ownership is paramount, with modern systems delivering tangible returns through lower maintenance and energy use.
- The demand for reliable water softener maintenance and improved water quality improvement is pushing the industry toward more advanced and user-friendly solutions.
- This trend has led to a 15% year-over-year increase in inquiries for whole house water softener installations in new residential constructions.
What are the market trends shaping the Water Softener Industry?
- The emergence of recent technological advances in water softeners is a prominent market trend. These innovations focus on enhancing system efficiency, user connectivity, and sustainability.
- Key market trends are centered on smart technology and sustainability, fundamentally altering system design and user interaction. The adoption of intelligent valve technology and smart home integration is accelerating, with systems now capable of real-time water quality monitoring.
- This shift toward digital water management enables features like automated regeneration cycles, which can reduce salt consumption by up to 25% compared to traditional models. Furthermore, the growing demand for eco-friendly water conditioning is driving innovation in salt-free technologies and systems with superior water-efficient regeneration processes.
- The development of dual tank water softener models ensures an uninterrupted supply of soft water, a critical feature for commercial applications, improving operational reliability by nearly 100%. These advancements collectively enhance performance and user convenience.
What challenges does the Water Softener Industry face during its growth?
- The environmental threat posed by brine discharge from traditional salt-based water softener systems presents a key challenge affecting industry growth and prompting regulatory scrutiny.
- The primary market challenge is mitigating the environmental impact of brine, which places pressure on manufacturers to innovate. Concerns over brine discharge are leading to stricter local regulations, compelling a shift toward high-efficiency systems or salt-free alternatives.
- The operational complexity of some units creates a need for simplified water softener maintenance, as improper upkeep can increase wastewater by up to 20%. Furthermore, the upfront cost of advanced systems and the public perception of water softeners as non-essential can hinder adoption. Effectively managing the wastewater discharge management process without compromising performance remains a key technical hurdle.
- Addressing the environmental impact of brine is critical, as failure to do so could lead to outright bans on certain technologies in sensitive watersheds, affecting market access.
Exclusive Technavio Analysis on Customer Landscape
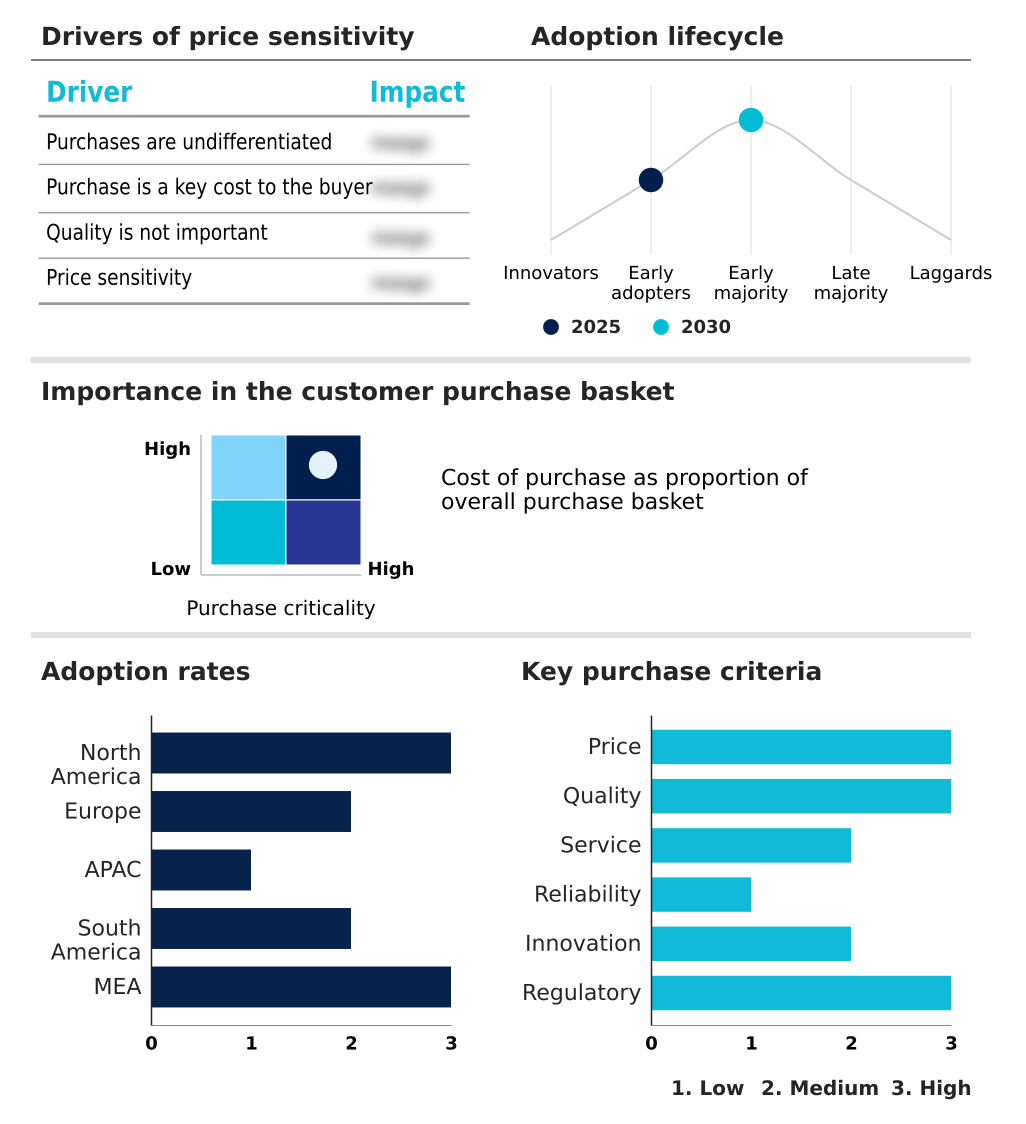
The water softener market forecasting report includes the adoption lifecycle of the market, covering from the innovator’s stage to the laggard’s stage. It focuses on adoption rates in different regions based on penetration. Furthermore, the water softener market report also includes key purchase criteria and drivers of price sensitivity to help companies evaluate and develop their market growth analysis strategies.
Customer Landscape of Water Softener Industry
Competitive Landscape
Companies are implementing various strategies, such as strategic alliances, water softener market forecast, partnerships, mergers and acquisitions, geographical expansion, and product/service launches, to enhance their presence in the industry.
3M Co. - Offerings focus on advanced water softening solutions to prevent mineral-related congestion, narrowing, and puncturing in plumbing and appliances, thereby enhancing system longevity and performance.
The industry research and growth report includes detailed analyses of the competitive landscape of the market and information about key companies, including:
- 3M Co.
- A. O. Smith Corp.
- BWT Holding GmbH
- Canature Water Group
- Coway Co. Ltd.
- Culligan International Co.
- Grundfos Holding AS
- Ion Exchange India Ltd.
- Kinetico Inc.
- Marlo Inc.
- Marmon Holdings Inc.
- NuvoH20 LLC
- Pentair Plc
- Puretec Pty Ltd.
- Watts Water Technologies Inc.
- Whirlpool Corp.
Qualitative and quantitative analysis of companies has been conducted to help clients understand the wider business environment as well as the strengths and weaknesses of key industry players. Data is qualitatively analyzed to categorize companies as pure play, category-focused, industry-focused, and diversified; it is quantitatively analyzed to categorize companies as dominant, leading, strong, tentative, and weak.
Recent Development and News in Water softener market
- In May 2025, Kinetico introduced its Kinetico AI Pro line, focusing on AI-driven remote monitoring and predictive maintenance capabilities for both residential and commercial users to extend equipment life and deliver real-time insights.
- In April 2025, Pentair launched its AI-enabled SmartSoft Series for residential and light commercial use, which incorporates predictive regeneration and allows remote monitoring via a mobile application to improve system reliability.
- In March 2025, Culligan International announced the launch of its Smart Water Softener Platform, featuring connected monitoring and adaptive regeneration cycles to enhance user experience and operational efficiency.
- In February 2025, GE Appliances Air and Water Solutions introduced the GE Profile Professional Smart Valve Water Softener, featuring intelligent valve technology and smart connectivity for optimized water and salt usage.
Dive into Technavio’s robust research methodology, blending expert interviews, extensive data synthesis, and validated models for unparalleled Water Softener Market insights. See full methodology.
| Market Scope | |
|---|---|
| Page number | 289 |
| Base year | 2025 |
| Historic period | 2020-2024 |
| Forecast period | 2026-2030 |
| Growth momentum & CAGR | Accelerate at a CAGR of 11.1% |
| Market growth 2026-2030 | USD 1520.8 million |
| Market structure | Fragmented |
| YoY growth 2025-2026(%) | 9.2% |
| Key countries | US, Canada, Mexico, Germany, UK, France, Italy, Spain, The Netherlands, China, Japan, India, South Korea, Australia, Indonesia, Brazil, Argentina, Colombia, Saudi Arabia, UAE, South Africa, Israel and Turkey |
| Competitive landscape | Leading Companies, Market Positioning of Companies, Competitive Strategies, and Industry Risks |
Research Analyst Overview
- The water softener market is undergoing a significant technological transformation focused on efficiency, sustainability, and intelligent operation. Core to this evolution is the refinement of the ion exchange process through advanced ion exchange resin and high capacity resin materials, which enhance performance.
- Innovations like demand initiated regeneration and counter current regeneration are becoming standard, governed by a sophisticated salt dosage algorithm to optimize high-efficiency salt usage and minimize waste. This directly addresses the critical challenge of brine discharge and its associated chloride ion contamination, improving wastewater discharge management.
- For residential water treatment, the point of entry system remains dominant, but the integration of a smart control valve with iot integration is reshaping user interaction through predictive maintenance alerts and salt level alerts. This smart water softener trend enables remote diagnostics capability and supports sustainable water management.
- In parallel, the salt-free water conditioner segment, utilizing template assisted crystallization, offers an alternative for mineral scale prevention and eco-friendly water conditioning. Commercial water softening and industrial water quality systems benefit from these advancements, where connected water treatment and digital water management are essential for operational continuity.
- The inclusion of a fine mesh resin in the resin bed of some systems enhances filtration, while features like automated regeneration cycles and smart home integration offer unprecedented convenience. One notable outcome is that companies leveraging these technologies have reported up to a 25% reduction in annual maintenance costs.
What are the Key Data Covered in this Water Softener Market Research and Growth Report?
-
What is the expected growth of the Water Softener Market between 2026 and 2030?
-
USD 1.52 billion, at a CAGR of 11.1%
-
-
What segmentation does the market report cover?
-
The report is segmented by End-user (Residential, and Commercial), Product (Salt-based, and Salt-free), Distribution Channel (Offline, and Online) and Geography (North America, Europe, APAC, South America, Middle East and Africa)
-
-
Which regions are analyzed in the report?
-
North America, Europe, APAC, South America and Middle East and Africa
-
-
What are the key growth drivers and market challenges?
-
Growing consumer awareness about water softening products, Threat to environment due to salt-based water softener systems
-
-
Who are the major players in the Water Softener Market?
-
3M Co., A. O. Smith Corp., BWT Holding GmbH, Canature Water Group, Coway Co. Ltd., Culligan International Co., Grundfos Holding AS, Ion Exchange India Ltd., Kinetico Inc., Marlo Inc., Marmon Holdings Inc., NuvoH20 LLC, Pentair Plc, Puretec Pty Ltd., Watts Water Technologies Inc. and Whirlpool Corp.
-
Market Research Insights
- Market dynamics are shaped by a strategic push toward reducing the total cost of ownership and improving user convenience. Adoption of real-time water quality monitoring allows for a 20% more accurate salt usage, while automated regeneration cycles have been shown to reduce water waste by up to 30% compared to timer-based models.
- These innovations, coupled with features like remote system monitoring and proactive salt level alerts, are enhancing the value proposition. The focus on sustainable water management is also creating demand for eco-friendly water conditioning and water-efficient regeneration technologies.
- As smart home integration becomes more prevalent, connected water treatment solutions are becoming a standard expectation, further driving market evolution away from purely mechanical systems toward intelligent, data-driven platforms.
We can help! Our analysts can customize this water softener market research report to meet your requirements.
 RIA -
RIA - 
