Language Services Market Size 2026-2030
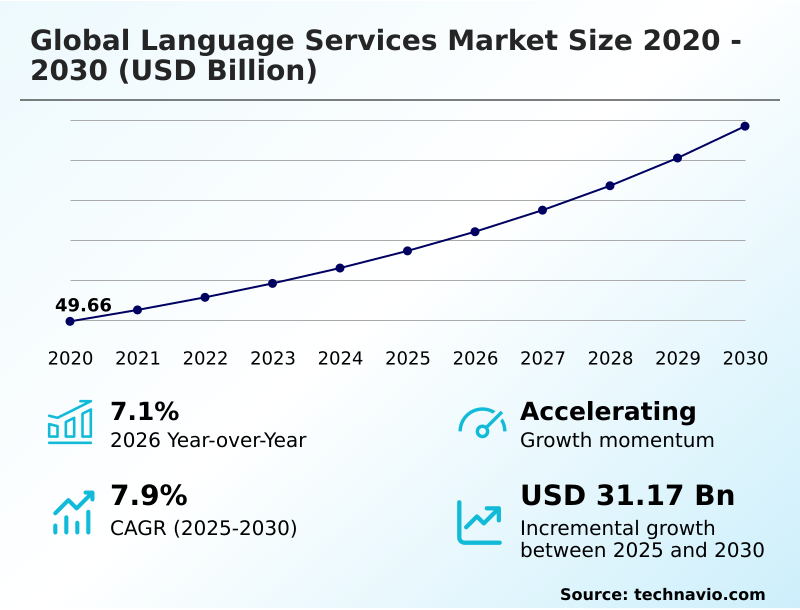
The language services market size is valued to increase by USD 31.17 billion, at a CAGR of 7.9% from 2025 to 2030. Globalization demanding localized, multilingual customer experiences will drive the language services market.
Major Market Trends & Insights
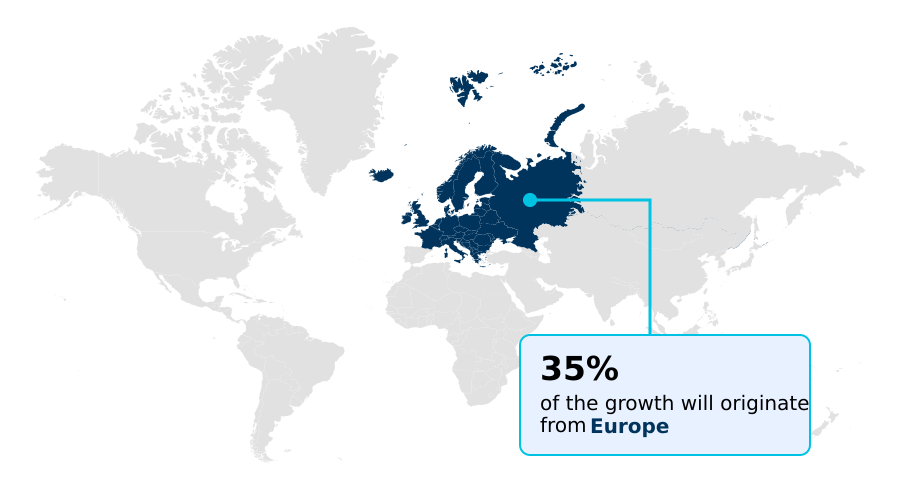
- Europe dominated the market and accounted for a 34.9% growth during the forecast period.
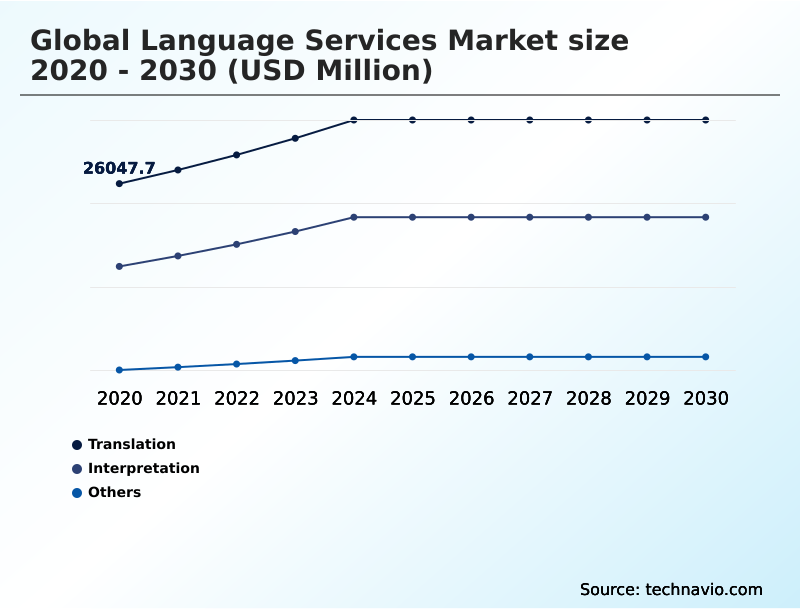
- By Service - Translation segment was valued at USD 32.78 billion in 2024
- By End-user - Healthcare segment accounted for the largest market revenue share in 2024
Market Size & Forecast
- Market Opportunities: USD 48.79 billion
- Market Future Opportunities: USD 31.17 billion
- CAGR from 2025 to 2030 : 7.9%
Market Summary
- The language services market facilitates cross-cultural communication through a suite of professional solutions including translation, interpretation, and localization. This ecosystem blends human expertise with advanced technological frameworks like neural machine translation and computer-assisted translation tools. A primary driver is globalization, compelling businesses to adopt multilingual support for omnichannel customer engagement to maintain brand consistency.
- For example, a medical device firm entering European and Asian markets must utilize certified translations for regulatory documentation and effective localization services for its device's software interface to ensure compliance and user adoption. This requires deep subject-matter expertise and robust quality assurance processes.
- The industry is also shaped by the trend of hyper-localization, where content is adapted for specific regional nuances, and the challenge of managing multimedia formats while preserving layout fidelity. As digital content expands, the integration of AI-driven solutions and automated systems becomes crucial for scaling operations and delivering seamless multilingual user experiences in the language services market.
What will be the Size of the Language Services Market during the forecast period?
Get Key Insights on Market Forecast (PDF) Get Free Sample
How is the Language Services Market Segmented?
The language services industry research report provides comprehensive data (region-wise segment analysis), with forecasts and estimates in "USD million" for the period 2026-2030, as well as historical data from 2020-2024 for the following segments.
- Service
- Translation
- Interpretation
- Others
- End-user
- Healthcare
- ICT
- BFSI
- Government
- Others
- Learning method
- Online
- Offline
- Geography
- Europe
- Germany
- UK
- France
- North America
- US
- Canada
- Mexico
- APAC
- China
- Japan
- India
- South America
- Brazil
- Argentina
- Colombia
- Middle East and Africa
- Saudi Arabia
- UAE
- South Africa
- Rest of World (ROW)
- Europe
By Service Insights
The translation segment is estimated to witness significant growth during the forecast period.
The global language services market is segmented by service, end-user, and geography. The translation segment, a core component, has evolved beyond simple text conversion. Modern workflows emphasize the integration of linguistic intelligence directly into a client's global digital infrastructure.
Advanced translation management systems now facilitate continuous localization, ensuring brand consistency across platforms. This is critical for enterprises where a unified voice is paramount. For instance, integrated digital workflows for customs documentation have enabled real-time clearance across forty nations.
This shift highlights a move toward sophisticated localization services and content transformation, where language adaptation is a strategic asset for achieving seamless cross-border communication and maintaining a competitive edge through superior multilingual user experiences and effective terminology management.
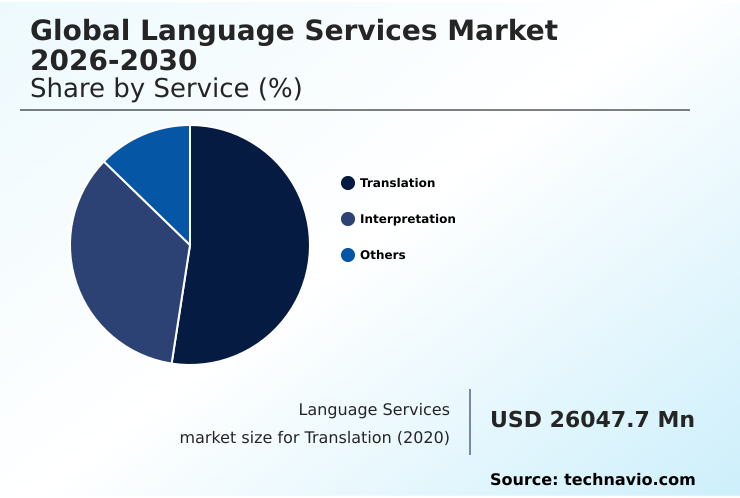
The Translation segment was valued at USD 32.78 billion in 2024 and showed a gradual increase during the forecast period.
Regional Analysis
Europe is estimated to contribute 34.9% to the growth of the global market during the forecast period.Technavio’s analysts have elaborately explained the regional trends and drivers that shape the market during the forecast period.
See How Language Services Market Demand is Rising in Europe Get Free Sample
The geographic landscape is dynamic, with Europe accounting for 34.9% of incremental growth, driven by its linguistic diversity and strong regulatory frameworks.
North America remains a mature market focused on high-tech applications and media localization, while APAC is the fastest-growing region, with a CAGR of 8.6%, fueled by digital adoption and a burgeoning e-commerce sector.
This regional expansion underscores the importance of globalization and language accessibility. Enterprises are leveraging hyper-localization and advanced localization services to navigate dialectal differences and cultural nuances.
Success in these diverse markets requires robust multilingual support and sophisticated language adaptation strategies to ensure effective cross-border communication and provide seamless multilingual user experiences to a global customer base.
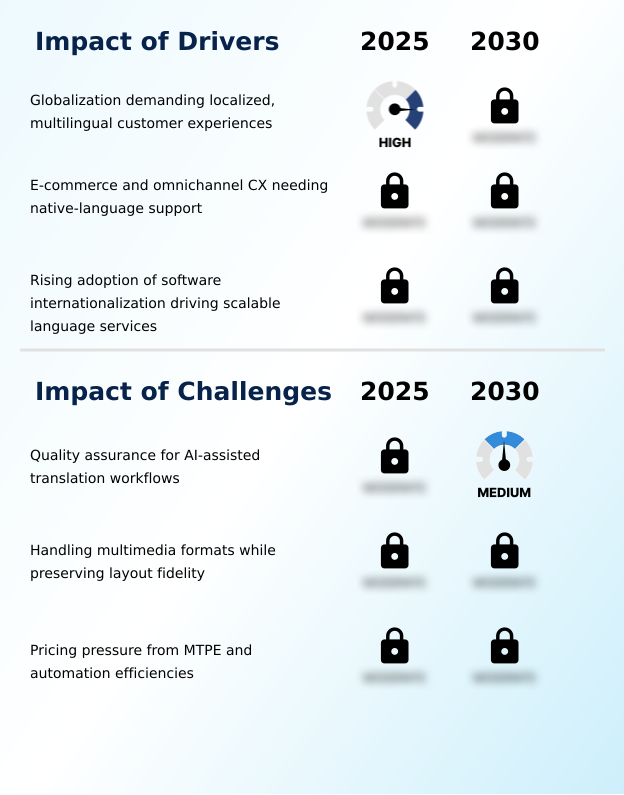
Market Dynamics
Our researchers analyzed the data with 2025 as the base year, along with the key drivers, trends, and challenges. A holistic analysis of drivers will help companies refine their marketing strategies to gain a competitive advantage.
- Strategic adoption of advanced linguistic technologies is reshaping enterprise growth, with industry expansion outpacing the 7.1% average in key sectors. The implementation of software internationalization for global scalability provides a foundational framework, enabling companies to offer robust multilingual support for omnichannel cx.
- This is particularly critical in e-commerce, where the demand for hyper-localization in e-commerce is driving a need for culturally nuanced content. Organizations are leveraging ai-driven translation for enterprise applications to streamline internal communications and external reporting. In parallel, the entertainment sector's reliance on localization for the software and gaming industries continues to expand.
- To improve customer interactions, businesses are deploying real-time speech-to-speech translation for customer support. A key challenge remains ensuring quality assurance for AI-assisted translation, especially when handling multimedia formats with layout fidelity. The growing use of machine translation for creative content is also pushing the boundaries of automated systems. However, this efficiency introduces pricing pressure from mtpe and automation.
- Forward-thinking companies are mitigating security risks with on-device real-time translation for privacy and on-device processing for secure communication. The integration of certified translations for regulatory compliance and technical translation for industrial manufacturing remains non-negotiable, while managing terminology for brand consistency and employing transcreation for global marketing campaigns are key for market penetration.
- Ultimately, integrating translation into digital workflows, including advancements like the ai-powered french language service, defines modern competitive strategy.
What are the key market drivers leading to the rise in the adoption of Language Services Industry?
- A key market driver is the demand for localized, multilingual customer experiences, driven by the ongoing globalization of business.
- Market growth is propelled by the imperatives of a connected global economy. The primary driver is globalization, which necessitates localized, multilingual user experiences to effectively engage diverse audiences.
- Providing native-language support in e-commerce has been shown to increase conversion rates by up to 70%, making it essential for omnichannel customer engagement. Secondly, the adoption of software internationalization best practices is critical for technology companies.
- By designing enterprise applications and SaaS models for multilingual support from the outset, businesses can reduce localization-related rework by over 35%, accelerating global product rollouts.
- This proactive approach supports continuous localization and ensures brand consistency across all markets, reinforcing the need for expert localization services.
What are the market trends shaping the Language Services Industry?
- A significant trend is the rising demand for specialized language services tailored for regulated and technical industries. This reflects a growing need for precision in compliance-heavy sectors.
- Key market trends are redefining service delivery, driven by technological advancements and shifting client demands. The adoption of machine translation post-editing is expanding beyond technical documentation into creative content, with hybrid models that leverage human-in-the-loop oversight to improve linguistic accuracy by over 30%. This approach balances speed with quality for digital content.
- Another significant trend is the rise of on-device translation, where on-device processing ensures privacy compliance by keeping sensitive data off external servers, a critical factor in regulated sectors. Furthermore, there is a surge in demand for industry-specific language solutions, requiring deep subject-matter expertise for sectors like finance and healthcare, where certified translations and precise terminology management are non-negotiable.
What challenges does the Language Services Industry face during its growth?
- Ensuring robust quality assurance for AI-assisted translation workflows presents a primary challenge to industry expansion and reliability.
- The industry faces significant operational challenges that temper growth. A primary constraint is ensuring quality assurance for AI-assisted translation workflows, as the lack of standardized metrics can lead to a 25% increase in revision cycles for complex projects. This complicates efforts to maintain brand consistency and cultural relevance. Another challenge is handling diverse multimedia formats while preserving layout fidelity.
- The technical expertise required for desktop publishing and video editing to manage text expansion or script direction changes can increase project costs by up to 50% if not managed effectively. Finally, persistent pricing pressure from the efficiencies of machine translation post-editing and automation forces providers to balance competitive rates with investments in the skilled linguists needed for high-quality transcreation services.
Exclusive Technavio Analysis on Customer Landscape
The language services market forecasting report includes the adoption lifecycle of the market, covering from the innovator’s stage to the laggard’s stage. It focuses on adoption rates in different regions based on penetration. Furthermore, the language services market report also includes key purchase criteria and drivers of price sensitivity to help companies evaluate and develop their market growth analysis strategies.
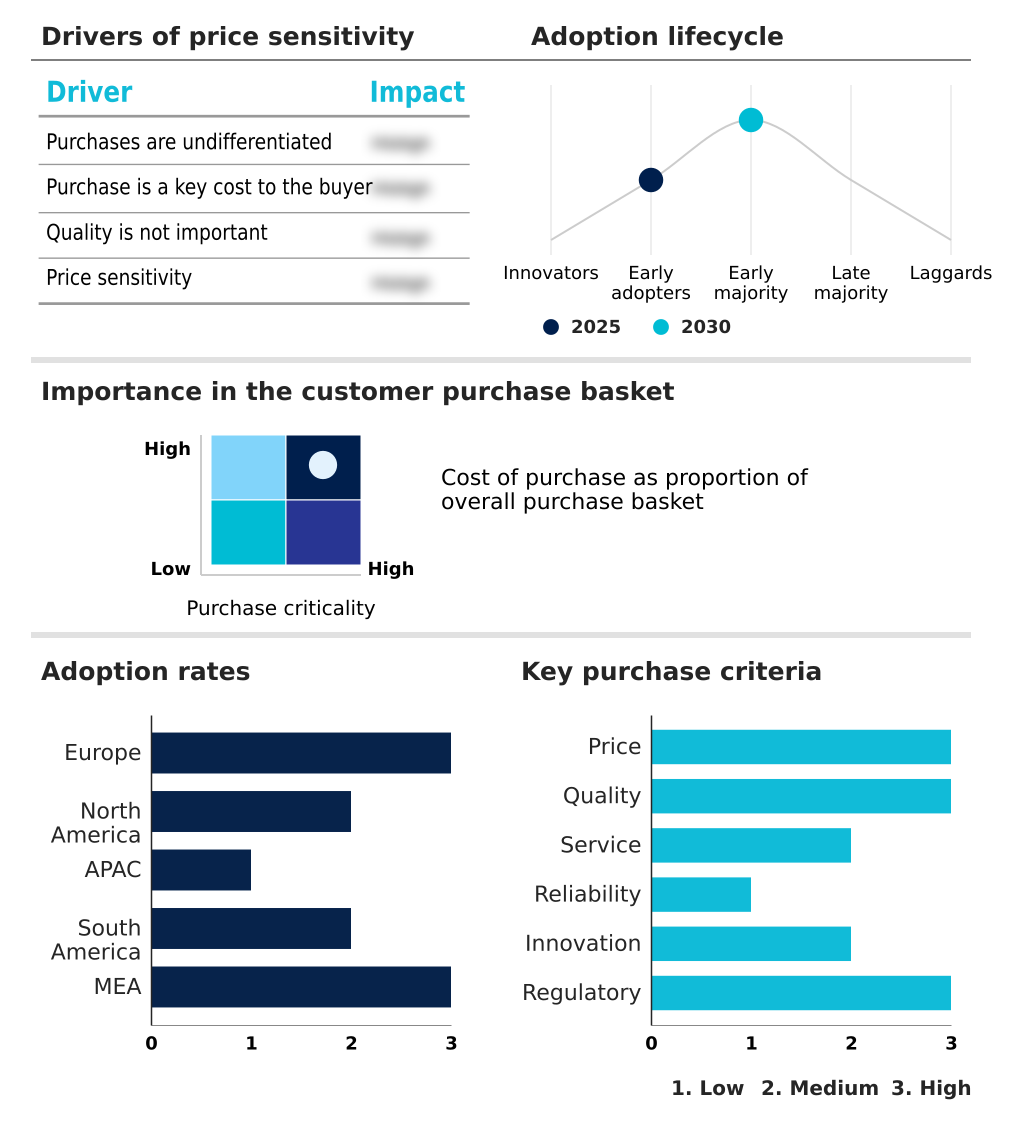
Customer Landscape of Language Services Industry
Competitive Landscape
Companies are implementing various strategies, such as strategic alliances, language services market forecast, partnerships, mergers and acquisitions, geographical expansion, and product/service launches, to enhance their presence in the industry.
Acolad Group - Providing integrated translation, localization, and interpretation services, enabling effective multilingual communication for global enterprises.
The industry research and growth report includes detailed analyses of the competitive landscape of the market and information about key companies, including:
- Acolad Group
- APPEN Ltd.
- Argos Multilingual
- Christian Lingua
- Global Talk LLC
- Hogarth
- Interpreter Services
- Language Line Solutions
- LanguageNoBar
- President Translation Service
- RWS Holdings PLC
- STAR AG
- STAR7
- TransPerfect Global Inc.
- Welocalize Inc.
- Wolfestone Translation Ltd.
Qualitative and quantitative analysis of companies has been conducted to help clients understand the wider business environment as well as the strengths and weaknesses of key industry players. Data is qualitatively analyzed to categorize companies as pure play, category-focused, industry-focused, and diversified; it is quantitatively analyzed to categorize companies as dominant, leading, strong, tentative, and weak.
Recent Development and News in Language services market
- In October, 2024, InAnyLanguage launched as a global B2B brand following its acquisition of Villam Language Services, combining European localization expertise with technology-driven translation and localization solutions for enterprise clients.
- In February, 2025, TransPerfect Global Inc. completed its acquisition of the Apostroph Group, a leading language services provider in Switzerland, to expand its presence in the region.
- In April, 2025, Dow Jones Newswires launched an AI-powered French Language Service, delivering real-time translations of global financial news to provide French-speaking investors with timely market insights.
- In May, 2025, Arab News introduced a beta AI-powered translation service, offering its content in 50 languages to expand its global reach to an estimated 6.5 billion people.
Dive into Technavio’s robust research methodology, blending expert interviews, extensive data synthesis, and validated models for unparalleled Language Services Market insights. See full methodology.
| Market Scope | |
|---|---|
| Page number | 293 |
| Base year | 2025 |
| Historic period | 2020-2024 |
| Forecast period | 2026-2030 |
| Growth momentum & CAGR | Accelerate at a CAGR of 7.9% |
| Market growth 2026-2030 | USD 31169.5 million |
| Market structure | Fragmented |
| YoY growth 2025-2026(%) | 7.1% |
| Key countries | Germany, UK, France, Italy, Spain, The Netherlands, US, Canada, Mexico, China, Japan, India, South Korea, Australia, Indonesia, Brazil, Argentina, Colombia, Saudi Arabia, UAE, South Africa, Israel and Turkey |
| Competitive landscape | Leading Companies, Market Positioning of Companies, Competitive Strategies, and Industry Risks |
Research Analyst Overview
- The market is undergoing a significant transformation, driven by the integration of AI-driven solutions that redefine translation workflows. The focus is shifting from manual processes to sophisticated, automated systems powered by neural machine translation and natural language processing. This evolution necessitates advanced terminology management and robust quality assurance processes to handle complex content transformation and localization services.
- Boardroom-level discussions increasingly center on deploying on-device translation to ensure data privacy, a move that can mitigate compliance risks by over 90%. Key technologies like remote simultaneous interpretation and video remote interpretation are becoming standard for multilingual communication, while computer assisted translation tools enhance linguistic proficiency.
- The rise of speech-to-speech translation and machine translation post-editing is creating hybrid models where human expertise in cultural adaptation and linguistic testing complements AI.
- Effective globalization strategies now depend on seamless internationalization, language accessibility, and managing dialectal differences through advanced translation management systems for everything from subtitling and dubbing to voice acting and ensuring text expansion and character encoding are handled correctly. This technological pivot toward linguistic intelligence is crucial for delivering high-quality multilingual support.
What are the Key Data Covered in this Language Services Market Research and Growth Report?
-
What is the expected growth of the Language Services Market between 2026 and 2030?
-
USD 31.17 billion, at a CAGR of 7.9%
-
-
What segmentation does the market report cover?
-
The report is segmented by Service (Translation, Interpretation, and Others), End-user (Healthcare, ICT, BFSI, Government, and Others), Learning Method (Online, and Offline) and Geography (Europe, North America, APAC, South America, Middle East and Africa)
-
-
Which regions are analyzed in the report?
-
Europe, North America, APAC, South America and Middle East and Africa
-
-
What are the key growth drivers and market challenges?
-
Globalization demanding localized, multilingual customer experiences, Quality assurance for AI‑assisted translation workflows
-
-
Who are the major players in the Language Services Market?
-
Acolad Group, APPEN Ltd., Argos Multilingual, Christian Lingua, Global Talk LLC, Hogarth, Interpreter Services, Language Line Solutions, LanguageNoBar, President Translation Service, RWS Holdings PLC, STAR AG, STAR7, TransPerfect Global Inc., Welocalize Inc. and Wolfestone Translation Ltd.
-
Market Research Insights
- Market dynamics are shaped by the push for greater efficiency and deeper integration into enterprise operations. The adoption of SaaS models and cloud-based platforms in enterprise applications necessitates continuous localization, with automated translation workflows improving deployment speed by over 30%. This drive for efficiency creates a demand for end-to-end solutions that manage everything from source content to final delivery.
- In parallel, a focus on native-language support for omnichannel content delivery is critical, as personalized multilingual user experiences can improve customer engagement rates by more than 40%. This requires sophisticated cross-border communication strategies that ensure cultural relevance and linguistic accuracy across all touchpoints, from marketing materials to technical support, underpinning the strategic value of language services.
We can help! Our analysts can customize this language services market research report to meet your requirements.
 RIA -
RIA - 
