
Social Networking Market Size 2026-2030
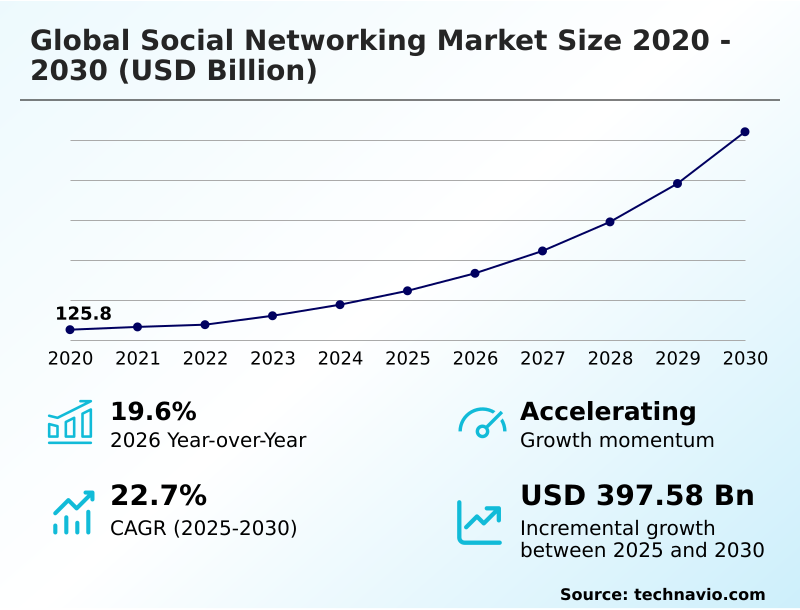
The social networking market size is valued to increase by USD 397.58 billion, at a CAGR of 22.7% from 2025 to 2030. Growing integration of artificial intelligence for enhanced personalization will drive the social networking market.
Major Market Trends & Insights
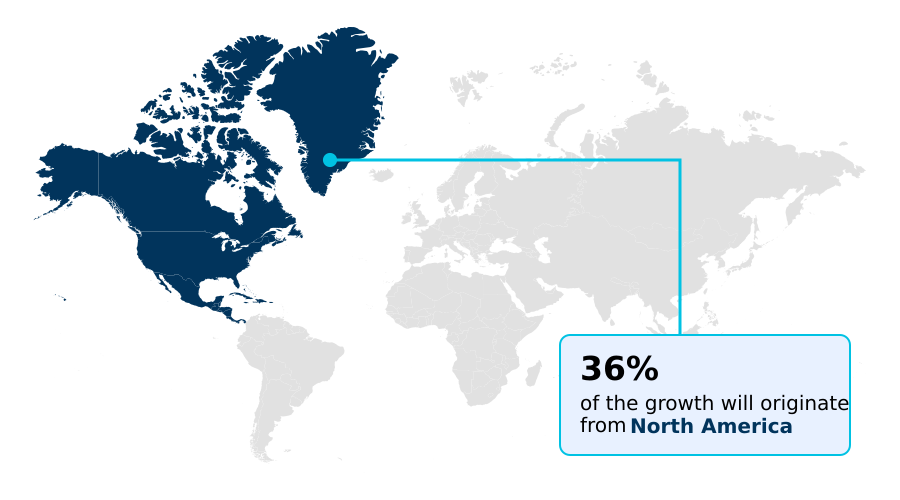
- North America dominated the market and accounted for a 36.5% growth during the forecast period.
- By Type - Advertising segment was valued at USD 104.99 billion in 2024
- By Service - Communication segment accounted for the largest market revenue share in 2024
Market Size & Forecast
- Market Opportunities: USD 494.78 billion
- Market Future Opportunities: USD 397.58 billion
- CAGR from 2025 to 2030 : 22.7%
Market Summary
- The Social Networking Market is undergoing a significant transformation, moving beyond simple connectivity to become a multifaceted ecosystem for communication, entertainment, and commerce. A key driver is the integration of machine learning algorithms to enable hyper-personalization of content, with platforms using a recommendation engine to curate algorithmic content feeds that maximize user engagement.
- This is complemented by the rise of the creator economy, where direct monetization through in-app purchases and subscription-based models empowers individuals. For instance, a direct-to-consumer brand leverages social listening tools and user engagement analytics to identify emerging trends, using generative AI content tools to rapidly create and deploy a targeted influencer marketing platform campaign around a new product.
- This agility, combined with social commerce integration and live stream shopping, creates a seamless path from discovery to purchase. However, the industry grapples with challenges related to user-generated content moderation, data privacy, and the need for digital wellness tools to promote healthy online habits.
- The evolution toward decentralized social networks and privacy-focused social platforms also signals a user-driven demand for greater control over digital identity verification and personal data, reshaping the competitive landscape.
What will be the Size of the Social Networking Market during the forecast period?
Get Key Insights on Market Forecast (PDF) Get Free Sample
How is the Social Networking Market Segmented?
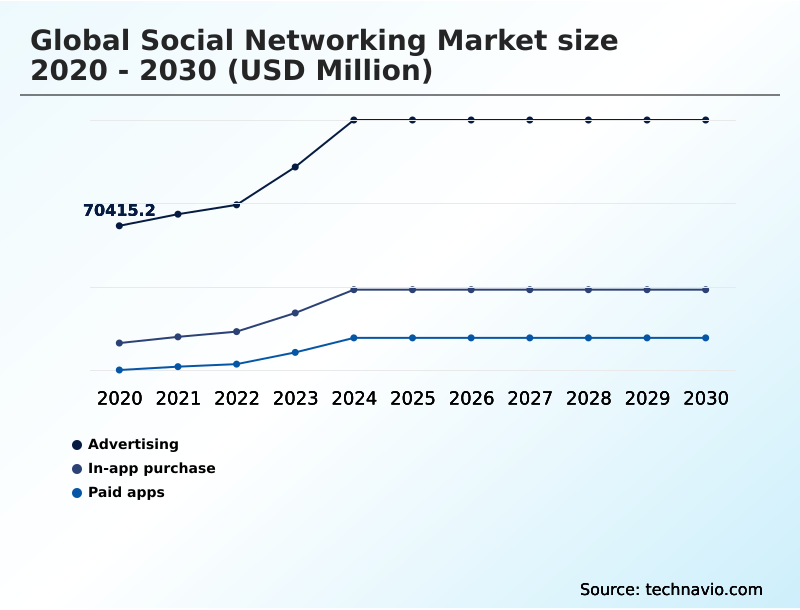
The social networking industry research report provides comprehensive data (region-wise segment analysis), with forecasts and estimates in "USD million" for the period 2026-2030, as well as historical data from 2020-2024 for the following segments.
- Type
- Advertising
- In-app purchase
- Paid apps
- Service
- Communication
- Entertainment
- Socialization
- Marketing
- Customer service
- Platform
- Website-based
- Mobile apps
- Hybrid platforms
- Geography
- North America
- US
- Canada
- Mexico
- APAC
- China
- Japan
- India
- Europe
- Germany
- UK
- France
- South America
- Brazil
- Argentina
- Colombia
- Middle East and Africa
- Saudi Arabia
- UAE
- South Africa
- Rest of World (ROW)
- North America
By Type Insights
The advertising segment is estimated to witness significant growth during the forecast period.
The advertising segment is the financial core of the market, driven by sophisticated data-driven advertising models.
Central to this is the monetization of user data, which fuels machine learning algorithms to power recommendation engine systems and feed curation algorithms, enabling unparalleled hyper-personalization.
This approach allows for precise targeted advertising capabilities, where platforms leverage social listening tools and analyze user behavior tracking data to deliver relevant promotional content. To maintain trust, robust brand safety controls and clear brand-sponsored content disclosure are becoming standard.
This ecosystem, enhanced by AI-driven trend forecasting and deep social CRM integration, allows businesses to achieve up to a 40% higher return on investment compared to many traditional marketing channels, transforming how brands connect with consumers.
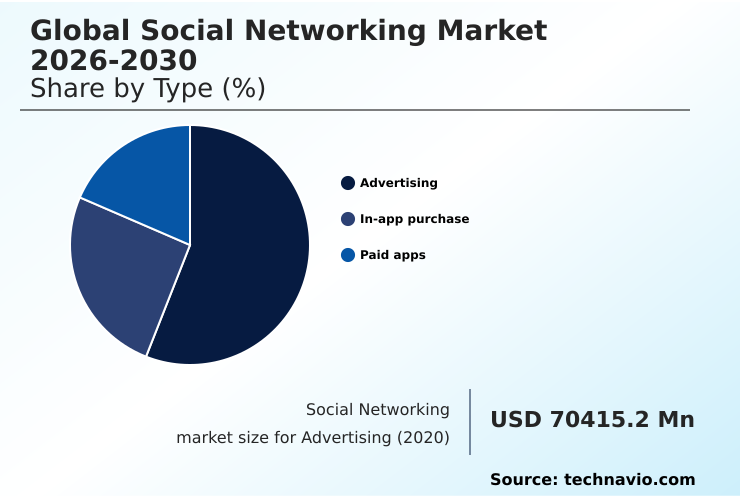
The Advertising segment was valued at USD 104.99 billion in 2024 and showed a gradual increase during the forecast period.
Regional Analysis
North America is estimated to contribute 36.5% to the growth of the global market during the forecast period.Technavio’s analysts have elaborately explained the regional trends and drivers that shape the market during the forecast period.
See How Social Networking Market Demand is Rising in North America Get Free Sample
The geographic landscape of the market is diverse, with North America representing the largest market share at 36.5%, driven by high user monetization and technological adoption.
However, APAC is the epicenter of growth, expanding at a rate of 23.5% annually, fueled by mobile-first populations in countries like India and Indonesia. Europe, growing at 22.2%, prioritizes regulatory compliance and data privacy.
A successful localized content strategy is crucial across all regions, as content discovery algorithms are increasingly optimized for cultural relevance. In APAC, gamified user engagement and ephemeral content drive adoption, while North America sees deeper integration of visual discovery tools.
Hyper-local community building powered by geotagging features is a universal driver, capitalizing on network effect dynamics. Platforms are also leveraging AI-driven trend forecasting to adapt offerings, with social audio platforms and closed community platforms gaining traction globally.
Market Dynamics
Our researchers analyzed the data with 2025 as the base year, along with the key drivers, trends, and challenges. A holistic analysis of drivers will help companies refine their marketing strategies to gain a competitive advantage.
- The strategic trajectory of the market is shaped by several interconnected developments. The impact of 5G on social media is profound, enabling richer, more immersive experiences and setting the stage for the future of social interaction VR.
- This technological backbone amplifies the need for sophisticated AI for social content personalization, which is central to enhancing user experience but also raises questions about preventing echo chambers in feeds. Concurrently, the industry is grappling with significant societal responsibilities.
- The discussion around social networking and mental health has pushed platforms to reconsider engagement mechanics, while the challenge of regulating misinformation on social platforms remains a top priority, influencing the role of AI in content moderation. This tension between open expression and platform integrity is crucial for balancing free speech and safety.
- From a business perspective, the social commerce customer journey is being redefined by integrating e-commerce into social apps, a trend where short-form video engagement metrics serve as key performance indicators for brand campaigns. Creator monetization on social media is now a cornerstone of platform strategy.
- Brands are increasingly adopting AR filters for brand marketing to create interactive campaigns, which necessitates robust cross-platform social media management. The rise of decentralized platforms vs centralized networks introduces a new paradigm focused on user data privacy in social networking.
- Finally, the use of social media for customer service and for social networking for professional development highlights the market's expansion into essential utility functions, moving far beyond its origins in casual connection and building communities on social media.
What are the key market drivers leading to the rise in the adoption of Social Networking Industry?
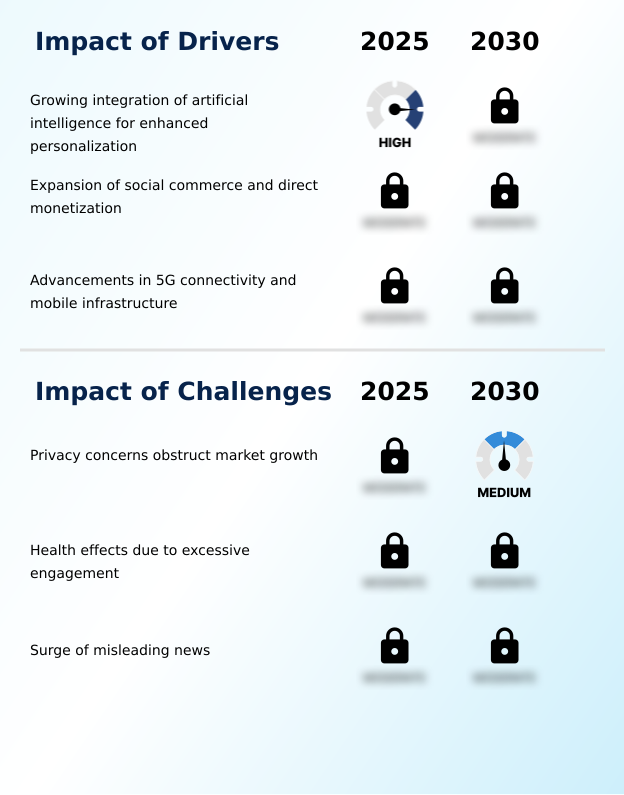
- The increasing integration of artificial intelligence is a key market driver, enabling enhanced personalization and propelling significant platform growth.
- Market growth is significantly driven by advanced technological integration and new monetization channels.
- The expansion of social e-commerce infrastructure enables seamless social commerce integration and live stream shopping events, which have demonstrated the ability to increase conversion rates by up to 30%.
- Core to user retention strategies is hyper-personalization, delivered through sophisticated recommendation engine logic and feed curation algorithms that refine content delivery. This creates powerful targeted advertising capabilities. Furthermore, the growth of direct monetization tools empowers creators and diversifies platform revenue.
- Platforms are also bolstering trust and utility by embedding real-time communication services with end-to-end encryption, a feature that has become a baseline expectation and can improve user trust scores by 15%.
- A strong localized content strategy, informed by user engagement analytics, remains critical for global expansion.
What are the market trends shaping the Social Networking Industry?
- The growing dominance of short-form video content marks a significant market trend, revolutionizing information consumption by shifting focus from text-based updates to fast-paced, visually engaging clips.
- Market trends are pushing toward more immersive and creator-centric environments. The dominance of ephemeral content continues, with ephemeral storytelling formats evolving to include interactive augmented reality filters. These features contribute to immersive social experiences that boost engagement.
- A significant shift is underway toward decentralized social networks and privacy-focused social platforms, which offer users digital asset ownership models and greater control over their data; these platforms have seen a 25% increase in user sign-ups over the last year. The creator economy is also maturing beyond ad revenue, with subscription-based models and creator partnership programs becoming primary income streams.
- Generative AI content tools are further empowering creators, while visual discovery tools are essential for navigating this expanding universe of content across a seamless cross-platform social experience.
What challenges does the Social Networking Industry face during its growth?
- Mounting concerns over the protection of personal data represent a key challenge, creating a barrier to market growth by eroding consumer trust.
- Key market challenges revolve around trust, safety, and the ethical implications of technology. The scale of user-generated content moderation is a primary hurdle, as the viral content mechanics of algorithmic content feeds can amplify harmful content faster than content moderation AI can detect it; misinformation often spreads six times faster than factual news.
- This puts immense pressure on brand safety controls. In response, there is a growing demand for algorithmic transparency reporting and stronger community governance models, particularly within community-based forums and closed community platforms. The reliance on data-driven advertising also faces scrutiny, with users demanding greater control through data portability rights.
- Furthermore, the need for effective digital wellness tools to mitigate negative mental health impacts is compelling platforms to rethink their engagement-at-all-costs models, with platforms that offer such tools reporting a 10% higher net promoter score.
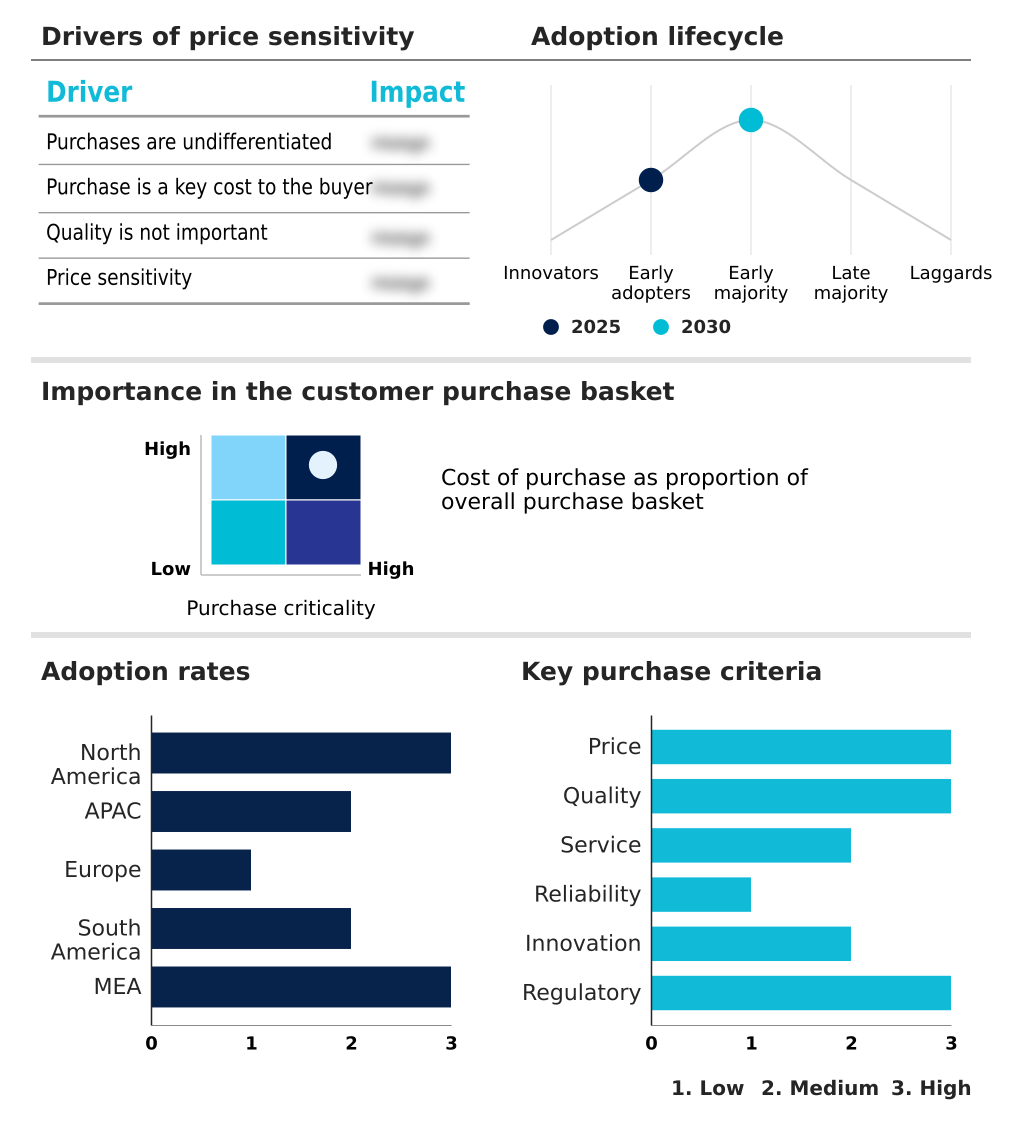
Exclusive Technavio Analysis on Customer Landscape
The social networking market forecasting report includes the adoption lifecycle of the market, covering from the innovator’s stage to the laggard’s stage. It focuses on adoption rates in different regions based on penetration. Furthermore, the social networking market report also includes key purchase criteria and drivers of price sensitivity to help companies evaluate and develop their market growth analysis strategies.
Customer Landscape of Social Networking Industry
Competitive Landscape
Companies are implementing various strategies, such as strategic alliances, social networking market forecast, partnerships, mergers and acquisitions, geographical expansion, and product/service launches, to enhance their presence in the industry.
Automattic Inc. - Specializing in ephemeral photo messaging and creative storytelling, the platform uses augmented reality filters to drive highly visual communication and user engagement.
The industry research and growth report includes detailed analyses of the competitive landscape of the market and information about key companies, including:
- Automattic Inc.
- ByteDance Ltd.
- Discord Inc.
- LinkedIn Corp.
- LY Corporation
- MediaLab.Ai
- Meetup
- Meta Platforms Inc.
- Myspace LLC
- Nextdoor Holdings Inc.
- Pinterest Inc.
- Quora Inc.
- Rakuten Group Inc.
- Reddit Inc.
- Snap Inc.
- Telegram Messenger Inc.
- Tencent Holdings Ltd.
- X Corp.
- Yelp Inc.
Qualitative and quantitative analysis of companies has been conducted to help clients understand the wider business environment as well as the strengths and weaknesses of key industry players. Data is qualitatively analyzed to categorize companies as pure play, category-focused, industry-focused, and diversified; it is quantitatively analyzed to categorize companies as dominant, leading, strong, tentative, and weak.
Recent Development and News in Social networking market
- In January 2025, Meta announced a major update to its recommendation engine to better support creators worldwide by deploying next-generation AI models designed to prioritize authentic human storytelling.
- In February 2025, TikTok detailed its strategic roadmap to expand its integrated logistics and payment systems into more international regions, aiming to become a primary commerce hub.
- In April 2025, YouTube announced a new suite of creative tools for its Shorts platform, introducing advanced editing features that use cloud computing to provide professional-grade effects to all users.
- In May 2025, Snap Inc. released a significant update to its Lens Studio, which includes new spatial mapping capabilities that allow for more realistic and stable digital overlays interacting with the physical environment.
Dive into Technavio’s robust research methodology, blending expert interviews, extensive data synthesis, and validated models for unparalleled Social Networking Market insights. See full methodology.
| Market Scope | |
|---|---|
| Page number | 301 |
| Base year | 2025 |
| Historic period | 2020-2024 |
| Forecast period | 2026-2030 |
| Growth momentum & CAGR | Accelerate at a CAGR of 22.7% |
| Market growth 2026-2030 | USD 397577.9 million |
| Market structure | Fragmented |
| YoY growth 2025-2026(%) | 19.6% |
| Key countries | US, Canada, Mexico, China, Japan, India, South Korea, Australia, Indonesia, Germany, UK, France, Italy, Spain, The Netherlands, Brazil, Argentina, Colombia, Saudi Arabia, UAE, South Africa, Israel and Turkey |
| Competitive landscape | Leading Companies, Market Positioning of Companies, Competitive Strategies, and Industry Risks |
Research Analyst Overview
- The social networking market is in a state of perpetual innovation, driven by the convergence of advanced technologies and shifting user expectations. The core experience is now defined by short-form video content and ephemeral content, with engagement amplified by augmented reality filters and virtual try-on experiences that create immersive interactions.
- Underpinning this is a sophisticated technological stack, including machine learning algorithms that power recommendation engine systems and curate algorithmic content feeds for hyper-personalization. This data-driven advertising model, which relies on social graph analysis, is now being balanced by the creator economy, which enables direct monetization through in-app purchases and subscription-based models.
- A key strategic consideration for leadership is the rise of decentralized social networks, which challenges traditional data governance models and emphasizes digital identity verification and peer-to-peer content sharing. This trend, alongside demands for better digital wellness tools, forces a re-evaluation of platform architecture.
- For instance, the implementation of generative AI content tools has accelerated content creation for marketers by over 30%. Platforms are also enhancing communication with features like end-to-end encryption and real-time microblogging, while fostering communities through community-based forums. The ongoing challenge remains effective user-generated content moderation, necessitating advanced social listening tools and strict brand safety controls to manage network effect dynamics.
- This complex environment requires a focus on both visual discovery tools and community governance models, all while managing new formats like ephemeral photo messaging and utilizing geotagging features.
What are the Key Data Covered in this Social Networking Market Research and Growth Report?
-
What is the expected growth of the Social Networking Market between 2026 and 2030?
-
USD 397.58 billion, at a CAGR of 22.7%
-
-
What segmentation does the market report cover?
-
The report is segmented by Type (Advertising, In-app purchase, and Paid apps), Service (Communication, Entertainment, Socialization, Marketing, and Customer service), Platform (Website-based, Mobile apps, and Hybrid platforms) and Geography (North America, APAC, Europe, South America, Middle East and Africa)
-
-
Which regions are analyzed in the report?
-
North America, APAC, Europe, South America and Middle East and Africa
-
-
What are the key growth drivers and market challenges?
-
Growing integration of artificial intelligence for enhanced personalization, Privacy concerns obstruct market growth
-
-
Who are the major players in the Social Networking Market?
-
Automattic Inc., ByteDance Ltd., Discord Inc., LinkedIn Corp., LY Corporation, MediaLab.Ai, Meetup, Meta Platforms Inc., Myspace LLC, Nextdoor Holdings Inc., Pinterest Inc., Quora Inc., Rakuten Group Inc., Reddit Inc., Snap Inc., Telegram Messenger Inc., Tencent Holdings Ltd., X Corp. and Yelp Inc.
-
Market Research Insights
- The market's dynamism is fueled by a strategic shift toward a cross-platform social experience, where platform interoperability standards are gaining traction, with early adopters reporting a 15% improvement in user retention. Privacy-focused social platforms are experiencing rapid growth, capturing a user base that has grown by over 40% in key demographics concerned about the monetization of user data.
- This is compelling established players to adopt algorithmic transparency reporting and offer clearer brand-sponsored content disclosure. Furthermore, effective online community management has been shown to increase daily active users by up to 20%, highlighting the value of fostering genuine interaction over passive consumption.
- Social e-commerce infrastructure and social CRM integration are also becoming pivotal, as they directly link engagement to transactional outcomes.
We can help! Our analysts can customize this social networking market research report to meet your requirements.
 RIA -
RIA - 
