Leather Goods Market Analysis APAC, North America, Europe, South America, Middle East and Africa - US, China, Japan, France, UK - Size and Forecast 2024-2028

Leather Goods Market Analysis APAC, North America, Europe, South America, Middle East and Africa - US, China, Japan, France, UK - Size and Forecast 2024-2028

Published: Aug 2024 177 Pages SKU: IRTNTR45025

Market Overview at a Glance

$105.8 B
Market Opportunity
6.78%
CAGR
6.24
YoY growth 2023-2024(%)

Leather Goods Market Size 2024-2028

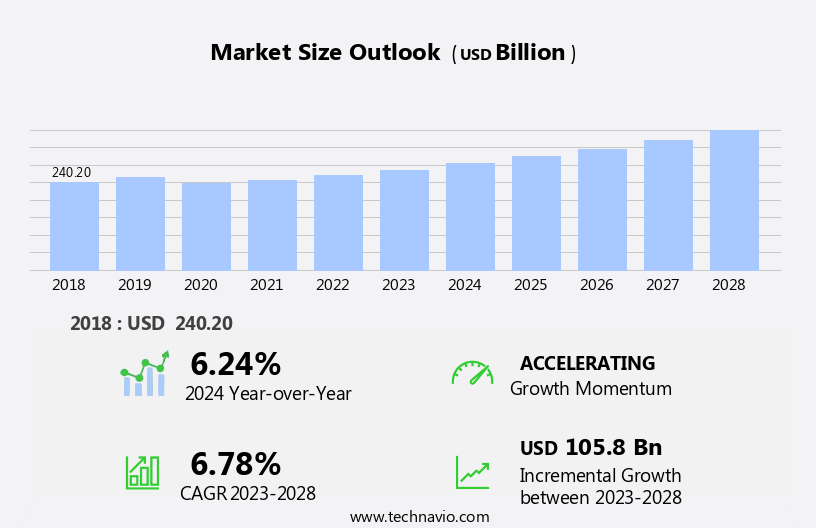
The leather goods market size is forecast to increase by USD 105.8 billion at a CAGR of 6.78% between 2023 and 2028.

  • The market encompasses a range of products including handbags, wallets, footwear, luggage, and furniture. Key market trends include the adoption of innovative marketing strategies and the introduction of different leather varieties. Apple's influence on the industry is notable, with consumers increasingly seeking high-quality, durable, and sustainable leather goods. 
  • Operational costs continue to fluctuate due to factors such as outsourcing production to countries like China and Vietnam, as well as the rising cost of raw materials like mushroom leather. Digital marketing and influencer partnerships are also driving growth In the sector. In the US market, apparel categories like handbags and sneakers are experiencing significant demand, with consumers prioritizing functionality, style, and affordability.
  • The use of plastic alternatives is gaining traction due to environmental concerns, but leather remains a preferred material for many consumers due to its durability and classic appeal.

What will be the Size of the Leather Goods Market During the Forecast Period?

Leather Goods Market Size

 Request Free Sample

  • The market encompasses a wide range of products, including apparel, footwear, and accessories. Driven by rising living standards and evolving fashion trends, the market has experienced significant growth in recent years. Fancy leather apparel and intricately designed handbags, belts, wallets, footwear, and other accessories continue to gain popularity due to their versatility and durability. 
  • Leather manufacturers employ advanced automated machinery and processing techniques to create complex designs, such as digital cutting and mushroom leather, enhancing the appeal of these products. Brand awareness plays a crucial role In the market, with designers and world-renowned labels driving demand for high-quality leather goods.
  • The leather material is used not only for fashion items but also for saddles, furniture, and various industrial applications. The market is expected to maintain its momentum, reflecting the enduring appeal of this versatile material.

How is this Leather Goods Industry segmented and which is the largest segment?

The leather goods industry research report provides comprehensive data (region-wise segment analysis), with forecasts and estimates in "USD billion" for the period 2024-2028, as well as historical data from 2018-2022 for the following segments.

  • Product
    • Footwear
    • LBWP
    • Others
  • Distribution Channel
    • Offline
    • Online
  • Geography
    • APAC
      • China
      • Japan
    • North America
      • US
    • Europe
      • UK
      • France
    • South America
    • Middle East and Africa

By Product Insights

  • The footwear segment is estimated to witness significant growth during the forecast period.

The market encompasses a wide range of consumer products, including footwear, apparel, accessories, and leather-covered furniture. This industry is driven by factors such as rising demand for fashionable and durable leather consumer goods, as well as the versatility and luxurious appeal of genuine leather. Brands and designers continue to innovate, introducing complex designs and sustainable alternatives like synthetic type materials such as polyurethane and polyvinyl chloride. Consumers, particularly UHNWIs, seek out high-end, branded goods from companies who offer a variety of leather footwear, luggage, apparel, and accessories. Leather manufacturers utilize automated machinery and advanced processing techniques to create intricate designs and digital cutting patterns.

Despite the popularity of leather goods, there are concerns regarding the environmental impact and animal welfare issues associated with animal-based leather production. As a result, there is a growing trend towards sustainable plant-based materials like PLA corn plastic, PET, and PV-based coatings. In conclusion, the market continues to thrive due to its durability, versatility, and luxury appeal, with a focus on sustainable and ethical production methods.

Leather Goods Market Size

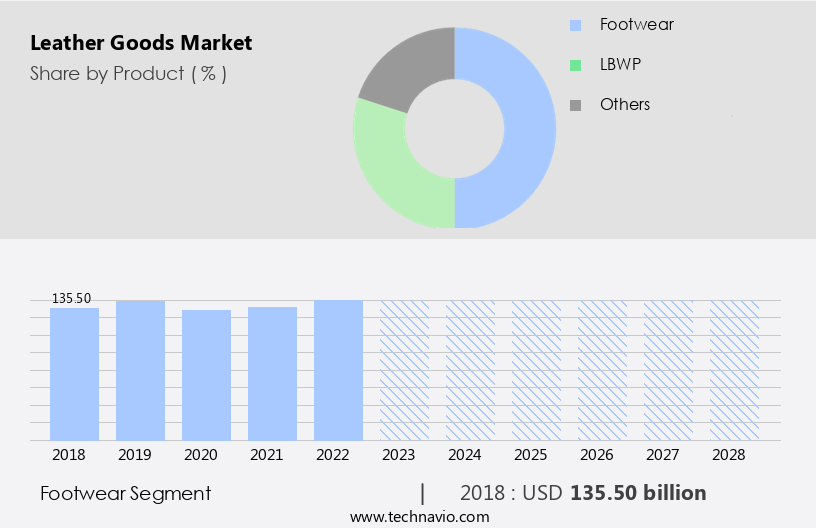
Get a glance at the Leather Goods Industry report of share of various segments Request Free Sample

The Footwear segment was valued at USD 135.50 billion in 2018 and showed a gradual increase during the forecast period.

Regional Analysis

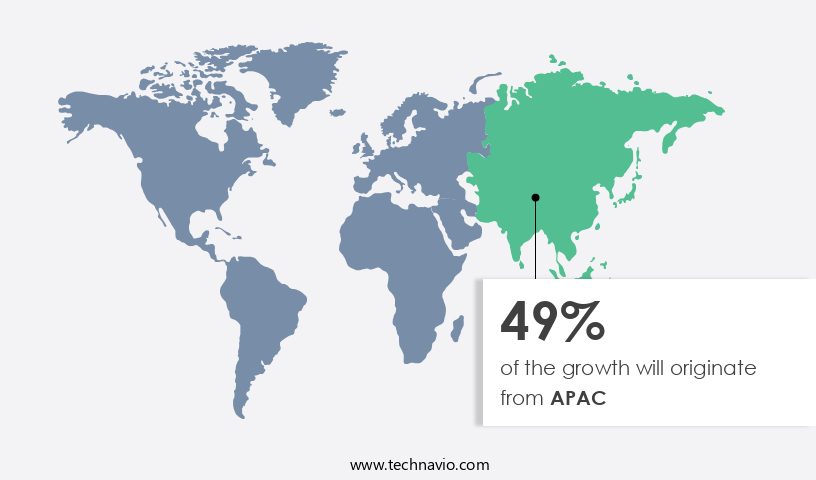
  • APAC is estimated to contribute 49% to the growth of the global market during the forecast period.

Technavio's analysts have elaborately explained the regional trends and drivers that shape the market during the forecast period.

Leather Goods Market Share by Geography

For more insights on the market share of various regions, Request Free Sample

The market in APAC is experiencing significant growth due to increasing living standards, fashion trends, and a rising consumer base. Key countries, including China, Japan, and South Korea, contribute substantially to this expansion. International leather goods manufacturers, such as Prada, Tapestry, and Giorgio Armani, have established factories or OEMs in countries like China, Indonesia, Bangladesh, and Vietnam. Furthermore, the market is propelled by the shift from price-conscious consumers to fashion-conscious ones, as well as the burgeoning fashion industry. This industry growth is driven by the increasing number of fashion events and celebrity endorsements, particularly from Bollywood in India. Leather goods, including handbags, footwear, belts, and accessories, are popular among young consumers due to their versatility, durability, and luxurious appeal.

Leather manufacturers employ advanced techniques, such as digital cutting and automated machinery, to produce complex designs. Sustainable products, such as those made from plant-based materials or synthetic leathers like polyurethane and polyvinyl chloride, are also gaining popularity. Brands like Stella McCartney have made a name for themselves In the market by offering high-quality, animal-friendly alternatives. Leather consumer goods, including luggage, apparel, saddles, furniture, wallets, and belts, are essential for all seasons. They offer weather protection, breathability, temperature control, and comfort. Proper care is necessary to maintaIn their finer quality and longevity.

Overall, the market is a significant player In the fashion business, offering extensive usage, luxury appeal, and versatility.

Market Dynamics

Our  researchers analyzed the data with 2023 as the base year, along with the key drivers, trends, and challenges. A holistic analysis of drivers will help companies refine their marketing strategies to gain a competitive advantage.

What are the key market drivers leading to the rise In the adoption of Leather Goods Industry?

Innovative marketing strategies is the key driver of the market.

  • The market has witnessed significant growth in recent years, driven by rising living standards and fashion trends. Consumers' preferences for luxury leather apparel, footwear, and accessories continue to increase, leading to brand awareness and demand for designer and branded clothes. UHNWIs (Ultra High Net Worth Individuals) are a key demographic for this market, as genuine leather and synthetic type products, such as those made from polyurethane or polyvinyl chloride, offer versatility, durability, finer quality, and a luxurious appeal. Designers and brands like Stella McCartney, Nike, New Balance, Adidas, Puma, Reebok, All birds, Converse, and others have capitalized on this trend, using automated machinery and advanced processing techniques to create complex designs and popularize fashionable colors.
  • Digital cutting and other technologies have improved the popularity of leather consumer goods, making them suitable for all seasons. However, the leather business faces challenges related to industrial constraints and negative effects on the environment and animal welfare. To address these concerns, some manufacturers are turning to plant-based materials like Sage-ONF, Mushroom leather, Apple leather, and PV-based coatings. These alternatives offer sustainable production methods and reduce animal cruelty. Leather material is extensively used in various industries, including saddles, furniture, wallets, belts, handbags, and luggage. The leather business continues to evolve, offering weather protection, breathability, temperature-controlling, and comfort features.
  • Proper care is essential to maintaIn the longevity and appearance of leather goods. Brands and specialty stores are responding to this need by providing appropriate care instructions and rising sales.

What are the market trends shaping the Leather Goods Industry?

Introduction of different leather varieties is the upcoming market trend.

  • The market has experienced significant growth in recent years, driven by increasing living standards and fashion trends. Consumers seek leather apparel, footwear, and accessories that offer brand awareness, durability, and versatility. While genuine leather remains popular, synthetic materials like polyurethane and polyvinyl chloride have gained traction due to their sustainable and animal-friendly properties. Brands like Stella McCartney have led the way in promoting sustainable leather alternatives. However, the leather industry faces challenges related to environmental concerns and animal welfare. UHNWIs, in particular, are increasingly conscious of the negative effects of animal cruelty and are turning to plant-based materials for their leather consumer goods.
  • Innovations in leather manufacturing, such as automated machinery, processing techniques, and complex designs, have led to digital cutting and the popularity of fancy leather apparel. Leather goods offer a luxurious appeal, weather protection, breathability, and temperature-controlling properties. Brands like Nike, New Balance, Adidas, Puma, Reebok, and Converse continue to dominate the market with their extensive usage of leather in shoes. Leather material is also used in luggage, apparel, saddles, furniture, wallets, belts, handbags, and other consumer goods. New materials like Sage-ONF, mushroom leather, apple leather, and PV-based coatings are gaining popularity. Companies like Lug, VitroLabs, and Saddles are investing in research and development to create innovative leather products.
  • The leather business continues to be a classic status symbol and a statement of wealth In the fashion industry.

What challenges does the Leather Goods Industry face during its growth?

Fluctuating operational costs is a key challenge affecting the industry growth.

  • The market is experiencing significant dynamics due to various factors. Living standards and fashion trends influence the demand for leather apparel, footwear, and accessories. Brand awareness plays a crucial role, with consumers favoring designer and branded clothes made from genuine leather or synthetic types like polyurethane and polyvinyl chloride. UHNWIs continue to seek luxury items, driving the popularity of leather consumer goods. However, concerns over sustainability and ethical considerations are rising. Stella McCartney is a notable brand advocating for plant-based materials, such as Sage-ONF, mushroom leather, and apple leather, as alternatives to animal-based leather. Industrial constraints, including the use of automated machinery, processing techniques, and complex designs, contribute to the versatility and luxury appeal of leather goods.
  • Digital cutting technology and PV-based coatings from companies like Lug, VitroLabs, and Saddles ensure fashionable colors, finer quality, durability, softness, and lightness. Brands like Nike, New Balance, Adidas, Puma, Reebok, All birds, and Converse continue to extensively use leather In their shoes, luggage, apparel, and accessories. Despite these benefits, the leather business faces challenges, including negative effects on the environment and animal welfare, which can impact animal cruelty perceptions and the leather products business as a whole.

Exclusive Customer Landscape

The leather goods market forecasting report includes the adoption lifecycle of the market, covering from the innovator's stage to the laggard's stage. It focuses on adoption rates in different regions based on penetration. Furthermore, the leather goods market report also includes key purchase criteria and drivers of price sensitivity to help companies evaluate and develop their market growth analysis strategies.
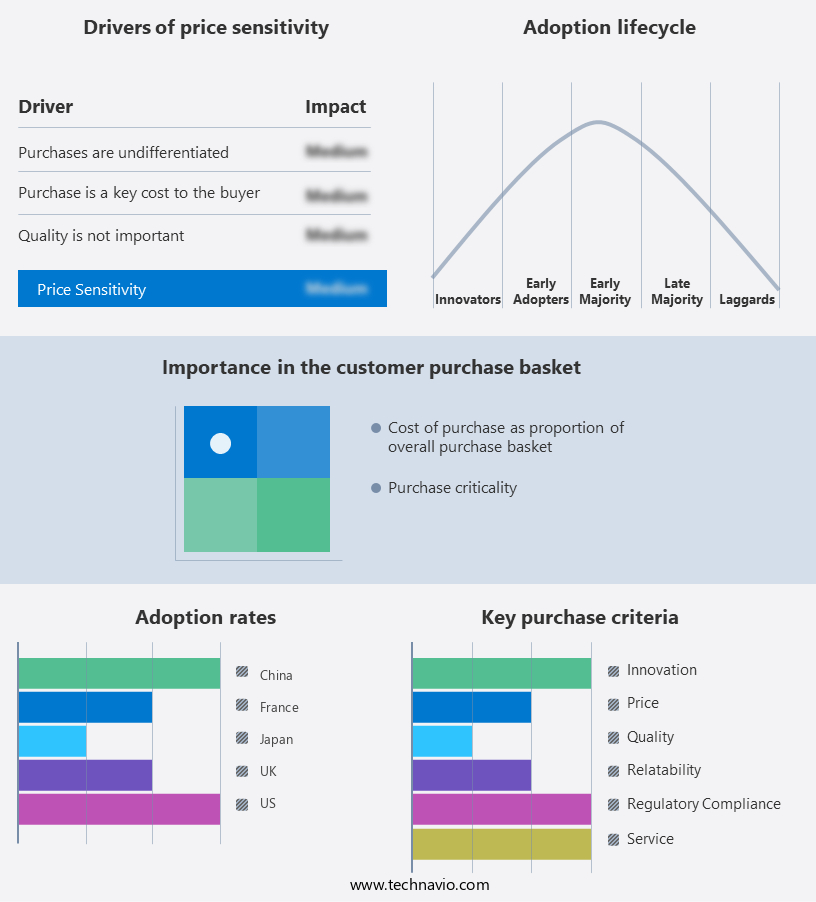
Leather Goods Market Share by Geography

 Customer Landscape

Key Companies & Market Insights

Companies are implementing various strategies, such as strategic alliances, leather goods market forecast, partnerships, mergers and acquisitions, geographical expansion, and product/service launches, to enhance their presence In the industry.

The industry research and growth report includes detailed analyses of the competitive landscape of the market and information about key companies, including:

  • Adidas AG
  • Bata
  • Burberry Group Plc
  • Capri Holdings Ltd.
  • Chanel Ltd.
  • Compagnie Financiere Richemont SA
  • Dolce and Gabbana S.r.l.
  • Giorgio Armani S.p.A.
  • GLobalLeathers
  • Hermes International SA
  • Kering SA
  • LVMH Group.
  • Mulberry Group Plc
  • Nike Inc.
  • Prada S.p.A
  • PUMA SE
  • Ralph Lauren Corp.
  • Samsonite International S.A.
  • Tapestry Inc.
  • VF Corp.

Qualitative and quantitative analysis of companies has been conducted to help clients understand the wider business environment as well as the strengths and weaknesses of key industry players. Data is qualitatively analyzed to categorize companies as pure play, category-focused, industry-focused, and diversified; it is quantitatively analyzed to categorize companies as dominant, leading, strong, tentative, and weak.

Research Analyst Overview

The market encompasses a wide range of consumer products, including apparel, footwear, and accessories. This market is driven by various factors, including living standards and fashion trends. Consumers continue to seek out high-quality leather items, whether for their durability, finer quality, or luxurious appeal. Leather apparel and fashionable colors remain popular choices, with consumers drawn to the versatility and versatility of this material. Brands and designers have responded by offering a diverse range of products, from classic styles to statement pieces. The demand for sustainable and eco-friendly leather goods has also risen, with some manufacturers turning to plant-based materials and synthetic types such as polyurethane and polyvinyl chloride.

Brand awareness plays a significant role In the market, with many consumers willing to pay a premium for designer and branded clothes and accessories. World-renowned designers and fashion houses continue to dominate this space, offering a range of high-end leather products that cater to the needs of the UHNWIs (Ultra High Net Worth Individuals). The leather manufacturing industry has undergone significant changes in recent years, with the adoption of automated machinery and processing techniques enabling the production of complex designs and digital cutting. These advancements have led to increased efficiency and productivity, allowing manufacturers to meet the rising demand for leather consumer goods.

Leather consumer goods offer a range of benefits, including weather protection, breathability, and temperature-controlling properties. Proper care is essential to maintaIn the longevity and appearance of these items. Leather garments, shoes, luggage, wallets, belts, handbags, and other leather consumer goods are suitable for all seasons, making them a staple in many wardrobes. The leather business is not without its challenges, however. Negative effects on the environment and animal welfare concerns have led some consumers to seek out alternative materials. Animal cruelty is a growing concern for many, leading to a rise in demand for plant-based materials and synthetic leather.

Industrial constraints, such as limited availability of raw materials and increasing production costs, also pose challenges for manufacturers. Despite these challenges, the market continues to thrive, with leather remaining a popular choice for consumers seeking durable, high-quality, and fashionable items. From classic styles to innovative designs, the leather consumer goods market offers a diverse range of products that cater to the needs and preferences of consumers around the world. In conclusion, the market is driven by various factors, including living standards, fashion trends, and consumer preferences for high-quality, sustainable, and eco-friendly materials. Manufacturers continue to innovate and adapt to meet the changing needs of consumers, offering a range of products that cater to diverse tastes and budgets. The market is expected to continue growing, driven by the extensive usage of leather in various industries and the enduring appeal of this versatile and timeless material.

Market Scope

Report Coverage

Details

Page number

177

Base year

2023

Historic period

2018-2022

Forecast period

2024-2028

Growth momentum & CAGR

Accelerate at a CAGR of 6.78%

Market growth 2024-2028

USD 105.8 billion

Market structure

Fragmented

YoY growth 2023-2024(%)

6.24

Key countries

US, China, Japan, France, and UK

Competitive landscape

Leading Companies, Market Positioning of Companies, Competitive Strategies, and Industry Risks

Request Free Sample

What are the Key Data Covered in this Leather Goods Market Research and Growth Report?

  • CAGR of the Leather Goods industry during the forecast period
  • Detailed information on factors that will drive the growth and forecasting between 2024 and 2028
  • Precise estimation of the size of the market and its contribution of the industry in focus to the parent market
  • Accurate predictions about upcoming growth and trends and changes in consumer behaviour
  • Growth of the market across APAC, North America, Europe, South America, and Middle East and Africa
  • Thorough analysis of the market's competitive landscape and detailed information about companies
  • Comprehensive analysis of factors that will challenge the leather goods market growth of industry companies

We can help! Our analysts can customize this leather goods market research report to meet your requirements.

Get in touch

1 Executive Summary

  • 1.1 Market overview
    • Executive Summary - Chart on Market Overview
    • Executive Summary - Data Table on Market Overview
    • Executive Summary - Chart on Global Market Characteristics
    • Executive Summary - Chart on Market by Geography
    • Executive Summary - Chart on Market Segmentation by Product
    • Executive Summary - Chart on Market Segmentation by Distribution Channel
    • Executive Summary - Chart on Incremental Growth
    • Executive Summary - Data Table on Incremental Growth
    • Executive Summary - Chart on Company Market Positioning

2 Market Landscape

  • 2.1 Market ecosystem
    • Parent Market
    • Data Table on - Parent Market
  • 2.2 Market characteristics
    • Market characteristics analysis
  • 2.3 Value chain analysis
    • Value Chain Analysis

3 Market Sizing

  • 3.1 Market definition
    • Offerings of companies included in the market definition
  • 3.2 Market segment analysis
    • Market segments
  • 3.3 Market size 2023
    • 3.4 Market outlook: Forecast for 2023-2028
      • Chart on Global - Market size and forecast 2023-2028 ($ billion)
      • Data Table on Global - Market size and forecast 2023-2028 ($ billion)
      • Chart on Global Market: Year-over-year growth 2023-2028 (%)
      • Data Table on Global Market: Year-over-year growth 2023-2028 (%)

    4 Historic Market Size

    • 4.1 Global Leather Goods Market 2018 - 2022
      • Historic Market Size - Data Table on Global Leather Goods Market 2018 - 2022 ($ billion)
    • 4.2 Product segment analysis 2018 - 2022
      • Historic Market Size - Product Segment 2018 - 2022 ($ billion)
    • 4.3 Distribution Channel segment analysis 2018 - 2022
      • Historic Market Size - Distribution Channel Segment 2018 - 2022 ($ billion)
    • 4.4 Geography segment analysis 2018 - 2022
      • Historic Market Size - Geography Segment 2018 - 2022 ($ billion)
    • 4.5 Country segment analysis 2018 - 2022
      • Historic Market Size - Country Segment 2018 - 2022 ($ billion)

    5 Five Forces Analysis

    • 5.1 Five forces summary
      • Five forces analysis - Comparison between 2023 and 2028
    • 5.2 Bargaining power of buyers
      • Bargaining power of buyers - Impact of key factors 2023 and 2028
    • 5.3 Bargaining power of suppliers
      • Bargaining power of suppliers - Impact of key factors in 2023 and 2028
    • 5.4 Threat of new entrants
      • Threat of new entrants - Impact of key factors in 2023 and 2028
    • 5.5 Threat of substitutes
      • Threat of substitutes - Impact of key factors in 2023 and 2028
    • 5.6 Threat of rivalry
      • Threat of rivalry - Impact of key factors in 2023 and 2028
    • 5.7 Market condition
      • Chart on Market condition - Five forces 2023 and 2028

    6 Market Segmentation by Product

    • 6.1 Market segments
      • Chart on Product - Market share 2023-2028 (%)
      • Data Table on Product - Market share 2023-2028 (%)
    • 6.2 Comparison by Product
      • Chart on Comparison by Product
      • Data Table on Comparison by Product
    • 6.3 Footwear - Market size and forecast 2023-2028
      • Chart on Footwear - Market size and forecast 2023-2028 ($ billion)
      • Data Table on Footwear - Market size and forecast 2023-2028 ($ billion)
      • Chart on Footwear - Year-over-year growth 2023-2028 (%)
      • Data Table on Footwear - Year-over-year growth 2023-2028 (%)
    • 6.4 LBWP - Market size and forecast 2023-2028
      • Chart on LBWP - Market size and forecast 2023-2028 ($ billion)
      • Data Table on LBWP - Market size and forecast 2023-2028 ($ billion)
      • Chart on LBWP - Year-over-year growth 2023-2028 (%)
      • Data Table on LBWP - Year-over-year growth 2023-2028 (%)
    • 6.5 Others - Market size and forecast 2023-2028
      • Chart on Others - Market size and forecast 2023-2028 ($ billion)
      • Data Table on Others - Market size and forecast 2023-2028 ($ billion)
      • Chart on Others - Year-over-year growth 2023-2028 (%)
      • Data Table on Others - Year-over-year growth 2023-2028 (%)
    • 6.6 Market opportunity by Product
      • Market opportunity by Product ($ billion)
      • Data Table on Market opportunity by Product ($ billion)

    7 Market Segmentation by Distribution Channel

    • 7.1 Market segments
      • Chart on Distribution Channel - Market share 2023-2028 (%)
      • Data Table on Distribution Channel - Market share 2023-2028 (%)
    • 7.2 Comparison by Distribution Channel
      • Chart on Comparison by Distribution Channel
      • Data Table on Comparison by Distribution Channel
    • 7.3 Offline - Market size and forecast 2023-2028
      • Chart on Offline - Market size and forecast 2023-2028 ($ billion)
      • Data Table on Offline - Market size and forecast 2023-2028 ($ billion)
      • Chart on Offline - Year-over-year growth 2023-2028 (%)
      • Data Table on Offline - Year-over-year growth 2023-2028 (%)
    • 7.4 Online - Market size and forecast 2023-2028
      • Chart on Online - Market size and forecast 2023-2028 ($ billion)
      • Data Table on Online - Market size and forecast 2023-2028 ($ billion)
      • Chart on Online - Year-over-year growth 2023-2028 (%)
      • Data Table on Online - Year-over-year growth 2023-2028 (%)
    • 7.5 Market opportunity by Distribution Channel
      • Market opportunity by Distribution Channel ($ billion)
      • Data Table on Market opportunity by Distribution Channel ($ billion)

    8 Customer Landscape

    • 8.1 Customer landscape overview
      • Analysis of price sensitivity, lifecycle, customer purchase basket, adoption rates, and purchase criteria

    9 Geographic Landscape

    • 9.1 Geographic segmentation
      • Chart on Market share by geography 2023-2028 (%)
      • Data Table on Market share by geography 2023-2028 (%)
    • 9.2 Geographic comparison
      • Chart on Geographic comparison
      • Data Table on Geographic comparison
    • 9.3 APAC - Market size and forecast 2023-2028
      • Chart on APAC - Market size and forecast 2023-2028 ($ billion)
      • Data Table on APAC - Market size and forecast 2023-2028 ($ billion)
      • Chart on APAC - Year-over-year growth 2023-2028 (%)
      • Data Table on APAC - Year-over-year growth 2023-2028 (%)
    • 9.4 North America - Market size and forecast 2023-2028
      • Chart on North America - Market size and forecast 2023-2028 ($ billion)
      • Data Table on North America - Market size and forecast 2023-2028 ($ billion)
      • Chart on North America - Year-over-year growth 2023-2028 (%)
      • Data Table on North America - Year-over-year growth 2023-2028 (%)
    • 9.5 Europe - Market size and forecast 2023-2028
      • Chart on Europe - Market size and forecast 2023-2028 ($ billion)
      • Data Table on Europe - Market size and forecast 2023-2028 ($ billion)
      • Chart on Europe - Year-over-year growth 2023-2028 (%)
      • Data Table on Europe - Year-over-year growth 2023-2028 (%)
    • 9.6 South America - Market size and forecast 2023-2028
      • Chart on South America - Market size and forecast 2023-2028 ($ billion)
      • Data Table on South America - Market size and forecast 2023-2028 ($ billion)
      • Chart on South America - Year-over-year growth 2023-2028 (%)
      • Data Table on South America - Year-over-year growth 2023-2028 (%)
    • 9.7 Middle East and Africa - Market size and forecast 2023-2028
      • Chart on Middle East and Africa - Market size and forecast 2023-2028 ($ billion)
      • Data Table on Middle East and Africa - Market size and forecast 2023-2028 ($ billion)
      • Chart on Middle East and Africa - Year-over-year growth 2023-2028 (%)
      • Data Table on Middle East and Africa - Year-over-year growth 2023-2028 (%)
    • 9.8 US - Market size and forecast 2023-2028
      • Chart on US - Market size and forecast 2023-2028 ($ billion)
      • Data Table on US - Market size and forecast 2023-2028 ($ billion)
      • Chart on US - Year-over-year growth 2023-2028 (%)
      • Data Table on US - Year-over-year growth 2023-2028 (%)
    • 9.9 China - Market size and forecast 2023-2028
      • Chart on China - Market size and forecast 2023-2028 ($ billion)
      • Data Table on China - Market size and forecast 2023-2028 ($ billion)
      • Chart on China - Year-over-year growth 2023-2028 (%)
      • Data Table on China - Year-over-year growth 2023-2028 (%)
    • 9.10 Japan - Market size and forecast 2023-2028
      • Chart on Japan - Market size and forecast 2023-2028 ($ billion)
      • Data Table on Japan - Market size and forecast 2023-2028 ($ billion)
      • Chart on Japan - Year-over-year growth 2023-2028 (%)
      • Data Table on Japan - Year-over-year growth 2023-2028 (%)
    • 9.11 France - Market size and forecast 2023-2028
      • Chart on France - Market size and forecast 2023-2028 ($ billion)
      • Data Table on France - Market size and forecast 2023-2028 ($ billion)
      • Chart on France - Year-over-year growth 2023-2028 (%)
      • Data Table on France - Year-over-year growth 2023-2028 (%)
    • 9.12 UK - Market size and forecast 2023-2028
      • Chart on UK - Market size and forecast 2023-2028 ($ billion)
      • Data Table on UK - Market size and forecast 2023-2028 ($ billion)
      • Chart on UK - Year-over-year growth 2023-2028 (%)
      • Data Table on UK - Year-over-year growth 2023-2028 (%)
    • 9.13 Market opportunity by geography
      • Market opportunity by geography ($ billion)
      • Data Tables on Market opportunity by geography ($ billion)

    10 Drivers, Challenges, and Opportunity/Restraints

    • 10.1 Market drivers
      • 10.2 Market challenges
        • 10.3 Impact of drivers and challenges
          • Impact of drivers and challenges in 2023 and 2028
        • 10.4 Market opportunities/restraints

          11 Competitive Landscape

          • 11.1 Overview
            • 11.2 Competitive Landscape
              • Overview on criticality of inputs and factors of differentiation
            • 11.3 Landscape disruption
              • Overview on factors of disruption
            • 11.4 Industry risks
              • Impact of key risks on business

            12 Competitive Analysis

            • 12.1 Companies profiled
              • Companies covered
            • 12.2 Market positioning of companies
              • Matrix on companies position and classification
            • 12.3 Adidas AG
              • Adidas AG - Overview
              • Adidas AG - Business segments
              • Adidas AG - Key offerings
              • Adidas AG - Segment focus
            • 12.4 Bata
              • Bata - Overview
              • Bata - Product / Service
              • Bata - Key offerings
            • 12.5 Burberry Group Plc
              • Burberry Group Plc - Overview
              • Burberry Group Plc - Business segments
              • Burberry Group Plc - Key offerings
              • Burberry Group Plc - Segment focus
            • 12.6 Capri Holdings Ltd.
              • Capri Holdings Ltd. - Overview
              • Capri Holdings Ltd. - Business segments
              • Capri Holdings Ltd. - Key offerings
              • Capri Holdings Ltd. - Segment focus
            • 12.7 Chanel Ltd.
              • Chanel Ltd. - Overview
              • Chanel Ltd. - Product / Service
              • Chanel Ltd. - Key offerings
            • 12.8 Compagnie Financiere Richemont SA
              • Compagnie Financiere Richemont SA - Overview
              • Compagnie Financiere Richemont SA - Business segments
              • Compagnie Financiere Richemont SA - Key news
              • Compagnie Financiere Richemont SA - Key offerings
              • Compagnie Financiere Richemont SA - Segment focus
            • 12.9 Giorgio Armani S.p.A.
              • Giorgio Armani S.p.A. - Overview
              • Giorgio Armani S.p.A. - Product / Service
              • Giorgio Armani S.p.A. - Key offerings
            • 12.10 GLobalLeathers
              • GLobalLeathers - Overview
              • GLobalLeathers - Product / Service
              • GLobalLeathers - Key offerings
            • 12.11 Hermes International SA
              • Hermes International SA - Overview
              • Hermes International SA - Business segments
              • Hermes International SA - Key news
              • Hermes International SA - Key offerings
              • Hermes International SA - Segment focus
            • 12.12 Kering SA
              • Kering SA - Overview
              • Kering SA - Business segments
              • Kering SA - Key news
              • Kering SA - Key offerings
              • Kering SA - Segment focus
            • 12.13 LVMH Group.
              • LVMH Group. - Overview
              • LVMH Group. - Business segments
              • LVMH Group. - Key news
              • LVMH Group. - Key offerings
              • LVMH Group. - Segment focus
            • 12.14 Mulberry Group Plc
              • Mulberry Group Plc - Overview
              • Mulberry Group Plc - Business segments
              • Mulberry Group Plc - Key offerings
              • Mulberry Group Plc - Segment focus
            • 12.15 Nike Inc.
              • Nike Inc. - Overview
              • Nike Inc. - Business segments
              • Nike Inc. - Key news
              • Nike Inc. - Key offerings
              • Nike Inc. - Segment focus
            • 12.16 Prada S.p.A
              • Prada S.p.A - Overview
              • Prada S.p.A - Product / Service
              • Prada S.p.A - Key offerings
            • 12.17 PUMA SE
              • PUMA SE - Overview
              • PUMA SE - Business segments
              • PUMA SE - Key news
              • PUMA SE - Key offerings
              • PUMA SE - Segment focus

            13 Appendix

            • 13.1 Scope of the report
              • 13.2 Inclusions and exclusions checklist
                • Inclusions checklist
                • Exclusions checklist
              • 13.3 Currency conversion rates for US$
                • Currency conversion rates for US$
              • 13.4 Research methodology
                • Research methodology
              • 13.5 Data procurement
                • Information sources
              • 13.6 Data validation
                • Data validation
              • 13.7 Validation techniques employed for market sizing
                • Validation techniques employed for market sizing
              • 13.8 Data synthesis
                • Data synthesis
              • 360 degree market analysis
                • 360 degree market analysis
              • 13.10 List of abbreviations
                • List of abbreviations

              Research Methodology

              Technavio presents a detailed picture of the market by way of study, synthesis, and summation of data from multiple sources. The analysts have presented the various facets of the market with a particular focus on identifying the key industry influencers. The data thus presented is comprehensive, reliable, and the result of extensive research, both primary and secondary.

              INFORMATION SOURCES

              Primary sources

              • Manufacturers and suppliers
              • Channel partners
              • Industry experts
              • Strategic decision makers

              Secondary sources

              • Industry journals and periodicals
              • Government data
              • Financial reports of key industry players
              • Historical data
              • Press releases

              DATA ANALYSIS

              Data Synthesis

              • Collation of data
              • Estimation of key figures
              • Analysis of derived insights

              Data Validation

              • Triangulation with data models
              • Reference against proprietary databases
              • Corroboration with industry experts

              REPORT WRITING

              Qualitative

              • Market drivers
              • Market challenges
              • Market trends
              • Five forces analysis

              Quantitative

              • Market size and forecast
              • Market segmentation
              • Geographical insights
              • Competitive landscape

              Interested in this report?

              Get your sample now to see our research methodology and insights!

              Download Now

              Frequently Asked Questions

              Leather Goods market growth will increase by $ 105.8 bn during 2024-2028.

              The Leather Goods market is expected to grow at a CAGR of 6.78% during 2024-2028.

              Leather Goods market is segmented by Product( Footwear, LBWP, Others) Distribution Channel( Offline, Online, Europe, South America, MEA)

              Adidas AG, Bata, Burberry Group Plc, Capri Holdings Ltd., Chanel Ltd., Compagnie Financiere Richemont SA, Dolce and Gabbana S.r.l., Giorgio Armani S.p.A., GLobalLeathers, Hermes International SA, Kering SA, LVMH Group., Mulberry Group Plc, Nike Inc., Prada S.p.A, PUMA SE, Ralph Lauren Corp., Samsonite International S.A., Tapestry Inc., VF Corp. are a few of the key vendors in the Leather Goods market.

              APAC will register the highest growth rate of 49% among the other regions. Therefore, the Leather Goods market in APAC is expected to garner significant business opportunities for the vendors during the forecast period.

              US, China, Japan, France, UK

              • Innovative marketing strategiesThe fashion industry has been experiencing rapid advances over the last two decades is the driving factor this market.
              • mainly due to the increasing number of fashion-conscious customers is the driving factor this market.
              • especially in developing regions. Most vendors that offer luxury leather goods is the driving factor this market.
              • such as LVMH is the driving factor this market.
              • Hermes is the driving factor this market.
              • and CHANEL SAS (CHANEL) is the driving factor this market.
              • advertise their products through newspapers and fashion magazines instead of television. Manufacturers of leather goods adopt different marketing campaigns and strategies to expand their customer base. Celebrity endorsement is a popular marketing tool used by vendors to build their brand image and increase the sales of luxury leather goods. For instance is the driving factor this market.
              • the promotional strategies employed by LVMH for its products include endorsements by celebrities such as Jennifer Lopez is the driving factor this market.
              • Kate Moss is the driving factor this market.
              • Scarlett Johansson is the driving factor this market.
              • and Uma Thurman. Louis Vuitton sponsors mega sporting events is the driving factor this market.
              • such as motorsports and yachting. Similarly is the driving factor this market.
              • the leather goods offered by CHANEL are endorsed by Keira Knightley is the driving factor this market.
              • Vanessa Paradis is the driving factor this market.
              • and Nicole Kidman. Online advertising is also an essential part of marketing strategies. Vendors often sign multiyear endorsement agreements with high-profile celebrities to enhance their brand value. These marketing initiatives increase the demand for leather goods. is the driving factor this market.

              The Leather Goods market vendors should focus on grabbing business opportunities from the Footwear segment as it accounted for the largest market share in the base year.