Liquid Applied Membrane Market for Construction Industry Market Analysis, Size, and Forecast 2024-2028: North America (US and Canada), Europe (France, Germany, Italy, and UK), Middle East and Africa (Egypt, KSA, Oman, and UAE), APAC (China, India, and Japan), South America (Argentina and Brazil), and Rest of World (ROW)

Liquid Applied Membrane Market for Construction Industry Market Analysis, Size, and Forecast 2024-2028:
North America (US and Canada), Europe (France, Germany, Italy, and UK), Middle East and Africa (Egypt, KSA, Oman, and UAE), APAC (China, India, and Japan), South America (Argentina and Brazil), and Rest of World (ROW)

Published: Jan 2024 175 Pages SKU: IRTNTR77334

Market Overview at a Glance

$3.65 B
Market Opportunity
6.14%
CAGR
5.33
YoY growth 2023-2024(%)

Liquid Applied Membrane Market for Construction Industry Size 2024-2028

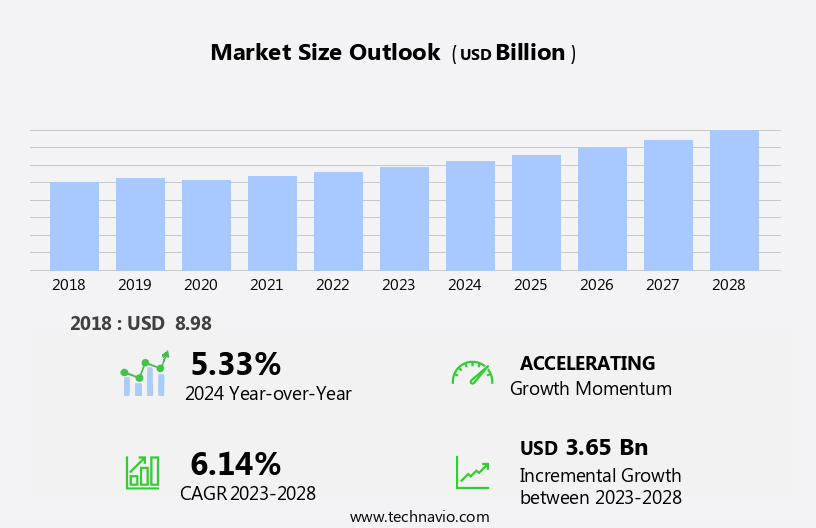
The liquid applied membrane market for construction industry size is forecast to increase by USD 3.65 billion, at a CAGR of 6.14% between 2023 and 2028.

  • The Liquid Applied Membrane Market in the Construction Industry is experiencing significant growth due to the increasing demand for energy-efficient buildings. This trend is driven by stringent energy regulations and growing awareness of sustainable construction practices. Additionally, advancements in robotic application systems and automatic spray technologies have streamlined the installation process, making Liquid Applied Membranes an attractive option for construction projects. However, the market faces challenges in the form of higher initial material and installation costs when compared to traditional methods. These costs may hinder the widespread adoption of liquid applied membranes, particularly in price-sensitive markets. To capitalize on market opportunities, construction companies can focus on offering value-added services, such as energy consulting and long-term maintenance contracts, to offset the higher upfront costs.
  • Additionally, ongoing research and development efforts aimed at reducing material costs and improving application efficiency will be crucial for market growth. Companies seeking to navigate these challenges effectively should also explore strategic partnerships and collaborations to share resources and expertise, ultimately driving innovation and competitiveness in the market.

What will be the Size of the Liquid Applied Membrane Market for Construction Industry Market during the forecast period?

Liquid Applied Membrane Market for Construction Industry Market Size

Explore in-depth regional segment analysis with market size data - historical 2018-2022 and forecasts 2024-2028 - in the full report.  
Request Free Sample

Liquid applied membranes have become a significant solution in the construction industry, offering versatility and effectiveness in various applications. These membranes, which include roofing membranes and foundation waterproofing, have evolved to cater to the ever-changing market dynamics. Acrylic membranes, for instance, have gained popularity due to their high tensile strength and chemical resistance. Moreover, the continuous pursuit of energy efficiency and environmental sustainability has led to the emergence of green building materials and low-volatile organic compound (VOC) coatings. The use of recycled materials and reinforced membranes has also become increasingly common in the industry. In commercial buildings, seamless membranes have gained traction for their improved service life and tear resistance.

Silicone membranes and polymer-modified bitumen have been favored for their adhesion strength and moisture vapor transmission properties, respectively. Application methods have also evolved, with roller application and brush application offering cost-effective solutions, while spray application and trowel application providing more precise and uniform coverage. Industry standards and environmental regulations continue to shape the market, with a focus on reducing waste and improving VOC emissions. The ongoing unfolding of market activities reveals a trend towards high-performance membranes, offering thermal insulation, UV resistance, and crack bridging properties. Self-adhering membranes and primer coatings have also gained popularity for their ease of application and improved joint sealing capabilities.

Infrastructure projects and wall cladding applications have further expanded the market for liquid applied membranes, with the need for chemical resistance, crack bridging, and application equipment becoming increasingly important considerations. Building codes and residential buildings have also adopted these membranes for their durability and cost-effectiveness. Overall, the liquid applied membrane market continues to evolve, with ongoing research and development leading to new innovations and applications across various sectors. The market's continuous dynamism underscores the importance of staying informed and adaptable to meet the evolving needs of the construction industry.

How is this Liquid Applied Membrane for Construction Industry Industry segmented?

The liquid applied membrane for construction industry industry research report provides comprehensive data (region-wise segment analysis), with forecasts and estimates in "USD billion" for the period 2024-2028, as well as historical data from 2018-2022 for the following segments.

  • Application
    • Roofing and walls
    • Building structures
    • Industrial water and wastewater management
    • Landfills and tunnels
  • End-user
    • Commercial
    • Public infrastructure
    • Residential
  • Type
    • Polyurethane
    • Bituminous
    • Cementitious
    • Elastomeric
    • Acrylic
  • Technology
    • Solvent-based
    • Water-based
  • Geography
    • North America
      • US
      • Canada
    • Europe
      • France
      • Germany
      • Italy
      • UK
    • Middle East and Africa
      • Egypt
      • KSA
      • Oman
      • UAE
    • APAC
      • China
      • India
      • Japan
    • South America
      • Argentina
      • Brazil
    • Rest of World (ROW)

    By Application Insights

    The roofing and walls segment is estimated to witness significant growth during the forecast period.

    The global liquid applied membrane market in the construction industry is gaining momentum due to the numerous benefits these membranes offer over traditional roofing and wall systems. Liquid applied membranes are applied in a liquid form directly to surfaces, creating a seamless and continuous barrier against water, moisture, and other elements. This segment is vital for ensuring the structural integrity and extended service life of roofs and walls in various commercial and residential projects. Compared to conventional methods, liquid applied membranes provide several advantages. They eliminate joints and seams, which are common sources of leakage in other systems.

    These membranes offer excellent puncture resistance, thermal insulation, and energy efficiency, making them an attractive option for green building materials. Additionally, they are available in various types, such as high-performance membranes, asphalt membranes, acrylic membranes, silicone membranes, and polyurethane membranes, among others. Moreover, liquid applied membranes can be applied using various techniques, including roller application, trowel application, brush application, and spray application. They are also available in water-based and solvent-based coatings, catering to different environmental regulations and industry standards. Furthermore, these membranes can be reinforced with reinforcement fabrics and self-adhering, providing enhanced tear resistance and adhesion strength. Liquid applied membranes also offer cost-effective solutions through waste reduction and life-cycle cost analysis.

    They are available in recycled materials and can be easily repaired and maintained, reducing the need for frequent replacements. Additionally, they offer excellent UV resistance, moisture vapor transmission, and crack bridging properties, making them suitable for various infrastructure projects. In conclusion, the liquid applied membrane market for construction industry is evolving, with a focus on innovation and sustainability. These membranes offer several advantages, including seamless application, durability, energy efficiency, and cost-effectiveness, making them an attractive option for various construction projects.

    Liquid Applied Membrane Market for Construction Industry Market Size

    Request Free Sample

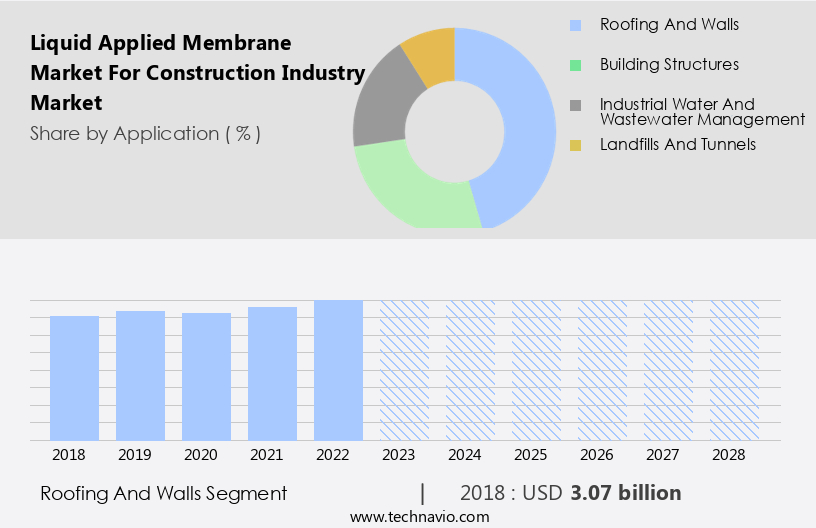
    The Roofing and walls segment was valued at USD 3.07 billion in 2018 and showed a gradual increase during the forecast period.

    Regional Analysis

    APAC is estimated to contribute 38% to the growth of the global market during the forecast period.Technavio's analysts have elaborately explained the regional trends and drivers that shape the market during the forecast period.

    Liquid Applied Membrane Market for Construction Industry Market Share by Geography

     Request Free Sample

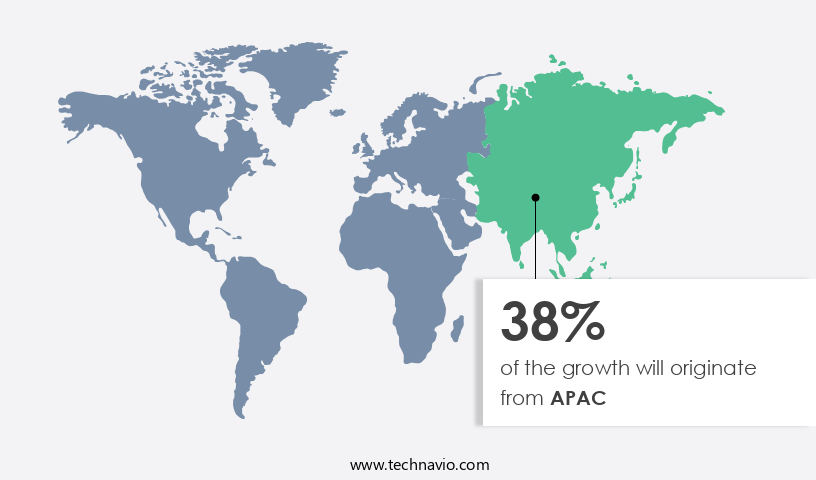
    The liquid applied membrane market in the construction industry is experiencing notable expansion in the Asia-Pacific (APAC) region. These membranes are increasingly adopted for various applications, such as roofing, waterproofing, and building exteriors, due to their protective qualities and ease of application. The primary driver of market growth in APAC is the region's rapid urbanization and infrastructure development, particularly in countries like China, India, and Japan. As construction of residential, commercial, and industrial buildings surges in these countries, there is a heightened demand for robust waterproofing solutions to shield structures from water damage. Liquid applied membranes offer advantages such as shorter curing times, waste reduction, and improved energy efficiency compared to traditional solvent-based coatings.

    Additionally, they exhibit desirable properties like puncture resistance, thermal insulation, moisture vapor transmission control, and chemical resistance. High-performance membranes, including acrylic, silicone, polyurethane, and polymer-modified bitumen, cater to diverse construction needs. Application methods range from roller and trowel to brush, spray, and trowel. Industry standards and environmental regulations ensure the use of low-voc coatings, recycled materials, and reinforced membranes for enhanced sustainability. Seamless membranes, self-adhering membranes, and primer coatings are essential components of the system. Building codes and joint sealing techniques further ensure the durability and longevity of the structures. Overall, the liquid applied membrane market in the construction industry is poised for continued growth in APAC, driven by the region's construction boom and the demand for advanced, efficient, and eco-friendly waterproofing solutions.

    Market Dynamics

    The global liquid applied membrane market (construction) is experiencing significant growth, driven by increasing demand for effective waterproofing membranes in diverse applications. The expanding liquid applied membrane market size (construction) and positive liquid applied membrane market trends (construction) highlight the market's dynamism, fueled by strong liquid applied membrane market growth drivers. Liquid applied membranes (LAM), including versatile polyurethane membranes, acrylic membranes, bituminous membranes, and robust polyurea membranes, are widely utilized. These solutions are crucial for roof waterproofing, basement waterproofing, foundation waterproofing, and wet room waterproofing in both new construction projects and renovation & refurbishment initiatives. Innovations in polymer technology (LAM) facilitate seamless application technology and the development of rapid curing liquid membranes. The increasing focus on sustainability also boosts the adoption of VOC-compliant membranes, further solidifying LAM's position in the construction industry.

    Our researchers analyzed the data with 2023 as the base year, along with the key drivers, trends, and challenges. A holistic analysis of drivers will help companies refine their marketing strategies to gain a competitive advantage.

    What are the key market drivers leading to the rise in the adoption of Liquid Applied Membrane for Construction Industry Industry?

    • The surge in demand for energy-efficient buildings is the primary catalyst driving growth in the market. 
    • The construction industry is undergoing a transformation with a focus on sustainability and energy efficiency. This shift is driven by the increasing demand for energy-efficient buildings, which aim to reduce energy consumption and minimize carbon footprints. Liquid applied membranes are playing a pivotal role in this transition. These membranes offer a seamless, durable, and protective layer for various building surfaces, contributing to enhanced insulation, optimized energy usage, and improved building performance. Liquid applied membranes come in different types, including high-performance membranes and asphalt membranes. High-performance membranes provide excellent puncture resistance, tear resistance, and moisture vapor transmission control.
    • They are ideal for applications where durability and long-term performance are crucial. Asphalt membranes, on the other hand, offer excellent thermal insulation and are widely used in low-slope roofing applications. Solvent-based coatings, a traditional alternative to liquid applied membranes, have higher curing times and generate more waste. In contrast, liquid applied membranes have shorter curing times and produce minimal waste, making them a more eco-friendly and cost-effective choice. Moreover, the use of liquid applied membranes can lead to significant energy savings over the building's life cycle due to their insulating properties. In summary, the liquid applied membrane market for the construction industry is experiencing substantial growth due to the increasing demand for energy-efficient buildings.
    • These membranes offer numerous benefits, including improved insulation, optimized energy usage, and reduced waste, making them a preferred choice for modern construction projects.

    What are the market trends shaping the Liquid Applied Membrane for Construction Industry Industry?

    • The convergence of robotic application systems and automatic spray technologies represents a significant market trend. Advancements in these technologies are driving innovation and efficiency in various industries.
    • The global market for liquid applied membranes in the construction industry has witnessed notable advancements, driven by technological innovations in application systems. Robotic application systems and automatic spraying technologies have gained prominence, streamlining the process of applying membranes onto various surfaces. These systems, equipped with sophisticated programming software and sensors, ensure precise and consistent application, thereby enhancing project outcomes. Acrylic membranes, polymer-modified bitumen, silicone membranes, and specialty membranes are popular choices for roofing and foundation waterproofing applications. Surface preparation plays a crucial role in ensuring the longevity and effectiveness of these membranes. Low-voc coatings, a sustainable choice for green building materials, are increasingly being adopted due to their minimal volatile organic compound emissions.
    • Tensile strength, a critical factor in membrane selection, is a key consideration for commercial buildings. Roller application and trowel application techniques are also used, depending on the specific project requirements. Overall, the liquid applied membrane market is characterized by continuous innovation and a focus on delivering high-performance, reliable, and cost-effective solutions for the construction industry.

    What challenges does the Liquid Applied Membrane for Construction Industry Industry face during its growth?

    • The higher initial material and installation costs relative to traditional methods pose a significant challenge to industry growth. This issue, which is mandatory for businesses to address in a professional and knowledgeable manner, can hinder the expansion and competitiveness of companies in the sector. 
    • The Liquid Applied Membrane market in the construction industry experiences growth driven by the membranes' superior waterproofing and protective properties. However, the market encounters challenges due to the higher initial material and installation costs compared to traditional methods. Liquid Applied Membranes necessitate specialized liquid compounds, primers, and coatings, which can be more expensive than conventional waterproofing materials. Furthermore, the application process may require additional equipment and tools, increasing upfront expenses. Industry standards and environmental regulations also impact the market. Adherence to these regulations can add to the cost of production and installation. Liquid Applied Membranes offer benefits such as crack bridging, chemical resistance, and UV resistance, making them an attractive option for wall cladding and other protective applications.
    • Environmental consciousness is a significant factor influencing the market. The use of recycled materials in the production of liquid applied membranes is gaining popularity due to their reduced environmental impact. The application methods, such as brush or spray application, offer flexibility and ease of use. Despite the initial high costs, the long-term benefits of Liquid Applied Membranes, including durability and low maintenance, make them a cost-effective solution for construction projects. The market is expected to continue growing as the construction industry seeks innovative and effective waterproofing and protective solutions.

    Exclusive Customer Landscape

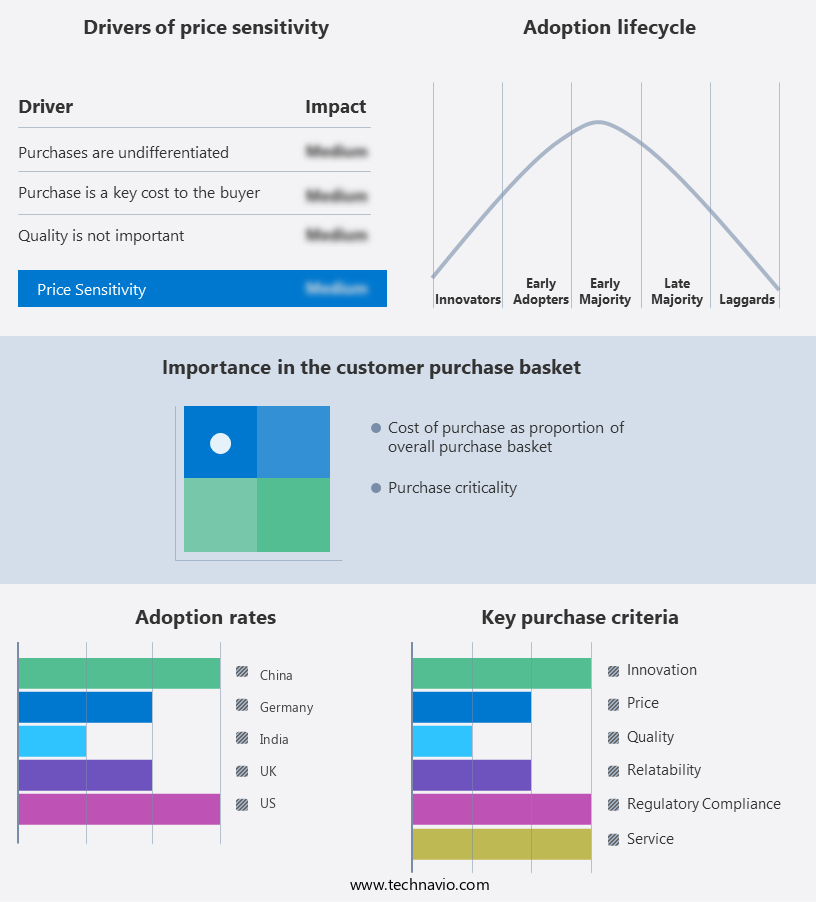
    The liquid applied membrane market for construction industry market forecasting report includes the adoption lifecycle of the market, covering from the innovator's stage to the laggard's stage. It focuses on adoption rates in different regions based on penetration. Furthermore, the liquid applied membrane market for construction industry market report also includes key purchase criteria and drivers of price sensitivity to help companies evaluate and develop their market growth analysis strategies.

    Liquid Applied Membrane Market for Construction Industry Market Share by Geography

     Customer Landscape

    Key Companies & Market Insights

    Companies are implementing various strategies, such as strategic alliances, liquid applied membrane market for construction industry market forecast, partnerships, mergers and acquisitions, geographical expansion, and product/service launches, to enhance their presence in the industry.

    Alchimica - The construction industry benefits from the company's innovative liquid applied membrane solutions, such as MasterSeal 730 UVS. This high-performance waterproofing membrane utilizes pre-applied, high-density polyethylene (HDPE) sheets with a unique pressure-sensitive adhesive and protective coating. The membrane ensures excellent adhesion to concrete surfaces without the need for additional protective screeds.

    The industry research and growth report includes detailed analyses of the competitive landscape of the market and information about key companies, including:

    • Alchimica
    • BASF SE
    • Bauder Ltd.
    • Berkshire Hathaway Inc.
    • Carlisle Companies Inc.
    • Compagnie de Saint Gobain
    • Dow Chemical Co.
    • Follmann Chemie GmbH
    • Fosroc International Ltd.
    • H.B. Fuller Co.
    • IBG Industrie Beteiligungs Gesellschaft mbH and Co. KG
    • IKO Industries Ltd.
    • Mapei SpA
    • Nippon Paint Holdings Co. Ltd.
    • RPM International Inc.
    • Sika AG
    • SOPREMA SAS
    • Standard Industries Inc.
    • Western Colloid
    • Pidilite Industries Ltd.

    Qualitative and quantitative analysis of companies has been conducted to help clients understand the wider business environment as well as the strengths and weaknesses of key industry players. Data is qualitatively analyzed to categorize companies as pure play, category-focused, industry-focused, and diversified; it is quantitatively analyzed to categorize companies as dominant, leading, strong, tentative, and weak.

    Recent Development and News in Liquid Applied Membrane Market For Construction Industry Market

    • In January 2024, Sika AG, a leading specialty chemical company, announced the launch of its new liquid applied membrane product, Sikalastik 611, designed for roofing and waterproofing applications in the construction industry (Sika AG Press Release, 2024). This innovative product offers enhanced durability and improved sustainability, making it a significant addition to the company's membrane portfolio.
    • In March 2024, BASF SE and Covestro AG, two major chemical companies, entered into a strategic partnership to jointly develop and produce liquid applied membranes using renewable raw materials (BASF SE Press Release, 2024). This collaboration aims to reduce the environmental footprint of membrane production and cater to the growing demand for eco-friendly construction solutions.
    • In May 2024, H.B. Fuller Company, a global adhesives provider, acquired Permabond LLC, a leading manufacturer of structural bonding adhesives and sealants, including liquid applied membranes (H.B. Fuller Company Press Release, 2024). This acquisition strengthened H.B. Fuller's position in the construction industry and expanded its product offerings, providing a broader range of solutions for customers.
    • In April 2025, the European Union passed the new Construction Products Regulation (CPR) for liquid applied membranes, which sets stricter requirements for health, safety, and environmental performance (European Commission Press Release, 2025). This regulation will drive innovation and improvements in the production and application of liquid applied membranes, ensuring better quality and sustainability in the construction industry.

    Research Analyst Overview

    • In the construction industry, Liquid Applied Membranes (LAMs) have gained significant traction as an effective solution for preventing moisture ingress and ensuring health and safety. Project management teams increasingly prioritize risk assessment and supply chain management when considering LAMs for their construction projects. Bid specifications require careful attention to application temperature, membrane thickness, and technical assistance during the contract negotiation phase. Industry innovations, such as technology advancements and performance guarantees, are driving the market forward. Quality control measures, including bond strength testing, inspection procedures, and material data sheets, are essential for ensuring successful LAM installations.
    • Competitor analysis and environmental impact assessments are also crucial factors in the decision-making process. UV degradation, puncture resistance testing, and substrate compatibility are essential considerations for assessing LAMs' long-term performance. Contractors must also address problem-solving, thermal aging, and safety data sheets during the project scheduling phase. Cost estimation, training programs, and customer support are essential for managing the LAM project's financial and logistical aspects. Installation guidelines, failure analysis, and technical specifications are vital for ensuring a successful project outcome. Regardless of the challenges, the LAM market continues to evolve, driven by ongoing advancements in technology and a commitment to maintaining standards compliance.

    Dive into Technavio's robust research methodology, blending expert interviews, extensive data synthesis, and validated models for unparalleled Liquid Applied Membrane Market for Construction Industry Market insights. See full methodology.

    Market Scope

    Report Coverage

    Details

    Page number

    175

    Base year

    2023

    Historic period

    2018-2022

    Forecast period

    2024-2028

    Growth momentum & CAGR

    Accelerate at a CAGR of 6.14%

    Market growth 2024-2028

    USD 3.65 billion

    Market structure

    Fragmented

    YoY growth 2023-2024(%)

    5.33

    Key countries

    US, China, India, Germany, and UK

    Competitive landscape

    Leading Companies, Market Positioning of Companies, Competitive Strategies, and Industry Risks

    Request Free Sample

    What are the Key Data Covered in this Liquid Applied Membrane Market for Construction Industry Market Research and Growth Report?

    • CAGR of the Liquid Applied Membrane for Construction Industry industry during the forecast period
    • Detailed information on factors that will drive the growth and forecasting between 2024 and 2028
    • Precise estimation of the size of the market and its contribution of the industry in focus to the parent market
    • Accurate predictions about upcoming growth and trends and changes in consumer behaviour
    • Growth of the market across APAC, North America, Europe, South America, and Middle East and Africa
    • Thorough analysis of the market's competitive landscape and detailed information about companies
    • Comprehensive analysis of factors that will challenge the liquid applied membrane market for construction industry market growth of industry companies

    We can help! Our analysts can customize this liquid applied membrane market for construction industry market research report to meet your requirements.

    Get in touch

    1 Executive Summary

    • 1.1 Market overview
      • Exhibit 01: Executive Summary – Chart on Market Overview
      • Exhibit 02: Executive Summary – Data Table on Market Overview
      • Exhibit 03: Executive Summary – Chart on Global Market Characteristics
      • Exhibit 04: Executive Summary – Chart on Market by Geography
      • Exhibit 05: Executive Summary – Chart on Market Segmentation by Application
      • Exhibit 06: Executive Summary – Chart on Market Segmentation by End-user
      • Exhibit 07: Executive Summary – Chart on Incremental Growth
      • Exhibit 08: Executive Summary – Data Table on Incremental Growth
      • Exhibit 09: Executive Summary – Chart on Vendor Market Positioning

    2 Market Landscape

    • 2.1 Market ecosystem
      • Exhibit 10: Parent market
      • Exhibit 11: Market Characteristics

    3 Market Sizing

    • 3.1 Market definition
      • Exhibit 12: Offerings of vendors included in the market definition
    • 3.2 Market segment analysis
      • Exhibit 13: Market segments
    • 3.3 Market size 2023
      • 3.4 Market outlook: Forecast for 2023-2028
        • Exhibit 14: Chart on Global - Market size and forecast 2023-2028 ($ million)
        • Exhibit 15: Data Table on Global - Market size and forecast 2023-2028 ($ million)
        • Exhibit 16: Chart on Global Market: Year-over-year growth 2023-2028 (%)
        • Exhibit 17: Data Table on Global Market: Year-over-year growth 2023-2028 (%)

      4 Historic Market Size

      • 4.1 Global liquid applied membrane market for construction industry market 2018 - 2022
        • Exhibit 18: Historic Market Size – Data Table on global liquid applied membrane market for construction industry market 2018 - 2022 ($ million)
      • 4.2 Application Segment Analysis 2018 - 2022
        • Exhibit 19: Historic Market Size – Application Segment 2018 - 2022 ($ million)
      • 4.3 End-user Segment Analysis 2018 - 2022
        • Exhibit 20: Historic Market Size – End-user Segment 2018 - 2022 ($ million)
      • 4.4 Geography Segment Analysis 2018 - 2022
        • Exhibit 21: Historic Market Size – Geography Segment 2018 - 2022 ($ million)
      • 4.5 Country Segment Analysis 2018 - 2022
        • Exhibit 22: Historic Market Size – Country Segment 2018 - 2022 ($ million)

      5 Five Forces Analysis

      • 5.1 Five forces summary
        • Exhibit 23: Five forces analysis - Comparison between 2023 and 2028
      • 5.2 Bargaining power of buyers
        • Exhibit 24: Chart on Bargaining power of buyers – Impact of key factors 2023 and 2028
      • 5.3 Bargaining power of suppliers
        • Exhibit 25: Bargaining power of suppliers – Impact of key factors in 2023 and 2028
      • 5.4 Threat of new entrants
        • Exhibit 26: Threat of new entrants – Impact of key factors in 2023 and 2028
      • 5.5 Threat of substitutes
        • Exhibit 27: Threat of substitutes – Impact of key factors in 2023 and 2028
      • 5.6 Threat of rivalry
        • Exhibit 28: Threat of rivalry – Impact of key factors in 2023 and 2028
      • 5.7 Market condition
        • Exhibit 29: Chart on Market condition - Five forces 2023 and 2028

      6 Market Segmentation by Application

      • 6.1 Market segments
        • Chart on Application - Market share (2023-2028) (%)
        • Data Table on Application - Market share (2023-2028) (%)
      • 6.2 Comparison by Application
        • Chart on Comparison by Application
        • Data Table on Comparison by Application
      • 6.3 Roofing and walls - Market size and forecast (2023-2028)
        • Chart on Roofing and walls - Market size and forecast (2023-2028) ($ million)
        • Data Table on Roofing and walls - Market size and forecast (2023-2028) ($ million)
        • Chart on Roofing and walls - Year-over-year growth (2023-2028) (%)
        • Data Table on Roofing and walls - Year-over-year growth (2023-2028) (%)
      • 6.4 Building structures - Market size and forecast (2023-2028)
        • Chart on Building structures - Market size and forecast (2023-2028) ($ million)
        • Data Table on Building structures - Market size and forecast (2023-2028) ($ million)
        • Chart on Building structures - Year-over-year growth (2023-2028) (%)
        • Data Table on Building structures - Year-over-year growth (2023-2028) (%)
      • 6.5 Industrial water and wastewater management - Market size and forecast (2023-2028)
        • Chart on Industrial water and wastewater management - Market size and forecast (2023-2028) ($ million)
        • Data Table on Industrial water and wastewater management - Market size and forecast (2023-2028) ($ million)
        • Chart on Industrial water and wastewater management - Year-over-year growth (2023-2028) (%)
        • Data Table on Industrial water and wastewater management - Year-over-year growth (2023-2028) (%)
      • 6.6 Landfills and tunnels - Market size and forecast (2023-2028)
        • Chart on Landfills and tunnels - Market size and forecast (2023-2028) ($ million)
        • Data Table on Landfills and tunnels - Market size and forecast (2023-2028) ($ million)
        • Chart on Landfills and tunnels - Year-over-year growth (2023-2028) (%)
        • Data Table on Landfills and tunnels - Year-over-year growth (2023-2028) (%)
      • 6.7 Market opportunity by Application
        • Market opportunity by Application ($ million)
        • Data Table on Market opportunity by Application ($ million)

      7 Market Segmentation by End-user

      • 7.1 Market segments
        • Chart on End-user - Market share (2023-2028) (%)
        • Data Table on End-user - Market share (2023-2028) (%)
      • 7.2 Comparison by End-user
        • Chart on Comparison by End-user
        • Data Table on Comparison by End-user
      • 7.3 Commercial - Market size and forecast (2023-2028)
        • Chart on Commercial - Market size and forecast (2023-2028) ($ million)
        • Data Table on Commercial - Market size and forecast (2023-2028) ($ million)
        • Chart on Commercial - Year-over-year growth (2023-2028) (%)
        • Data Table on Commercial - Year-over-year growth (2023-2028) (%)
      • 7.4 Public infrastructure - Market size and forecast (2023-2028)
        • Chart on Public infrastructure - Market size and forecast (2023-2028) ($ million)
        • Data Table on Public infrastructure - Market size and forecast (2023-2028) ($ million)
        • Chart on Public infrastructure - Year-over-year growth (2023-2028) (%)
        • Data Table on Public infrastructure - Year-over-year growth (2023-2028) (%)
      • 7.5 Residential - Market size and forecast (2023-2028)
        • Chart on Residential - Market size and forecast (2023-2028) ($ million)
        • Data Table on Residential - Market size and forecast (2023-2028) ($ million)
        • Chart on Residential - Year-over-year growth (2023-2028) (%)
        • Data Table on Residential - Year-over-year growth (2023-2028) (%)
      • 7.6 Market opportunity by End-user
        • Market opportunity by End-user ($ million)
        • Data Table on Market opportunity by End-user ($ million)

      8 Market Segmentation by Type

      • 8.1 Market segments
        • Chart on Type - Market share (2023-2028) (%)
        • Data Table on Type - Market share (2023-2028) (%)
      • 8.2 Comparison by Type
        • Chart on Comparison by Type
        • Data Table on Comparison by Type
      • 8.3 Polyurethane - Market size and forecast (2023-2028)
        • Chart on Polyurethane - Market size and forecast (2023-2028) ($ million)
        • Data Table on Polyurethane - Market size and forecast (2023-2028) ($ million)
        • Chart on Polyurethane - Year-over-year growth (2023-2028) (%)
        • Data Table on Polyurethane - Year-over-year growth (2023-2028) (%)
      • 8.4 Bituminous - Market size and forecast (2023-2028)
        • Chart on Bituminous - Market size and forecast (2023-2028) ($ million)
        • Data Table on Bituminous - Market size and forecast (2023-2028) ($ million)
        • Chart on Bituminous - Year-over-year growth (2023-2028) (%)
        • Data Table on Bituminous - Year-over-year growth (2023-2028) (%)
      • 8.5 Cementitious - Market size and forecast (2023-2028)
        • Chart on Cementitious - Market size and forecast (2023-2028) ($ million)
        • Data Table on Cementitious - Market size and forecast (2023-2028) ($ million)
        • Chart on Cementitious - Year-over-year growth (2023-2028) (%)
        • Data Table on Cementitious - Year-over-year growth (2023-2028) (%)
      • 8.6 Elastomeric - Market size and forecast (2023-2028)
        • Chart on Elastomeric - Market size and forecast (2023-2028) ($ million)
        • Data Table on Elastomeric - Market size and forecast (2023-2028) ($ million)
        • Chart on Elastomeric - Year-over-year growth (2023-2028) (%)
        • Data Table on Elastomeric - Year-over-year growth (2023-2028) (%)
      • 8.7 Acrylic - Market size and forecast (2023-2028)
        • Chart on Acrylic - Market size and forecast (2023-2028) ($ million)
        • Data Table on Acrylic - Market size and forecast (2023-2028) ($ million)
        • Chart on Acrylic - Year-over-year growth (2023-2028) (%)
        • Data Table on Acrylic - Year-over-year growth (2023-2028) (%)
      • 8.8 Market opportunity by Type
        • Market opportunity by Type ($ million)
        • Data Table on Market opportunity by Type ($ million)

      9 Market Segmentation by Technology

      • 9.1 Market segments
        • Chart on Technology - Market share (2023-2028) (%)
        • Data Table on Technology - Market share (2023-2028) (%)
      • 9.2 Comparison by Technology
        • Chart on Comparison by Technology
        • Data Table on Comparison by Technology
      • 9.3 Solvent-based - Market size and forecast (2023-2028)
        • Chart on Solvent-based - Market size and forecast (2023-2028) ($ million)
        • Data Table on Solvent-based - Market size and forecast (2023-2028) ($ million)
        • Chart on Solvent-based - Year-over-year growth (2023-2028) (%)
        • Data Table on Solvent-based - Year-over-year growth (2023-2028) (%)
      • 9.4 Water-based - Market size and forecast (2023-2028)
        • Chart on Water-based - Market size and forecast (2023-2028) ($ million)
        • Data Table on Water-based - Market size and forecast (2023-2028) ($ million)
        • Chart on Water-based - Year-over-year growth (2023-2028) (%)
        • Data Table on Water-based - Year-over-year growth (2023-2028) (%)
      • 9.5 Market opportunity by Technology
        • Market opportunity by Technology ($ million)
        • Data Table on Market opportunity by Technology ($ million)

      8 Customer Landscape

      • 8.1 Customer landscape overview
        • Exhibit 70: Analysis of price sensitivity, lifecycle, customer purchase basket, adoption rates, and purchase criteria

      9 Geographic Landscape

      • 9.1 Geographic segmentation
        • Exhibit 71: Chart on Market share by geography 2023-2028 (%)
        • Exhibit 72: Data Table on Market share by geography 2023-2028 (%)
      • 9.2 Geographic comparison
        • Exhibit 73: Chart on Geographic comparison
        • Exhibit 74: Data Table on Geographic comparison
      • 9.3 APAC - Market size and forecast 2023-2028
        • Exhibit 75: Chart on APAC - Market size and forecast 2023-2028 ($ million)
        • Exhibit 76: Data Table on APAC - Market size and forecast 2023-2028 ($ million)
        • Exhibit 77: Chart on APAC - Year-over-year growth 2023-2028 (%)
        • Exhibit 78: Data Table on APAC - Year-over-year growth 2023-2028 (%)
      • 9.4 North America - Market size and forecast 2023-2028
        • Exhibit 79: Chart on North America - Market size and forecast 2023-2028 ($ million)
        • Exhibit 80: Data Table on North America - Market size and forecast 2023-2028 ($ million)
        • Exhibit 81: Chart on North America - Year-over-year growth 2023-2028 (%)
        • Exhibit 82: Data Table on North America - Year-over-year growth 2023-2028 (%)
      • 9.5 Europe - Market size and forecast 2023-2028
        • Exhibit 83: Chart on Europe - Market size and forecast 2023-2028 ($ million)
        • Exhibit 84: Data Table on Europe - Market size and forecast 2023-2028 ($ million)
        • Exhibit 85: Chart on Europe - Year-over-year growth 2023-2028 (%)
        • Exhibit 86: Data Table on Europe - Year-over-year growth 2023-2028 (%)
      • 9.6 South America - Market size and forecast 2023-2028
        • Exhibit 87: Chart on South America - Market size and forecast 2023-2028 ($ million)
        • Exhibit 88: Data Table on South America - Market size and forecast 2023-2028 ($ million)
        • Exhibit 89: Chart on South America - Year-over-year growth 2023-2028 (%)
        • Exhibit 90: Data Table on South America - Year-over-year growth 2023-2028 (%)
      • 9.7 Middle East and Africa - Market size and forecast 2023-2028
        • Exhibit 91: Chart on Middle East and Africa - Market size and forecast 2023-2028 ($ million)
        • Exhibit 92: Data Table on Middle East and Africa - Market size and forecast 2023-2028 ($ million)
        • Exhibit 93: Chart on Middle East and Africa - Year-over-year growth 2023-2028 (%)
        • Exhibit 94: Data Table on Middle East and Africa - Year-over-year growth 2023-2028 (%)
      • 9.8 US - Market size and forecast 2023-2028
        • Exhibit 95: Chart on US - Market size and forecast 2023-2028 ($ million)
        • Exhibit 96: Data Table on US - Market size and forecast 2023-2028 ($ million)
        • Exhibit 97: Chart on US - Year-over-year growth 2023-2028 (%)
        • Exhibit 98: Data Table on US - Year-over-year growth 2023-2028 (%)
      • 9.9 China - Market size and forecast 2023-2028
        • Exhibit 99: Chart on China - Market size and forecast 2023-2028 ($ million)
        • Exhibit 100: Data Table on China - Market size and forecast 2023-2028 ($ million)
        • Exhibit 101: Chart on China - Year-over-year growth 2023-2028 (%)
        • Exhibit 102: Data Table on China - Year-over-year growth 2023-2028 (%)
      • 9.10 India - Market size and forecast 2023-2028
        • Exhibit 103: Chart on India - Market size and forecast 2023-2028 ($ million)
        • Exhibit 104: Data Table on India - Market size and forecast 2023-2028 ($ million)
        • Exhibit 105: Chart on India - Year-over-year growth 2023-2028 (%)
        • Exhibit 106: Data Table on India - Year-over-year growth 2023-2028 (%)
      • 9.11 Germany - Market size and forecast 2023-2028
        • Exhibit 107: Chart on Germany - Market size and forecast 2023-2028 ($ million)
        • Exhibit 108: Data Table on Germany - Market size and forecast 2023-2028 ($ million)
        • Exhibit 109: Chart on Germany - Year-over-year growth 2023-2028 (%)
        • Exhibit 110: Data Table on Germany - Year-over-year growth 2023-2028 (%)
      • 9.12 UK - Market size and forecast 2023-2028
        • Exhibit 111: Chart on UK - Market size and forecast 2023-2028 ($ million)
        • Exhibit 112: Data Table on UK - Market size and forecast 2023-2028 ($ million)
        • Exhibit 113: Chart on UK - Year-over-year growth 2023-2028 (%)
        • Exhibit 114: Data Table on UK - Year-over-year growth 2023-2028 (%)
      • 9.13 Market opportunity by geography
        • Exhibit 115: Market opportunity by geography ($ million)
        • Exhibit 116: Data Tables on Market opportunity by geography ($ million)
      • 11.14 Canada - Market size and forecast (2023-2028)
        • Chart on Canada - Market size and forecast (2023-2028) ($ million)
        • Data Table on Canada - Market size and forecast (2023-2028) ($ million)
        • Chart on Canada - Year-over-year growth (2023-2028) (%)
        • Data Table on Canada - Year-over-year growth (2023-2028) (%)
      • 11.15 Italy - Market size and forecast (2023-2028)
        • Chart on Italy - Market size and forecast (2023-2028) ($ million)
        • Data Table on Italy - Market size and forecast (2023-2028) ($ million)
        • Chart on Italy - Year-over-year growth (2023-2028) (%)
        • Data Table on Italy - Year-over-year growth (2023-2028) (%)
      • 11.16 France - Market size and forecast (2023-2028)
        • Chart on France - Market size and forecast (2023-2028) ($ million)
        • Data Table on France - Market size and forecast (2023-2028) ($ million)
        • Chart on France - Year-over-year growth (2023-2028) (%)
        • Data Table on France - Year-over-year growth (2023-2028) (%)
      • 11.17 Japan - Market size and forecast (2023-2028)
        • Chart on Japan - Market size and forecast (2023-2028) ($ million)
        • Data Table on Japan - Market size and forecast (2023-2028) ($ million)
        • Chart on Japan - Year-over-year growth (2023-2028) (%)
        • Data Table on Japan - Year-over-year growth (2023-2028) (%)
      • 11.18 Brazil - Market size and forecast (2023-2028)
        • Chart on Brazil - Market size and forecast (2023-2028) ($ million)
        • Data Table on Brazil - Market size and forecast (2023-2028) ($ million)
        • Chart on Brazil - Year-over-year growth (2023-2028) (%)
        • Data Table on Brazil - Year-over-year growth (2023-2028) (%)
      • 11.19 Egypt - Market size and forecast (2023-2028)
        • Chart on Egypt - Market size and forecast (2023-2028) ($ million)
        • Data Table on Egypt - Market size and forecast (2023-2028) ($ million)
        • Chart on Egypt - Year-over-year growth (2023-2028) (%)
        • Data Table on Egypt - Year-over-year growth (2023-2028) (%)
      • 11.20 UAE - Market size and forecast (2023-2028)
        • Chart on UAE - Market size and forecast (2023-2028) ($ million)
        • Data Table on UAE - Market size and forecast (2023-2028) ($ million)
        • Chart on UAE - Year-over-year growth (2023-2028) (%)
        • Data Table on UAE - Year-over-year growth (2023-2028) (%)
      • 11.21 Oman - Market size and forecast (2023-2028)
        • Chart on Oman - Market size and forecast (2023-2028) ($ million)
        • Data Table on Oman - Market size and forecast (2023-2028) ($ million)
        • Chart on Oman - Year-over-year growth (2023-2028) (%)
        • Data Table on Oman - Year-over-year growth (2023-2028) (%)
      • 11.22 Argentina - Market size and forecast (2023-2028)
        • Chart on Argentina - Market size and forecast (2023-2028) ($ million)
        • Data Table on Argentina - Market size and forecast (2023-2028) ($ million)
        • Chart on Argentina - Year-over-year growth (2023-2028) (%)
        • Data Table on Argentina - Year-over-year growth (2023-2028) (%)
      • 11.23 KSA - Market size and forecast (2023-2028)
        • Chart on KSA - Market size and forecast (2023-2028) ($ million)
        • Data Table on KSA - Market size and forecast (2023-2028) ($ million)
        • Chart on KSA - Year-over-year growth (2023-2028) (%)
        • Data Table on KSA - Year-over-year growth (2023-2028) (%)
      • 11.24 Rest of World (ROW) - Market size and forecast (2023-2028)
        • Chart on Rest of World (ROW) - Market size and forecast (2023-2028) ($ million)
        • Data Table on Rest of World (ROW) - Market size and forecast (2023-2028) ($ million)
        • Chart on Rest of World (ROW) - Year-over-year growth (2023-2028) (%)
        • Data Table on Rest of World (ROW) - Year-over-year growth (2023-2028) (%)

      10 Drivers, Challenges, and Trends

      • 10.1 Market drivers
        • 10.2 Market challenges
          • 10.3 Impact of drivers and challenges
            • Exhibit 117: Impact of drivers and challenges in 2023 and 2028
          • 10.4 Market trends

            11 Vendor Landscape

            • 11.1 Overview
              • 11.2 Vendor landscape
                • Exhibit 118: Overview on Criticality of inputs and Factors of differentiation
              • 11.3 Landscape disruption
                • Exhibit 119: Overview on factors of disruption
              • 11.4 Industry risks
                • Exhibit 120: Impact of key risks on business

              12 Vendor Analysis

              • 12.1 Vendors covered
                • Exhibit 121: Vendors covered
              • 12.2 Market positioning of vendors
                • Exhibit 122: Matrix on vendor position and classification
              • 12.3 BASF SE
                • Exhibit 123: BASF SE - Overview
                • Exhibit 124: BASF SE - Business segments
                • Exhibit 125: BASF SE - Key news
                • Exhibit 126: BASF SE - Key offerings
                • Exhibit 127: BASF SE - Segment focus
              • 12.4 Bauder Ltd.
                • Exhibit 128: Bauder Ltd. - Overview
                • Exhibit 129: Bauder Ltd. - Product / Service
                • Exhibit 130: Bauder Ltd. - Key offerings
              • 12.5 Berkshire Hathaway Inc.
                • Exhibit 131: Berkshire Hathaway Inc. - Overview
                • Exhibit 132: Berkshire Hathaway Inc. - Business segments
                • Exhibit 133: Berkshire Hathaway Inc. - Key news
                • Exhibit 134: Berkshire Hathaway Inc. - Key offerings
                • Exhibit 135: Berkshire Hathaway Inc. - Segment focus
              • 12.6 Carlisle Companies Inc.
                • Exhibit 136: Carlisle Companies Inc. - Overview
                • Exhibit 137: Carlisle Companies Inc. - Business segments
                • Exhibit 138: Carlisle Companies Inc. - Key offerings
                • Exhibit 139: Carlisle Companies Inc. - Segment focus
              • 12.7 Compagnie de Saint Gobain
                • Exhibit 140: Compagnie de Saint Gobain - Overview
                • Exhibit 141: Compagnie de Saint Gobain - Business segments
                • Exhibit 142: Compagnie de Saint Gobain - Key news
                • Exhibit 143: Compagnie de Saint Gobain - Key offerings
                • Exhibit 144: Compagnie de Saint Gobain - Segment focus
              • 12.8 Dow Chemical Co.
                • Exhibit 145: Dow Chemical Co. - Overview
                • Exhibit 146: Dow Chemical Co. - Business segments
                • Exhibit 147: Dow Chemical Co. - Key news
                • Exhibit 148: Dow Chemical Co. - Key offerings
                • Exhibit 149: Dow Chemical Co. - Segment focus
              • 12.9 H.B. Fuller Co.
                • Exhibit 150: H.B. Fuller Co. - Overview
                • Exhibit 151: H.B. Fuller Co. - Business segments
                • Exhibit 152: H.B. Fuller Co. - Key news
                • Exhibit 153: H.B. Fuller Co. - Key offerings
                • Exhibit 154: H.B. Fuller Co. - Segment focus
              • 12.10 IBG Industrie Beteiligungs Gesellschaft mbH and Co. KG
                • Exhibit 155: IBG Industrie Beteiligungs Gesellschaft mbH and Co. KG - Overview
                • Exhibit 156: IBG Industrie Beteiligungs Gesellschaft mbH and Co. KG - Product / Service
                • Exhibit 157: IBG Industrie Beteiligungs Gesellschaft mbH and Co. KG - Key offerings
              • 12.11 IKO Industries Ltd.
                • Exhibit 158: IKO Industries Ltd. - Overview
                • Exhibit 159: IKO Industries Ltd. - Product / Service
                • Exhibit 160: IKO Industries Ltd. - Key offerings
              • 12.12 Mapei SpA
                • Exhibit 161: Mapei SpA - Overview
                • Exhibit 162: Mapei SpA - Product / Service
                • Exhibit 163: Mapei SpA - Key offerings
              • 12.13 Nippon Paint Holdings Co. Ltd.
                • Exhibit 164: Nippon Paint Holdings Co. Ltd. - Overview
                • Exhibit 165: Nippon Paint Holdings Co. Ltd. - Business segments
                • Exhibit 166: Nippon Paint Holdings Co. Ltd. - Key offerings
                • Exhibit 167: Nippon Paint Holdings Co. Ltd. - Segment focus
              • 12.14 Pidilite Industries Ltd.
                • Exhibit 168: Pidilite Industries Ltd. - Overview
                • Exhibit 169: Pidilite Industries Ltd. - Business segments
                • Exhibit 170: Pidilite Industries Ltd. - Key news
                • Exhibit 171: Pidilite Industries Ltd. - Key offerings
                • Exhibit 172: Pidilite Industries Ltd. - Segment focus
              • 12.15 Sika AG
                • Exhibit 173: Sika AG - Overview
                • Exhibit 174: Sika AG - Business segments
                • Exhibit 175: Sika AG - Key news
                • Exhibit 176: Sika AG - Key offerings
                • Exhibit 177: Sika AG - Segment focus
              • 12.16 SOPREMA SAS
                • Exhibit 178: SOPREMA SAS - Overview
                • Exhibit 179: SOPREMA SAS - Product / Service
                • Exhibit 180: SOPREMA SAS - Key offerings
              • 12.17 Standard Industries Inc.
                • Exhibit 181: Standard Industries Inc. - Overview
                • Exhibit 182: Standard Industries Inc. - Product / Service
                • Exhibit 183: Standard Industries Inc. - Key news
                • Exhibit 184: Standard Industries Inc. - Key offerings

              13 Appendix

              • 13.1 Scope of the report
                • 13.2 Inclusions and exclusions checklist
                  • Exhibit 185: Inclusions checklist
                  • Exhibit 186: Exclusions checklist
                • 13.3 Currency conversion rates for US$
                  • Exhibit 187: Currency conversion rates for US$
                • 13.4 Research methodology
                  • Exhibit 188: Research methodology
                  • Exhibit 189: Validation techniques employed for market sizing
                  • Exhibit 190: Information sources
                • 13.5 List of abbreviations
                  • Exhibit 191: List of abbreviations

                Research Methodology

                Technavio presents a detailed picture of the market by way of study, synthesis, and summation of data from multiple sources. The analysts have presented the various facets of the market with a particular focus on identifying the key industry influencers. The data thus presented is comprehensive, reliable, and the result of extensive research, both primary and secondary.

                INFORMATION SOURCES

                Primary sources

                • Manufacturers and suppliers
                • Channel partners
                • Industry experts
                • Strategic decision makers

                Secondary sources

                • Industry journals and periodicals
                • Government data
                • Financial reports of key industry players
                • Historical data
                • Press releases

                DATA ANALYSIS

                Data Synthesis

                • Collation of data
                • Estimation of key figures
                • Analysis of derived insights

                Data Validation

                • Triangulation with data models
                • Reference against proprietary databases
                • Corroboration with industry experts

                REPORT WRITING

                Qualitative

                • Market drivers
                • Market challenges
                • Market trends
                • Five forces analysis

                Quantitative

                • Market size and forecast
                • Market segmentation
                • Geographical insights
                • Competitive landscape

                Interested in this report?

                Get your sample now to see our research methodology and insights!

                Download Now

                Frequently Asked Questions

                Liquid Applied Membranefor Construction Industry market growth will increase by $ 3.65 bn during 2024-2028.

                The Liquid Applied Membranefor Construction Industry market is expected to grow at a CAGR of 6.14% during 2024-2028.

                Liquid Applied Membranefor Construction Industry market is segmented by Application( Roofing and walls, Building structures, Industrial water and wastewater management, Landfills and tunnels) End-user( Commercial, Public infrastructure, Residential)

                Alchimica, BASF SE, Bauder Ltd., Berkshire Hathaway Inc., Carlisle Companies Inc., Compagnie de Saint Gobain, Dow Chemical Co., Follmann Chemie GmbH, Fosroc International Ltd., H.B. Fuller Co., IBG Industrie Beteiligungs Gesellschaft mbH and Co. KG, IKO Industries Ltd., Mapei SpA, Nippon Paint Holdings Co. Ltd., RPM International Inc., Sika AG, SOPREMA SAS, Standard Industries Inc., Western Colloid, Pidilite Industries Ltd. are a few of the key vendors in the Liquid Applied Membranefor Construction Industry market.

                APAC will register the highest growth rate of 38% among the other regions. Therefore, the Liquid Applied Membranefor Construction Industry market in APAC is expected to garner significant business opportunities for the vendors during the forecast period.

                US, Canada, Germany, UK, Italy, France, China, India, Japan, Brazil, Egypt, UAE, Oman, Argentina, KSA, UAE, Brazil, Rest of World (ROW)

                • Rising demand for energy-efficient buildingsThe global construction industry has been undergoing significant changes in recent years is the driving factor this market.
                • with a growing emphasis on sustainability and energy efficiency. One of the key drivers in this changing landscape is the rising demand for energy-efficient buildings. As a result is the driving factor this market.
                • the liquid applied membrane market for construction industry is experiencing substantial growth. Energy-efficient buildings are designed to reduce energy consumption and minimize their carbon footprint. They incorporate various advanced technologies and raw materials that enhance insulation is the driving factor this market.
                • optimize energy usage is the driving factor this market.
                • and improve overall building performance. Liquid applied membranes play a crucial role in achieving these objectives by providing a seamless is the driving factor this market.
                • durable is the driving factor this market.
                • and protective layer on different surfaces of buildings. Liquid applied membranes are water-based coatings that can be easily applied to various building components is the driving factor this market.
                • such as roofs is the driving factor this market.
                • walls is the driving factor this market.
                • and foundations. These membranes offer excellent waterproofing properties is the driving factor this market.
                • protecting buildings from water ingress and subsequent damage by moisture. Moreover is the driving factor this market.
                • they create a continuous air barrier is the driving factor this market.
                • minimizing air leakage and heat transfer is the driving factor this market.
                • thus reducing the energy consumed for heating and cooling purposes. An example of the impact of energy-efficient buildings and the subsequent demand for liquid applied membranes can be observed in the US. The country has witnessed a significant surge in the construction of green or LEED-certified buildings. The Leadership in Energy and Environmental Design (LEED) certification system encourages the use of sustainable materials and practices in building construction. Liquid applied membranes have gained popularity in the US due to their ability to meet the demanding standards of LEED-certified projects. They contribute to achieving the desired energy efficiency goals by preventing air and water leakage is the driving factor this market.
                • thereby improving overall building performance and reducing the impact on the environment. Furthermore is the driving factor this market.
                • initiatives such as the Energy Efficiency and Conservation Block Grant (EECBG) program is the driving factor this market.
                • implemented by the US Department of Energy is the driving factor this market.
                • have provided grants to several communities to improve energy efficiency in buildings. This program has spurred the adoption of energy-efficient technologies is the driving factor this market.
                • including liquid applied membranes is the driving factor this market.
                • to enhance building energy efficiency across the nation. Thus is the driving factor this market.
                • the benefits of liquid applied membranes is the driving factor this market.
                • such as superior waterproofing and air barrier characteristics is the driving factor this market.
                • enable lower energy consumption and enhanced building performance is the driving factor this market.
                • which is the driving factor this market.
                • in turn is the driving factor this market.
                • will drive the growth of the global liquid applied membrane market for construction industry during the forecast period. is the driving factor this market.

                The Liquid Applied Membranefor Construction Industry market vendors should focus on grabbing business opportunities from the Roofing and walls segment as it accounted for the largest market share in the base year.