Liquid Waste Management Market Analysis, Size, and Forecast 2026-2030: APAC (China, India, and Japan), North America (US, Canada, and Mexico), Europe (Germany, UK, and France), Middle East and Africa (Saudi Arabia, UAE, and South Africa), South America (Brazil and Argentina), and Rest of World (ROW)

Liquid Waste Management Market Analysis, Size, and Forecast 2026-2030:
APAC (China, India, and Japan), North America (US, Canada, and Mexico), Europe (Germany, UK, and France), Middle East and Africa (Saudi Arabia, UAE, and South Africa), South America (Brazil and Argentina), and Rest of World (ROW)

Published: May 2026 283 Pages SKU: IRTNTR72921

Market Overview at a Glance

$26.59 B
Market Opportunity
4.8%
CAGR 2025 - 2030
54.5%
APAC Growth
$68.68 B
Industrial segment 2024

Liquid Waste Management Market Size 2026-2030

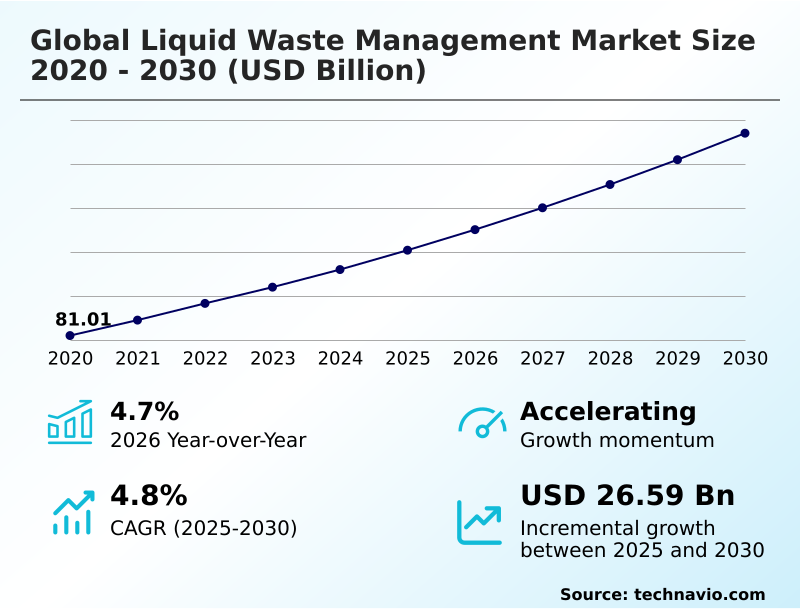
The Liquid Waste Management Market size was valued at USD 100.41 billion in 2025, growing at a CAGR of 4.8% during the forecast period 2026-2030.

Major Market Trends & Insights

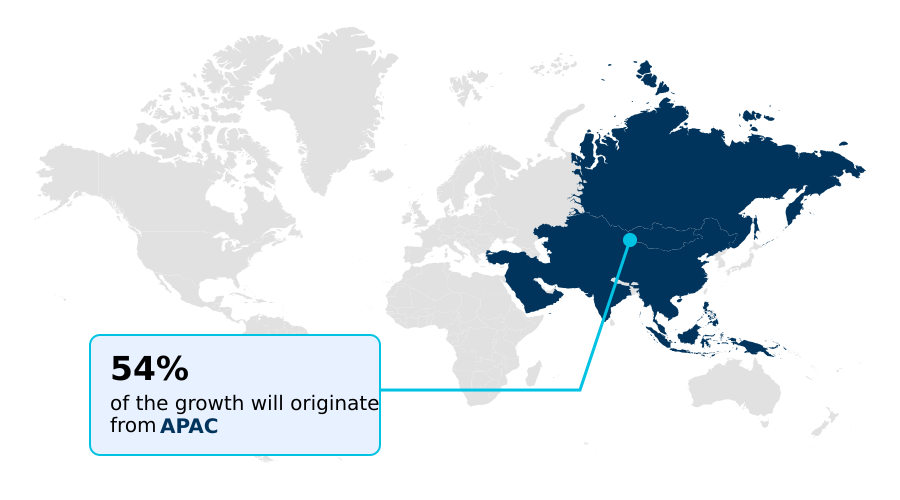
  • APAC dominated the market and accounted for a 54.5% growth during the forecast period.
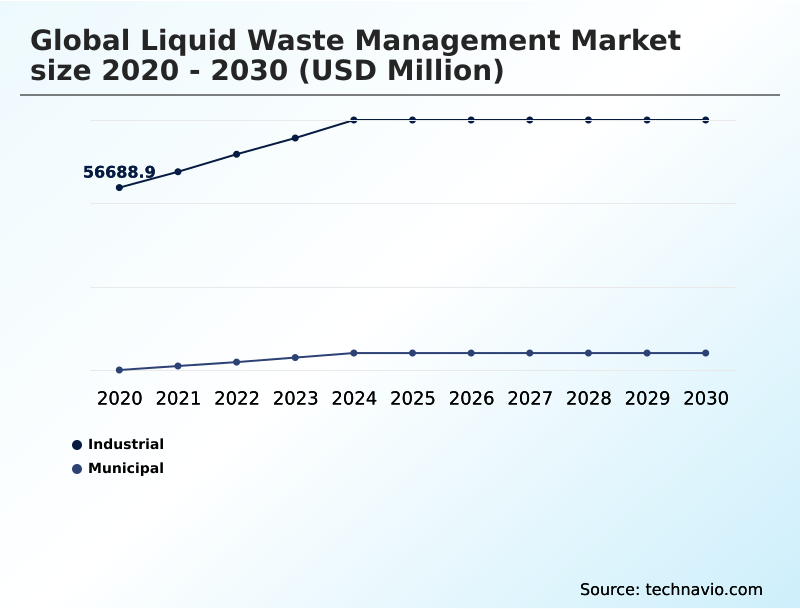
  • By Source - Industrial segment was valued at USD 68.68 billion in 2024
  • By Service - Treatment segment accounted for the largest market revenue share in 2024

Market Size & Forecast

  • Historic Market Opportunities 2020-2024: USD 45.99 billion
  • Market Future Opportunities 2025-2030: USD 26.59 billion
  • CAGR from 2025 to 2030 : 4.8%

Market Summary

  • The liquid waste management market is pivoting from a disposal-centric model to a resource-oriented framework, with modern facilities recovering over 95% of water for reuse. This transition is exemplified in manufacturing, where a facility manager implements a closed-loop system not just for compliance but to reduce operational dependency on freshwater sources, cutting water acquisition costs by over 40%.
  • A primary driver is the global push for circularity, compelling industries to view wastewater as a source of valuable materials. However, this evolution is constrained by a significant challenge: the high energy consumption of advanced treatment methods.
  • Technologies like reverse osmosis, while effective, can consume double the energy of conventional processes, creating a direct conflict with corporate carbon reduction goals and pressuring operators to balance environmental stewardship with financial viability.

What will be the Size of the Liquid Waste Management Market during the forecast period?

Get Key Insights on Market Forecast (PDF) Request Free Sample

How is the Liquid Waste Management Market Segmented?

The liquid waste management industry research report provides comprehensive data (region-wise segment analysis), with forecasts and analysis for the period 2026-2030, as well as historical data from 2020-2024 for the following segments.

  • Source
    • Industrial
    • Municipal
  • Service
    • Treatment
    • Collection
    • Transportation
    • Disposal
  • Material
    • Non-hazardous
    • Hazardous
  • Geography
    • APAC
      • China
      • India
      • Japan
    • North America
      • US
      • Canada
      • Mexico
    • Europe
      • Germany
      • UK
      • France
    • Middle East and Africa
      • Saudi Arabia
      • UAE
      • South Africa
    • South America
      • Brazil
      • Argentina
    • Rest of World (ROW)

How is the Liquid Waste Management Market Segmented by Source?

The industrial segment is estimated to witness significant growth during the forecast period.

The industrial segment, representing over 70% of liquid waste management services, is driven by stringent regulations for industrial wastewater.

This sector has shifted from disposal-centric models to resource recovery, with zero liquid discharge (ZLD) systems capable of reclaiming up to 95% of process water.

This transition is critical in sectors like pharmaceutical wastewater and textile industry effluent treatment, where complex pollutants necessitate advanced oxidation process technologies for effective breakdown.

Unlike municipal streams, industrial flows often require specialized on-site decentralized treatment systems for heavy metal removal and management of outputs from oil and gas produced water, making it a technology-intensive and high-value segment.

The use of granular activated carbon is also becoming standard for polishing final effluent before discharge or reuse.

Request Free Sample

The Industrial segment was valued at USD 68.68 billion in 2024 and showed a gradual increase during the forecast period.

Request Free Sample

How demand for the Liquid Waste Management market is rising in the leading region?

APAC is estimated to contribute 54.5% to the growth of the global market during the forecast period.Technavio’s analysts have elaborately explained the regional trends and drivers that shape the market during the forecast period.

See How Liquid Waste Management Market demand is rising in APAC Request Free Sample

APAC will contribute 54.5% of the global liquid waste management market's growth, a rate nearly 2.3 times that of North America.

This expansion is driven by rapid industrialization in China and India, where demand for new effluent treatment infrastructure is surging.

In contrast, the North American market, dominated by the US, focuses on upgrading aging activated sludge process plants and integrating advanced membrane bioreactor (MBR) technology to manage complex pollutants from established industries.

Adoption of MBR can increase nutrient removal efficiency by over 30% compared to conventional systems.

This regional divergence impacts the supply chain, with APAC requiring scalable, cost-effective solutions for high volumes of municipal sewage and industrial wastewater, while North America prioritizes specialized technologies for effluent polishing and biosolids management to meet stricter environmental standards.

What are the key Drivers, Trends, and Challenges in the Liquid Waste Management Market?

Our researchers analyzed the data with 2025 as the base year, along with the key drivers, trends, and challenges. A holistic analysis of drivers will help companies refine their marketing strategies to gain a competitive advantage.

  • Strategic planning in liquid waste management requires a thorough evaluation of total lifecycle expenses, where the initial cost of zero liquid discharge implementation is weighed against long-term operational savings and regulatory compliance. For industrial facilities, deploying advanced oxidation for industrial wastewater can reduce chemical consumption by up to 25% compared to traditional methods, but it necessitates significant upfront capital.
  • As urban areas expand, decentralized wastewater treatment for communities is emerging as a scalable alternative to expanding overburdened centralized plants, offering phased investment and faster deployment. A critical and growing concern is the development of effective PFAS removal technologies in liquid waste, as future regulations are expected to mandate near-complete elimination, making this a key area for R&D investment.
  • Furthermore, the focus on circularity is elevating the importance of nutrient recovery from municipal sludge, transforming a waste byproduct into a marketable fertilizer, with some processes recovering over 90% of phosphorus. This shift reframes waste management from a cost center to a potential revenue-generating operation.

What are the key market drivers leading to the rise in the adoption of Liquid Waste Management Industry?

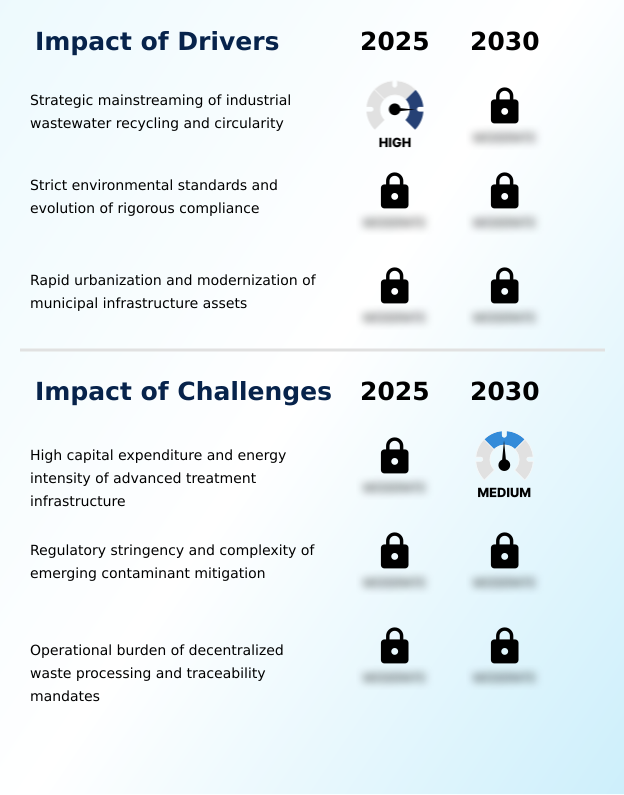
  • The strategic mainstreaming of industrial wastewater recycling and the application of circular economy principles serve as a primary driver for the market.

  • The adoption of circular economy principles is a primary driver, fundamentally changing how municipal sewage and hazardous liquid waste are managed.
  • This shift is propelled by the need for water reclamation, with advanced systems recovering over 95% of wastewater for reuse in applications like industrial process water.
  • Instead of being a disposal cost, effluent is now viewed as a source of valuable resources. Technologies such as coagulation-flocculation and electrocoagulation are being optimized for resource recovery, not just contaminant removal.
  • The integration of process control automation further enhances efficiency, reducing chemical usage by 15-20% while ensuring consistent water quality. This driver reframes liquid waste management as a critical component of sustainable industrial operations and resilient urban water strategies.

What are the market trends shaping the Liquid Waste Management Industry?

  • A key trend is the institutionalization of decentralized and modular treatment infrastructure. This shift addresses the need for flexible, scalable solutions at the point of waste generation.

  • A significant trend shaping liquid waste management is the shift toward modular wastewater plants, which can be deployed in a fraction of the time compared to large-scale civil projects, reducing project timelines by up to 75%.
  • These containerized, plug-and-play systems, often utilizing high-efficiency reverse osmosis (RO) and anaerobic digestion, address the need for agile and scalable solutions in rapidly growing industrial zones. This approach minimizes the physical footprint and allows for localized treatment and reuse, easing the burden on aging municipal infrastructure.
  • The integration of a smart water grid with real-time monitoring further optimizes these decentralized networks, enhancing the efficiency of processes like sludge dewatering and management of landfill leachate treatment, ultimately supporting a more resilient and cost-effective sanitation model.

What challenges does the Liquid Waste Management Industry face during its growth?

  • The high capital expenditure and significant energy intensity required for advanced treatment infrastructure present a key challenge to industry growth.

  • A primary challenge confronting the liquid waste management market is the high energy intensity of advanced treatment systems, which can consume up to double the electricity of conventional methods. This escalates operational costs, particularly in regions with high energy prices, and creates a conflict with corporate sustainability goals aimed at reducing carbon footprints.
  • For instance, processes essential for salinity management and nutrient removal, such as reverse osmosis and biological nutrient removal, are energy-intensive. Achieving stringent limits for biological oxygen demand (BOD) in complex waste from food processing wastewater often requires these advanced, high-cost technologies.
  • The financial burden is particularly acute for small and medium-sized enterprises that lack the capital for such investments, limiting widespread adoption and posing a barrier to achieving higher environmental standards.

Exclusive Technavio Analysis on Customer Landscape

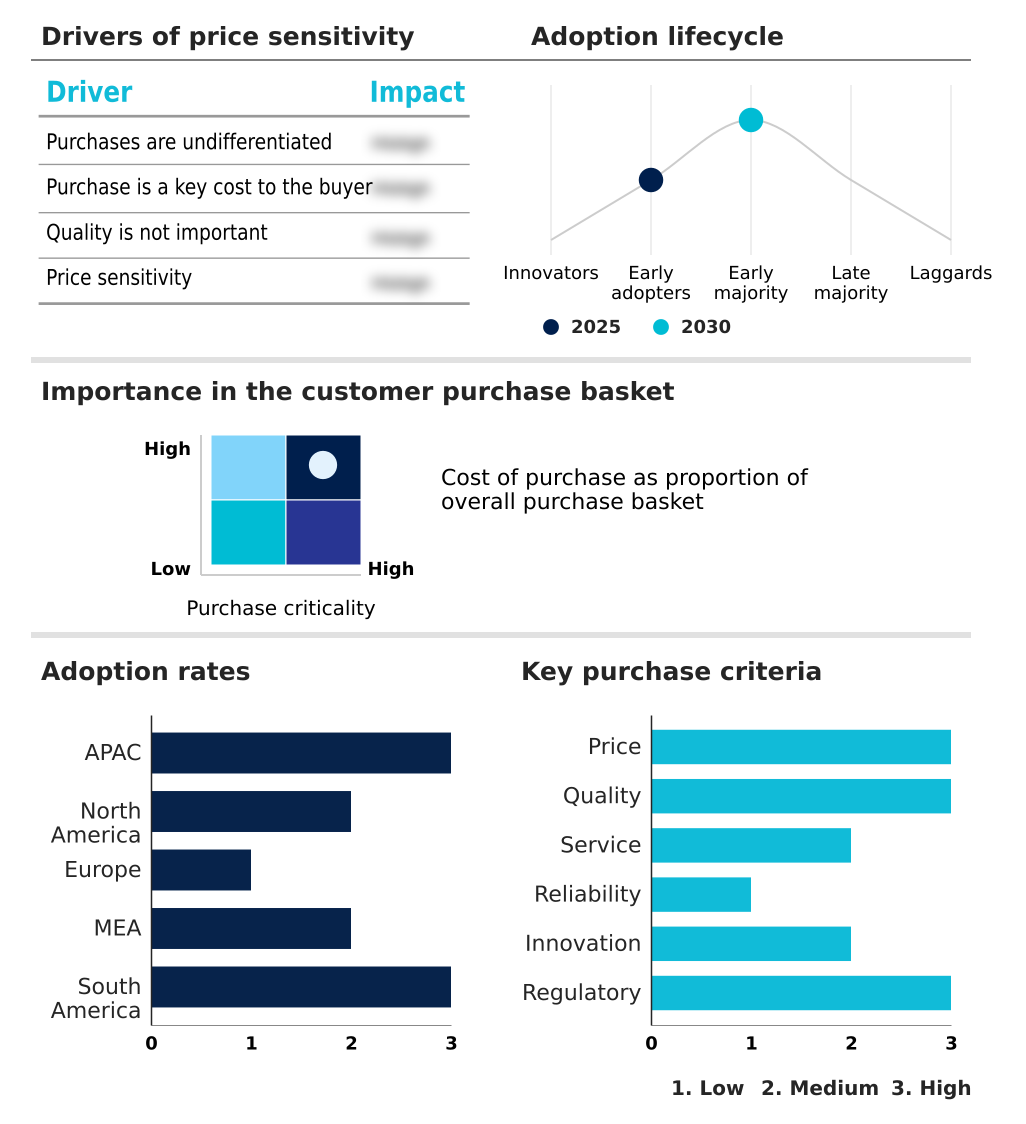
The liquid waste management market forecasting report includes the adoption lifecycle of the market, covering from the innovator’s stage to the laggard’s stage. It focuses on adoption rates in different regions based on penetration. Furthermore, the liquid waste management market report also includes key purchase criteria and drivers of price sensitivity to help companies evaluate and develop their market growth analysis strategies.

Customer Landscape of Liquid Waste Management Industry

Competitive Landscape

Companies are implementing various strategies, such as strategic alliances, liquid waste management market forecast, partnerships, mergers and acquisitions, geographical expansion, and product/service launches, to enhance their presence in the industry.

Augean plc - Providers deliver comprehensive management solutions, including the collection, treatment, and disposal of hazardous and non-hazardous liquid waste for industrial and municipal clients.

The industry research and growth report includes detailed analyses of the competitive landscape of the market and information about key companies, including:

  • Augean plc
  • Casella Waste Systems Inc.
  • Clean Harbors Inc.
  • Cleanaway Waste Management Ltd.
  • Enva
  • Enviri Corp.
  • GFL Environmental Inc.
  • Grupo Tradebe Medioambiente SL
  • Heritage Crystal Clean Inc.
  • Remondis SE and Co. KG
  • Republic Services Inc.
  • ReWorld Waste
  • Seche Environnement SA
  • SUEZ SA
  • Veolia Environment SA
  • Waste Management Inc.
  • Whites Recycling Ltd.

Qualitative and quantitative analysis of companies has been conducted to help clients understand the wider business environment as well as the strengths and weaknesses of key industry players. Data is qualitatively analyzed to categorize companies as pure play, category-focused, industry-focused, and diversified; it is quantitatively analyzed to categorize companies as dominant, leading, strong, tentative, and weak.

Market Intelligence Radar: High-Impact Developments & Growth Signals

  • In the Environmental and Facilities Services industry, the mainstreaming of circular economy principles is compelling a move beyond simple waste disposal. This directly impacts the liquid waste management market by driving demand for technologies that facilitate resource recovery and water reuse applications, turning treated effluent into a valuable commodity.
  • The enforcement of stricter environmental regulations and pollutant discharge limits is fundamentally reshaping operational requirements. For the liquid waste management market, this translates to increased investment in advanced treatment technologies capable of heavy metal removal and organic pollutant degradation to ensure compliance.
  • A growing trend toward outsourcing non-core operations has expanded the addressable market for third-party service providers. This directly benefits the liquid waste management sector as industrial and municipal entities seek specialized expertise for complex wastewater challenges, including biosolids management and effluent polishing.
  • Digital transformation, including the adoption of IoT for real-time monitoring and process control automation, is enhancing operational efficiency. In liquid waste management, this allows for optimized chemical dosing, predictive maintenance of equipment, and improved management of decentralized treatment systems.

Dive into Technavio’s robust research methodology, blending expert interviews, extensive data synthesis, and validated models for unparalleled Liquid Waste Management Market insights. See full methodology.

Market Scope
Page number 283
Base year 2025
Historic period 2020-2024
Forecast period 2026-2030
Growth momentum & CAGR Accelerate at a CAGR of 4.8%
Market growth 2026-2030 USD 26592.3 million
Market structure Fragmented
YoY growth 2025-2026(%) 4.7%
Key countries China, India, Japan, South Korea, Australia, Indonesia, US, Canada, Mexico, Germany, UK, France, Italy, Spain, The Netherlands, Saudi Arabia, UAE, South Africa, Israel, Turkey, Brazil, Argentina and Chile
Competitive landscape Leading Companies, Market Positioning of Companies, Competitive Strategies, and Industry Risks

Request Free Sample

Research Analyst Overview

  • The liquid waste management market ecosystem involves a complex interplay of stakeholders, where technology suppliers provide critical components like membranes and chemical coagulants that enable service providers to manage industrial and municipal waste streams. Industrial end-users, comprising over 70% of the market, are the primary revenue source, driven by regulatory bodies that enforce stringent effluent discharge standards.
  • These regulations, in turn, spur innovation in R&D entities focused on developing more efficient treatment processes. For instance, advanced systems can reduce specific contaminants by over 99%, a benchmark often required for discharge permits.
  • Logistics and distribution channels, including specialized tanker fleets, are essential for the collection and transport of waste to centralized treatment facilities, completing a value chain centered on compliance and environmental protection.

What are the Key Data Covered in this Liquid Waste Management Market Research and Growth Report?

  • What is the expected growth of the Liquid Waste Management Market between 2026 and 2030?

    • The Liquid Waste Management Market is expected to grow by USD 26.59 billion during 2026-2030, registering a CAGR of 4.8%. Year-over-year growth in 2026 is estimated at 4.7%%. This acceleration is shaped by strategic mainstreaming of industrial wastewater recycling and circularity, which is intensifying demand across multiple end-use verticals covered in the report.

  • What segmentation does the market report cover?

    • The report is segmented by Source (Industrial, and Municipal), Service (Treatment, Collection, Transportation, and Disposal), Material (Non-hazardous, and Hazardous) and Geography (APAC, North America, Europe, Middle East and Africa, South America). Among these, the Industrial segment is estimated to witness significant growth during the forecast period, driven by rising adoption across key application areas. Each segment includes detailed qualitative and quantitative analysis, along with historical data from 2020-2024 and forecasts through 2030 with year-over-year growth rates.

  • Which regions are analyzed in the report?

    • The report covers APAC, North America, Europe, Middle East and Africa and South America. APAC is estimated to contribute 54.5% to market growth during the forecast period. Country-level analysis includes China, India, Japan, South Korea, Australia, Indonesia, US, Canada, Mexico, Germany, UK, France, Italy, Spain, The Netherlands, Saudi Arabia, UAE, South Africa, Israel, Turkey, Brazil, Argentina and Chile, with dedicated market size tables and year-over-year growth for each.

  • What are the key growth drivers and market challenges?

    • The primary driver is strategic mainstreaming of industrial wastewater recycling and circularity, which is accelerating investment and industry demand. The main challenge is high capital expenditure and energy intensity of advanced treatment infrastructure, creating operational barriers for key market participants. The report quantifies the impact of each driver and challenge across 2026 and 2030 with comparative analysis.

  • Who are the major players in the Liquid Waste Management Market?

    • Key vendors include Augean plc, Casella Waste Systems Inc., Clean Harbors Inc., Cleanaway Waste Management Ltd., Enva, Enviri Corp., GFL Environmental Inc., Grupo Tradebe Medioambiente SL, Heritage Crystal Clean Inc., Remondis SE and Co. KG, Republic Services Inc., ReWorld Waste, Seche Environnement SA, SUEZ SA, Veolia Environment SA, Waste Management Inc. and Whites Recycling Ltd.. The report provides qualitative and quantitative analysis categorizing companies as dominant, leading, strong, tentative, and weak based on their market positioning. Company profiles include business segment analysis, SWOT assessment, key offerings, and recent strategic developments.

Market Research Insights

  • The liquid waste management market's competitive landscape is consolidated, with the top five players accounting for over 45% of industry revenue. This environment is shaped by strategic actions aimed at technological leadership and geographic expansion. For instance, key vendors are heavily investing in proprietary PFAS destruction technologies that achieve over 99% elimination rates, directly responding to tightening regulatory controls.
  • These innovations address urgent enterprise needs for compliance and risk mitigation in handling hazardous liquid waste. Other companies are expanding their footprint in emerging markets through acquisitions, gaining access to high-growth industrial sectors.
  • However, the operational complexity and high capital cost of scaling these advanced treatment solutions remain a persistent challenge, forcing firms to balance innovation with cost-effective service delivery to maintain market share.

We can help! Our analysts can customize this liquid waste management market research report to meet your requirements.

Get in touch

1. Executive Summary

1.1 Market overview

Executive Summary - Chart on Market Overview
Executive Summary - Data Table on Market Overview
Executive Summary - Chart on Global Market Characteristics
Executive Summary - Chart on Market by Geography
Executive Summary - Chart on Market Segmentation by Source
Executive Summary - Chart on Market Segmentation by Service
Executive Summary - Chart on Market Segmentation by Material
Executive Summary - Chart on Incremental Growth
Executive Summary - Data Table on Incremental Growth
Executive Summary - Chart on Company Market Positioning

2. Technavio Analysis

2.1 Analysis of price sensitivity, lifecycle, customer purchase basket, adoption rates, and purchase criteria

2.2 Criticality of inputs and Factors of differentiation

Chart on Overview on criticality of inputs and factors of differentiation

2.3 Factors of disruption

Chart on Overview on factors of disruption

2.4 Impact of drivers and challenges

Chart on Impact of drivers and challenges in 2025 and 2030

3. Market Landscape

3.1 Market ecosystem

Chart on Parent Market
Data Table on - Parent Market

3.2 Market characteristics

Chart on Market characteristics analysis

3.3 Value chain analysis

Chart on Value chain analysis

4. Market Sizing

4.1 Market definition

Data Table on Offerings of companies included in the market definition

4.2 Market segment analysis

Market segments

4.3 Market size 2025

4.4 Market outlook: Forecast for 2025-2030

Chart on Global - Market size and forecast 2025-2030 ($ million)
Data Table on Global - Market size and forecast 2025-2030 ($ million)
Chart on Global Market: Year-over-year growth 2025-2030 (%)
Data Table on Global Market: Year-over-year growth 2025-2030 (%)

5. Historic Market Size

5.1 Global Liquid Waste Management Market 2020 - 2024

Historic Market Size - Data Table on Global Liquid Waste Management Market 2020 - 2024 ($ million)

5.2 Source segment analysis 2020 - 2024

Historic Market Size - Source Segment 2020 - 2024 ($ million)

5.3 Service segment analysis 2020 - 2024

Historic Market Size - Service Segment 2020 - 2024 ($ million)

5.4 Material segment analysis 2020 - 2024

Historic Market Size - Material Segment 2020 - 2024 ($ million)

5.5 Geography segment analysis 2020 - 2024

Historic Market Size - Geography Segment 2020 - 2024 ($ million)

5.6 Country segment analysis 2020 - 2024

Historic Market Size - Country Segment 2020 - 2024 ($ million)

6. Qualitative Analysis

6.1 Impact of AI in global liquid waste management market

6.2 Impact of geopolitical conflict for global liquid waste management market

7. Five Forces Analysis

7.1 Five forces summary

Five forces analysis - Comparison between 2025 and 2030

7.2 Bargaining power of buyers

Bargaining power of buyers - Impact of key factors 2025 and 2030

7.3 Bargaining power of suppliers

Bargaining power of suppliers - Impact of key factors in 2025 and 2030

7.4 Threat of new entrants

Threat of new entrants - Impact of key factors in 2025 and 2030

7.5 Threat of substitutes

Threat of substitutes - Impact of key factors in 2025 and 2030

7.6 Threat of rivalry

Threat of rivalry - Impact of key factors in 2025 and 2030

7.7 Market condition

Chart on Market condition - Five forces 2025 and 2030

8. Market Segmentation by Source

8.1 Market segments

Chart on Source - Market share 2025-2030 (%)
Data Table on Source - Market share 2025-2030 (%)

8.2 Comparison by Source

Chart on Comparison by Source
Data Table on Comparison by Source

8.3 Industrial - Market size and forecast 2025-2030

Chart on Industrial - Market size and forecast 2025-2030 ($ million)
Data Table on Industrial - Market size and forecast 2025-2030 ($ million)
Chart on Industrial - Year-over-year growth 2025-2030 (%)
Data Table on Industrial - Year-over-year growth 2025-2030 (%)

8.4 Municipal - Market size and forecast 2025-2030

Chart on Municipal - Market size and forecast 2025-2030 ($ million)
Data Table on Municipal - Market size and forecast 2025-2030 ($ million)
Chart on Municipal - Year-over-year growth 2025-2030 (%)
Data Table on Municipal - Year-over-year growth 2025-2030 (%)

8.5 Market opportunity by Source

Market opportunity by Source ($ million)
Data Table on Market opportunity by Source ($ million)

9. Market Segmentation by Service

9.1 Market segments

Chart on Service - Market share 2025-2030 (%)
Data Table on Service - Market share 2025-2030 (%)

9.2 Comparison by Service

Chart on Comparison by Service
Data Table on Comparison by Service

9.3 Treatment - Market size and forecast 2025-2030

Chart on Treatment - Market size and forecast 2025-2030 ($ million)
Data Table on Treatment - Market size and forecast 2025-2030 ($ million)
Chart on Treatment - Year-over-year growth 2025-2030 (%)
Data Table on Treatment - Year-over-year growth 2025-2030 (%)

9.4 Collection - Market size and forecast 2025-2030

Chart on Collection - Market size and forecast 2025-2030 ($ million)
Data Table on Collection - Market size and forecast 2025-2030 ($ million)
Chart on Collection - Year-over-year growth 2025-2030 (%)
Data Table on Collection - Year-over-year growth 2025-2030 (%)

9.5 Transportation - Market size and forecast 2025-2030

Chart on Transportation - Market size and forecast 2025-2030 ($ million)
Data Table on Transportation - Market size and forecast 2025-2030 ($ million)
Chart on Transportation - Year-over-year growth 2025-2030 (%)
Data Table on Transportation - Year-over-year growth 2025-2030 (%)

9.6 Disposal - Market size and forecast 2025-2030

Chart on Disposal - Market size and forecast 2025-2030 ($ million)
Data Table on Disposal - Market size and forecast 2025-2030 ($ million)
Chart on Disposal - Year-over-year growth 2025-2030 (%)
Data Table on Disposal - Year-over-year growth 2025-2030 (%)

9.7 Market opportunity by Service

Market opportunity by Service ($ million)
Data Table on Market opportunity by Service ($ million)

10. Market Segmentation by Material

10.1 Market segments

Chart on Material - Market share 2025-2030 (%)
Data Table on Material - Market share 2025-2030 (%)

10.2 Comparison by Material

Chart on Comparison by Material
Data Table on Comparison by Material

10.3 Non-hazardous - Market size and forecast 2025-2030

Chart on Non-hazardous - Market size and forecast 2025-2030 ($ million)
Data Table on Non-hazardous - Market size and forecast 2025-2030 ($ million)
Chart on Non-hazardous - Year-over-year growth 2025-2030 (%)
Data Table on Non-hazardous - Year-over-year growth 2025-2030 (%)

10.4 Hazardous - Market size and forecast 2025-2030

Chart on Hazardous - Market size and forecast 2025-2030 ($ million)
Data Table on Hazardous - Market size and forecast 2025-2030 ($ million)
Chart on Hazardous - Year-over-year growth 2025-2030 (%)
Data Table on Hazardous - Year-over-year growth 2025-2030 (%)

10.5 Market opportunity by Material

Market opportunity by Material ($ million)
Data Table on Market opportunity by Material ($ million)

11. Customer Landscape

11.1 Customer landscape overview

Analysis of price sensitivity, lifecycle, customer purchase basket, adoption rates, and purchase criteria

12. Geographic Landscape

12.1 Geographic segmentation

Chart on Market share by geography 2025-2030 (%)
Data Table on Market share by geography 2025-2030 (%)

12.2 Geographic comparison

Chart on Geographic comparison
Data Table on Geographic comparison

12.3 APAC - Market size and forecast 2025-2030

Chart on APAC - Market size and forecast 2025-2030 ($ million)
Data Table on APAC - Market size and forecast 2025-2030 ($ million)
Chart on APAC - Year-over-year growth 2025-2030 (%)
Data Table on APAC - Year-over-year growth 2025-2030 (%)
Chart on Regional Comparison - APAC
Data Table on Regional Comparison - APAC

12.3.1 China - Market size and forecast 2025-2030

Chart on China - Market size and forecast 2025-2030 ($ million)
Data Table on China - Market size and forecast 2025-2030 ($ million)
Chart on China - Year-over-year growth 2025-2030 (%)
Data Table on China - Year-over-year growth 2025-2030 (%)

12.3.2 India - Market size and forecast 2025-2030

Chart on India - Market size and forecast 2025-2030 ($ million)
Data Table on India - Market size and forecast 2025-2030 ($ million)
Chart on India - Year-over-year growth 2025-2030 (%)
Data Table on India - Year-over-year growth 2025-2030 (%)

12.3.3 Japan - Market size and forecast 2025-2030

Chart on Japan - Market size and forecast 2025-2030 ($ million)
Data Table on Japan - Market size and forecast 2025-2030 ($ million)
Chart on Japan - Year-over-year growth 2025-2030 (%)
Data Table on Japan - Year-over-year growth 2025-2030 (%)

12.3.4 South Korea - Market size and forecast 2025-2030

Chart on South Korea - Market size and forecast 2025-2030 ($ million)
Data Table on South Korea - Market size and forecast 2025-2030 ($ million)
Chart on South Korea - Year-over-year growth 2025-2030 (%)
Data Table on South Korea - Year-over-year growth 2025-2030 (%)

12.3.5 Australia - Market size and forecast 2025-2030

Chart on Australia - Market size and forecast 2025-2030 ($ million)
Data Table on Australia - Market size and forecast 2025-2030 ($ million)
Chart on Australia - Year-over-year growth 2025-2030 (%)
Data Table on Australia - Year-over-year growth 2025-2030 (%)

12.3.6 Indonesia - Market size and forecast 2025-2030

Chart on Indonesia - Market size and forecast 2025-2030 ($ million)
Data Table on Indonesia - Market size and forecast 2025-2030 ($ million)
Chart on Indonesia - Year-over-year growth 2025-2030 (%)
Data Table on Indonesia - Year-over-year growth 2025-2030 (%)

12.4 North America - Market size and forecast 2025-2030

Chart on North America - Market size and forecast 2025-2030 ($ million)
Data Table on North America - Market size and forecast 2025-2030 ($ million)
Chart on North America - Year-over-year growth 2025-2030 (%)
Data Table on North America - Year-over-year growth 2025-2030 (%)
Chart on Regional Comparison - North America
Data Table on Regional Comparison - North America

12.4.1 US - Market size and forecast 2025-2030

Chart on US - Market size and forecast 2025-2030 ($ million)
Data Table on US - Market size and forecast 2025-2030 ($ million)
Chart on US - Year-over-year growth 2025-2030 (%)
Data Table on US - Year-over-year growth 2025-2030 (%)

12.4.2 Canada - Market size and forecast 2025-2030

Chart on Canada - Market size and forecast 2025-2030 ($ million)
Data Table on Canada - Market size and forecast 2025-2030 ($ million)
Chart on Canada - Year-over-year growth 2025-2030 (%)
Data Table on Canada - Year-over-year growth 2025-2030 (%)

12.4.3 Mexico - Market size and forecast 2025-2030

Chart on Mexico - Market size and forecast 2025-2030 ($ million)
Data Table on Mexico - Market size and forecast 2025-2030 ($ million)
Chart on Mexico - Year-over-year growth 2025-2030 (%)
Data Table on Mexico - Year-over-year growth 2025-2030 (%)

12.5 Europe - Market size and forecast 2025-2030

Chart on Europe - Market size and forecast 2025-2030 ($ million)
Data Table on Europe - Market size and forecast 2025-2030 ($ million)
Chart on Europe - Year-over-year growth 2025-2030 (%)
Data Table on Europe - Year-over-year growth 2025-2030 (%)
Chart on Regional Comparison - Europe
Data Table on Regional Comparison - Europe

12.5.1 Germany - Market size and forecast 2025-2030

Chart on Germany - Market size and forecast 2025-2030 ($ million)
Data Table on Germany - Market size and forecast 2025-2030 ($ million)
Chart on Germany - Year-over-year growth 2025-2030 (%)
Data Table on Germany - Year-over-year growth 2025-2030 (%)

12.5.2 UK - Market size and forecast 2025-2030

Chart on UK - Market size and forecast 2025-2030 ($ million)
Data Table on UK - Market size and forecast 2025-2030 ($ million)
Chart on UK - Year-over-year growth 2025-2030 (%)
Data Table on UK - Year-over-year growth 2025-2030 (%)

12.5.3 France - Market size and forecast 2025-2030

Chart on France - Market size and forecast 2025-2030 ($ million)
Data Table on France - Market size and forecast 2025-2030 ($ million)
Chart on France - Year-over-year growth 2025-2030 (%)
Data Table on France - Year-over-year growth 2025-2030 (%)

12.5.4 Italy - Market size and forecast 2025-2030

Chart on Italy - Market size and forecast 2025-2030 ($ million)
Data Table on Italy - Market size and forecast 2025-2030 ($ million)
Chart on Italy - Year-over-year growth 2025-2030 (%)
Data Table on Italy - Year-over-year growth 2025-2030 (%)

12.5.5 Spain - Market size and forecast 2025-2030

Chart on Spain - Market size and forecast 2025-2030 ($ million)
Data Table on Spain - Market size and forecast 2025-2030 ($ million)
Chart on Spain - Year-over-year growth 2025-2030 (%)
Data Table on Spain - Year-over-year growth 2025-2030 (%)

12.5.6 The Netherlands - Market size and forecast 2025-2030

Chart on The Netherlands - Market size and forecast 2025-2030 ($ million)
Data Table on The Netherlands - Market size and forecast 2025-2030 ($ million)
Chart on The Netherlands - Year-over-year growth 2025-2030 (%)
Data Table on The Netherlands - Year-over-year growth 2025-2030 (%)

12.6 Middle East and Africa - Market size and forecast 2025-2030

Chart on Middle East and Africa - Market size and forecast 2025-2030 ($ million)
Data Table on Middle East and Africa - Market size and forecast 2025-2030 ($ million)
Chart on Middle East and Africa - Year-over-year growth 2025-2030 (%)
Data Table on Middle East and Africa - Year-over-year growth 2025-2030 (%)
Chart on Regional Comparison - Middle East and Africa
Data Table on Regional Comparison - Middle East and Africa

12.6.1 Saudi Arabia - Market size and forecast 2025-2030

Chart on Saudi Arabia - Market size and forecast 2025-2030 ($ million)
Data Table on Saudi Arabia - Market size and forecast 2025-2030 ($ million)
Chart on Saudi Arabia - Year-over-year growth 2025-2030 (%)
Data Table on Saudi Arabia - Year-over-year growth 2025-2030 (%)

12.6.2 UAE - Market size and forecast 2025-2030

Chart on UAE - Market size and forecast 2025-2030 ($ million)
Data Table on UAE - Market size and forecast 2025-2030 ($ million)
Chart on UAE - Year-over-year growth 2025-2030 (%)
Data Table on UAE - Year-over-year growth 2025-2030 (%)

12.6.3 South Africa - Market size and forecast 2025-2030

Chart on South Africa - Market size and forecast 2025-2030 ($ million)
Data Table on South Africa - Market size and forecast 2025-2030 ($ million)
Chart on South Africa - Year-over-year growth 2025-2030 (%)
Data Table on South Africa - Year-over-year growth 2025-2030 (%)

12.6.4 Israel - Market size and forecast 2025-2030

Chart on Israel - Market size and forecast 2025-2030 ($ million)
Data Table on Israel - Market size and forecast 2025-2030 ($ million)
Chart on Israel - Year-over-year growth 2025-2030 (%)
Data Table on Israel - Year-over-year growth 2025-2030 (%)

12.6.5 Turkey - Market size and forecast 2025-2030

Chart on Turkey - Market size and forecast 2025-2030 ($ million)
Data Table on Turkey - Market size and forecast 2025-2030 ($ million)
Chart on Turkey - Year-over-year growth 2025-2030 (%)
Data Table on Turkey - Year-over-year growth 2025-2030 (%)

12.7 South America - Market size and forecast 2025-2030

Chart on South America - Market size and forecast 2025-2030 ($ million)
Data Table on South America - Market size and forecast 2025-2030 ($ million)
Chart on South America - Year-over-year growth 2025-2030 (%)
Data Table on South America - Year-over-year growth 2025-2030 (%)
Chart on Regional Comparison - South America
Data Table on Regional Comparison - South America

12.7.1 Brazil - Market size and forecast 2025-2030

Chart on Brazil - Market size and forecast 2025-2030 ($ million)
Data Table on Brazil - Market size and forecast 2025-2030 ($ million)
Chart on Brazil - Year-over-year growth 2025-2030 (%)
Data Table on Brazil - Year-over-year growth 2025-2030 (%)

12.7.2 Argentina - Market size and forecast 2025-2030

Chart on Argentina - Market size and forecast 2025-2030 ($ million)
Data Table on Argentina - Market size and forecast 2025-2030 ($ million)
Chart on Argentina - Year-over-year growth 2025-2030 (%)
Data Table on Argentina - Year-over-year growth 2025-2030 (%)

12.7.3 Chile - Market size and forecast 2025-2030

Chart on Chile - Market size and forecast 2025-2030 ($ million)
Data Table on Chile - Market size and forecast 2025-2030 ($ million)
Chart on Chile - Year-over-year growth 2025-2030 (%)
Data Table on Chile - Year-over-year growth 2025-2030 (%)

12.8 Market opportunity by geography

Market opportunity by geography ($ million)
Data Tables on Market opportunity by geography ($ million)

13. Drivers, Challenges, and Opportunity

13.1 Market drivers

Strategic mainstreaming of industrial wastewater recycling and circularity
Strict environmental standards and evolution of rigorous compliance
Rapid urbanization and modernization of municipal infrastructure assets

13.2 Market challenges

High capital expenditure and energy intensity of advanced treatment infrastructure
Regulatory stringency and complexity of emerging contaminant mitigation
Operational burden of decentralized waste processing and traceability mandates

13.3 Impact of drivers and challenges

Impact of drivers and challenges in 2025 and 2030

13.4 Market opportunities

Institutionalization of decentralized and modular treatment infrastructure
Growth of digital twin technology and live virtual replication
Expansion of circular recovery for critical minerals and nutrients

14. Competitive Landscape

14.1 Overview

14.2

Overview on criticality of inputs and factors of differentiation

14.3 Landscape disruption

Overview on factors of disruption

14.4 Industry risks

Impact of key risks on business

15. Competitive Analysis

15.1 Companies profiled

Companies covered

15.2 Company ranking index

15.3 Market positioning of companies

Matrix on companies position and classification

15.4 Casella Waste Systems Inc.

Casella Waste Systems Inc. - Overview
Casella Waste Systems Inc. - Business segments
Casella Waste Systems Inc. - Key offerings
Casella Waste Systems Inc. - Segment focus
SWOT

15.5 Clean Harbors Inc.

Clean Harbors Inc. - Overview
Clean Harbors Inc. - Business segments
Clean Harbors Inc. - Key news
Clean Harbors Inc. - Key offerings
Clean Harbors Inc. - Segment focus
SWOT

15.6 Cleanaway Waste Management Ltd.

Cleanaway Waste Management Ltd. - Overview
Cleanaway Waste Management Ltd. - Business segments
Cleanaway Waste Management Ltd. - Key offerings
Cleanaway Waste Management Ltd. - Segment focus
SWOT

15.7 Enva

Enva - Overview
Enva - Product / Service
Enva - Key offerings
SWOT

15.8 Enviri Corp.

Enviri Corp. - Overview
Enviri Corp. - Business segments
Enviri Corp. - Key offerings
Enviri Corp. - Segment focus
SWOT

15.9 GFL Environmental Inc.

GFL Environmental Inc. - Overview
GFL Environmental Inc. - Business segments
GFL Environmental Inc. - Key offerings
GFL Environmental Inc. - Segment focus
SWOT

15.10 Grupo Tradebe Medioambiente SL

Grupo Tradebe Medioambiente SL - Overview
Grupo Tradebe Medioambiente SL - Product / Service
Grupo Tradebe Medioambiente SL - Key offerings
SWOT

15.11 Heritage Crystal Clean Inc.

Heritage Crystal Clean Inc. - Overview
Heritage Crystal Clean Inc. - Product / Service
Heritage Crystal Clean Inc. - Key offerings
SWOT

15.12 Remondis SE and Co. KG

Remondis SE and Co. KG - Overview
Remondis SE and Co. KG - Product / Service
Remondis SE and Co. KG - Key offerings
SWOT

15.13 Republic Services Inc.

Republic Services Inc. - Overview
Republic Services Inc. - Business segments
Republic Services Inc. - Key news
Republic Services Inc. - Key offerings
Republic Services Inc. - Segment focus
SWOT

15.14 ReWorld Waste

ReWorld Waste - Overview
ReWorld Waste - Product / Service
ReWorld Waste - Key offerings
SWOT

15.15 Seche Environnement SA

Seche Environnement SA - Overview
Seche Environnement SA - Business segments
Seche Environnement SA - Key offerings
Seche Environnement SA - Segment focus
SWOT

15.16 SUEZ SA

SUEZ SA - Overview
SUEZ SA - Product / Service
SUEZ SA - Key offerings
SWOT

15.17 Veolia Environment SA

Veolia Environment SA - Overview
Veolia Environment SA - Business segments
Veolia Environment SA - Key news
Veolia Environment SA - Key offerings
Veolia Environment SA - Segment focus
SWOT

15.18 Waste Management Inc.

Waste Management Inc. - Overview
Waste Management Inc. - Business segments
Waste Management Inc. - Key news
Waste Management Inc. - Key offerings
Waste Management Inc. - Segment focus
SWOT

16. Appendix

16.1 Scope of the report

Market definition
Objectives
Notes and caveats

16.2 Inclusions and exclusions checklist

Inclusions checklist
Exclusions checklist

16.3 Currency conversion rates for US$

16.4 Research methodology

16.5 Data procurement

Information sources

16.6 Data validation

16.7 Validation techniques employed for market sizing

16.8 Data synthesis

16.9 360 degree market analysis

16.10 List of abbreviations

Research Methodology

Technavio presents a detailed picture of the market by way of study, synthesis, and summation of data from multiple sources. The analysts have presented the various facets of the market with a particular focus on identifying the key industry influencers. The data thus presented is comprehensive, reliable, and the result of extensive research, both primary and secondary.

INFORMATION SOURCES

Primary sources

  • Manufacturers and suppliers
  • Channel partners
  • Industry experts
  • Strategic decision makers

Secondary sources

  • Industry journals and periodicals
  • Government data
  • Financial reports of key industry players
  • Historical data
  • Press releases

DATA ANALYSIS

Data Synthesis

  • Collation of data
  • Estimation of key figures
  • Analysis of derived insights

Data Validation

  • Triangulation with data models
  • Reference against proprietary databases
  • Corroboration with industry experts

REPORT WRITING

Qualitative

  • Market drivers
  • Market challenges
  • Market trends
  • Five forces analysis

Quantitative

  • Market size and forecast
  • Market segmentation
  • Geographical insights
  • Competitive landscape

Interested in this report?

Get your sample now to see our research methodology and insights!

Download Now

Frequently Asked Questions

Liquid Waste Management market growth will increase by USD 26592.3 million during 2026-2030.

The Liquid Waste Management market is expected to grow at a CAGR of 4.8% during 2026-2030.

Liquid Waste Management market is segmented by Source (Industrial, Municipal) Service (Treatment, Collection, Transportation, Disposal) Material (Non-hazardous, Hazardous)

Augean plc, Casella Waste Systems Inc., Clean Harbors Inc., Cleanaway Waste Management Ltd., Enva, Enviri Corp., GFL Environmental Inc., Grupo Tradebe Medioambiente SL, Heritage Crystal Clean Inc., Remondis SE and Co. KG, Republic Services Inc., ReWorld Waste, Seche Environnement SA, SUEZ SA, Veolia Environment SA, Waste Management Inc., Whites Recycling Ltd. are a few of the key vendors in the Liquid Waste Management market.

APAC will register the highest growth rate of 54.5% among the other regions. Therefore, the Liquid Waste Management market in APAC is expected to garner significant business opportunities for the vendors during the forecast period.

China, India, Japan, South Korea, Australia, Indonesia, US, Canada, Mexico, Germany, UK, France, Italy, Spain, The Netherlands, Saudi Arabia, UAE, South Africa, Israel, Turkey, Brazil, Argentina, Chile

  • Strategic mainstreaming of industrial wastewater recycling and circularity is the driving factor this market.

The Liquid Waste Management market vendors should focus on grabbing business opportunities from the Source segment as it accounted for the largest market share in the base year.
RIA - Research AI Assistant
Ask RIA