Water Quality Monitoring Equipment Market Analysis North America, APAC, Europe, Middle East and Africa, South America - US, China, Germany, Japan, UK - Size and Forecast 2024-2028

Water Quality Monitoring Equipment Market Analysis North America, APAC, Europe, Middle East and Africa, South America - US, China, Germany, Japan, UK - Size and Forecast 2024-2028

Published: Aug 2024 159 Pages SKU: IRTNTR45791

Market Overview at a Glance

$979.3 Mn
Market Opportunity
4.5%
CAGR
4.23
YoY growth 2023-2024(%)

Water Quality Monitoring Equipment Market Size 2024-2028

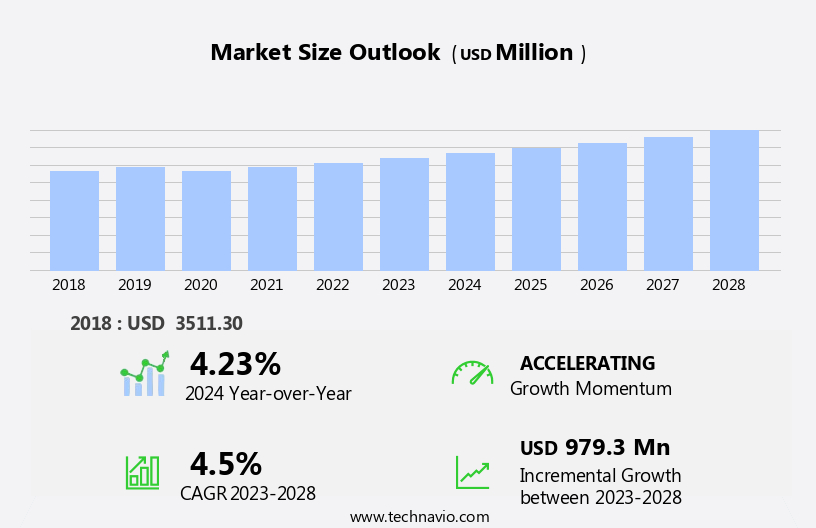
The water quality monitoring equipment market size is forecast to increase by USD 979.3 million at a CAGR of 4.5% between 2023 and 2028.

  • The market is witnessing significant growth due to increasing concerns over the adverse effects of pollution on drinking water. The rising adoption of smart water networks is another key trend driving market growth. In developing countries, the lack of proper water infrastructure exacerbates the need for advanced water quality monitoring solutions. These factors are expected to boost market growth during the forecast period. Additionally, stringent regulations and growing awareness about water quality are further propelling market expansion. The market is anticipated to experience robust growth, providing ample opportunities for stakeholders.
  • What will be the Size of the Water Quality Monitoring Equipment Market During the Forecast Period?

    Water Quality Monitoring Equipment Market Size

     Request Free Sample

  • The market encompasses the supply of hardware units designed to measure and analyze various water quality parameters for surface water bodies and native groundwater. Key water testing parameters include temperature, pH, dissolved oxygen, turbidity, nitrates, phosphates, and heavy metals. These sensors employ advanced technologies such as turbidity sensors, dissolved oxygen sensors, pH sensors, conductivity sensors, chlorine sensors, and ORP sensors to ensure accurate readings. The market is driven by growing concerns over ecosystem health and the need for continuous monitoring to ensure compliance with regulatory standards. Macroinvertebrates and other biological indicators are also used to assess water quality. Detention times, hydrological models, tracer breakthrough data, and chemical reactions are essential considerations In the design and implementation of water quality monitoring systems.
  • Phosphorus and nitrogen levels are critical water quality parameters, particularly In the context of eutrophication and nutrient pollution. Heavy metals, such as lead, mercury, and cadmium, are also of concern due to their potential toxicity and impact on ecosystem health. The market is expected to grow as demand for water quality monitoring increases in various sectors, including agriculture, industrial, and municipal applications.
  • How is this Water Quality Monitoring Equipment Industry segmented and which is the largest segment?

    The water quality monitoring equipment industry research report provides comprehensive data (region-wise segment analysis), with forecasts and estimates in "USD million" for the period 2024-2028, as well as historical data from 2018-2022 for the following segments.

    • Application
      • Groundwater
      • Drinking water
      • Wastewater
      • Aquaculture
      • Others
    • Geography
      • North America
        • US
      • APAC
        • China
        • Japan
      • Europe
        • Germany
        • UK
      • Middle East and Africa
        • South America

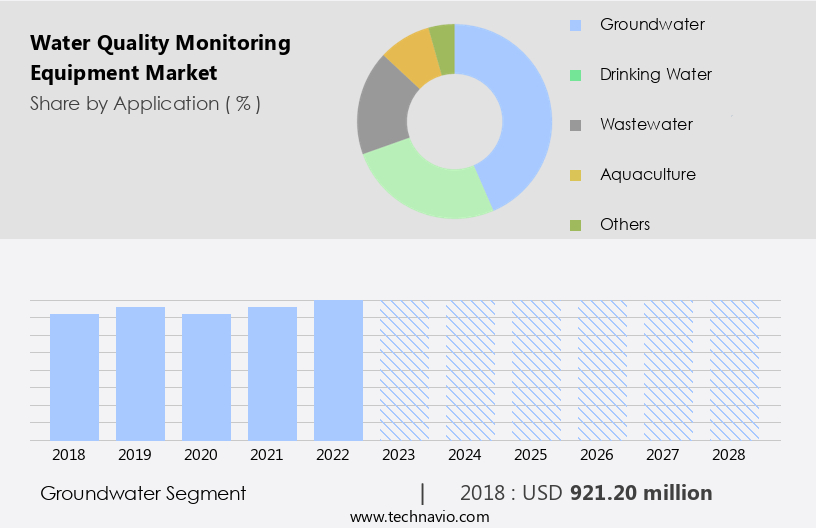
        By Application Insights

        • The groundwater segment is estimated to witness significant growth during the forecast period.

        Water quality monitoring is a critical aspect of ensuring the health of surface water bodies and groundwater resources. Various hardware units, including temperature sensors, turbidity sensors, dissolved oxygen sensors, pH sensors, conductivity sensors, chlorine sensors, ORP sensors, and spectrophotometers, are employed to measure water quality parameters such as temperature, turbidity, dissolved oxygen, pH, salinity, and nutrients like nitrates, phosphates, and chlorophyll. These parameters are essential indicators of ecosystem health and public health monitoring. Water testing is carried out in both online and laboratory settings to determine the presence of heavy metals, nutrients, and other contaminants. Groundwater, a primary source of drinking water, is often tested for native groundwater and target aquifer characteristics, such as detention times, hydrological models, tracer breakthrough data, and chemical reactions.

        Surface water bodies, including lakes, rivers, and wetlands, are monitored for nutrient levels, water clarity, and oxygen. Regulatory requirements mandate regular water quality monitoring to ensure compliance with drinking water standards and public health safety. Distribution systems and drinking water are also subject to monitoring for disinfectant residual and other contaminants. The integration of advanced technologies, such as chemical sensors and regression models, enhances the accuracy and efficiency of water quality monitoring. A ground object spectrometer is another tool used to analyze water quality by measuring the spectral reflectance of water samples. Overall, water quality monitoring is crucial for maintaining ecosystem health and ensuring the safety and availability of clean water for various uses.

        Water Quality Monitoring Equipment Market Size

        Get a glance at the  Water Quality Monitoring Equipment Industry report of share of various segments Request Free Sample

        The Groundwater segment was valued at USD 921.20 million in 2018 and showed a gradual increase during the forecast period.
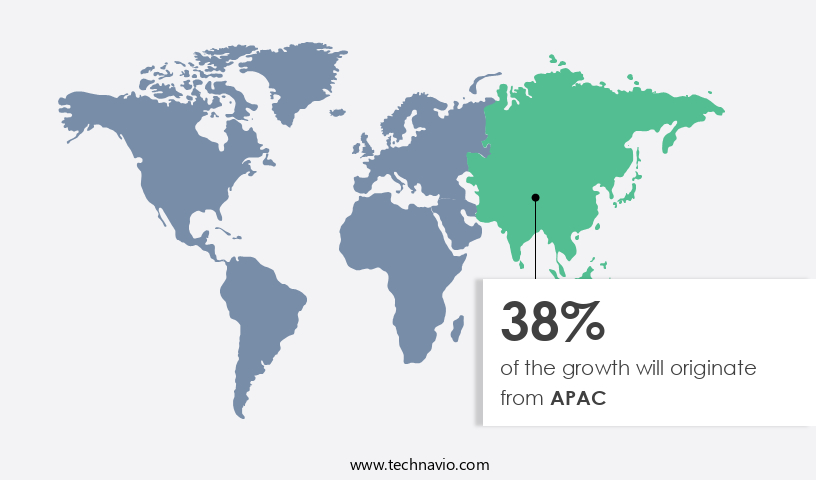
        Regional Analysis

        • APAC is estimated to contribute 38% to the growth of the global market during the forecast period.

        Technavio’s analysts have elaborately explained the regional trends and drivers that shape the market during the forecast period.

        Water Quality Monitoring Equipment Market Share by Geography

        For more insights on the market share of various regions, Request Free Sample

        The market In the US is expected to experience growth due to the increasing demand for fresh water and the need to address environmental concerns. This growth will primarily stem from new construction projects, upgrades, and expansions withIn the water and wastewater industry. The United States and Canada are significant contributors to this market, driven by the high adoption of water quality sensors and stringent regulations set by the Environmental Protection Agency (EPA). The Clean Water Act (CWA) and Safe Drinking Water Act (SDWA) are two federal policy programs In the US that prioritize water quality, ensuring compliance with strict norms.

        Water quality parameters such as temperature, pH, dissolved oxygen, turbidity, nitrates, phosphates, and chlorine are closely monitored to maintain ecosystem health and public health. Water testing for analytes like salinity, water clarity, and nutrients (phosphorus, nitrogen, and chlorophyll) is essential for both surface water bodies and groundwater sources, including native groundwater and target aquifers. The use of advanced sensors, such as dissolved oxygen sensors, pH sensors, conductivity sensors, and ORP sensors, plays a crucial role in real-time monitoring and ensuring regulatory requirements are met. Additionally, laboratory analysis and public health monitoring through sampling and analysis are essential components of the water quality monitoring process.

        Market Dynamics

        Our  researchers analyzed the data with 2023 as the base year, along with the key drivers, trends, and challenges. A holistic analysis of drivers will help companies refine their marketing strategies to gain a competitive advantage.

        What are the key market drivers leading to the rise In the adoption of Water Quality Monitoring Equipment Industry?

        Increasing pollution adversely affecting quality of drinking water is the key driver of the market.

      • Water quality monitoring equipment is essential for utilities to ensure the delivery of clean and safe water to consumers, particularly In the face of changing climatic conditions leading to increased pollution and natural disasters. These events can cause delays in repair and retrofitting activities, resulting in public backlash. To mitigate these risks, water utilities are investing in advanced water quality monitoring systems. For instance, hardware units such as temperature sensors, turbidity sensors, dissolved oxygen sensors, pH sensors, conductivity sensors, chlorine sensors, and ORP sensors, are used to measure various water quality parameters, including temperature, turbidity, dissolved oxygen, pH, salinity, and nutrients.
      • Moreover, advanced technologies like Chemcatcher, groundwater object spectrometer, and regression models, are used to analyze water samples for heavy metals, phosphorus, nitrogen, nitrates, phosphates, and chlorophyll. These analyses are crucial for ecosystem health monitoring and public health safety. Utilities can also use hydrological models and tracer breakthrough data to understand chemical reactions and distribution systems' performance. Regulatory requirements mandate regular sampling and analysis of water quality parameters to ensure compliance with drinking water standards. Online sensors provide real-time data, enabling utilities to take prompt action when necessary. In summary, water quality monitoring equipment plays a vital role in ensuring the delivery of clean and safe water, particularly In the context of changing climatic conditions and increased natural disasters.
      • What are the market trends shaping the Water Quality Monitoring Equipment Industry?

        Adoption of smart water networks is the upcoming market trend.

      • Water quality monitoring is a critical aspect of maintaining the health of surface water bodies and ensuring the safety of drinking water. Utilities In the US are under increasing pressure to address the challenges posed by aging infrastructure, leading to the adoption of advanced water quality monitoring equipment. This technology enables real-time monitoring of water quality parameters such as temperature, pH, turbidity, dissolved oxygen, nitrates, phosphates, and chlorine residuals. Hardware units like temperature sensors, pH sensors, conductivity sensors, and dissolved oxygen sensors are essential components of water quality monitoring systems. These sensors help utilities detect changes in water quality and diagnose potential issues.
      • Water testing is also an integral part of water quality monitoring, with laboratories analyzing samples for various analytes, including salinity, water clarity, nutrients, heavy metals, and chlorophyll. The use of online sensors and spectrometers, such as ground object spectrometers, allows for continuous monitoring of water quality parameters. This data is crucial for identifying trends and ensuring regulatory compliance. Regulatory requirements for public health monitoring and drinking water distribution systems necessitate regular sampling and analysis. Ecosystem health is another critical consideration in water quality monitoring. Macroinvertebrates, for instance, are sensitive indicators of water quality and can provide valuable insights into the health of aquatic ecosystems.
      • Hydrological models, tracer breakthrough data, and chemical reactions are also essential tools for understanding water quality dynamics and predicting potential issues. In conclusion, the demand for water quality monitoring equipment is driven by the need to ensure the safety and quality of drinking water and protect aquatic ecosystems. The adoption of smart water networks and advanced monitoring technologies is helping utilities address the challenges posed by aging infrastructure and ensure regulatory compliance.
      • What challenges does the Water Quality Monitoring Equipment Industry face during its growth?

        Lack of water infrastructure in developing countries is a key challenge affecting the industry growth.

      • The market plays a crucial role in ensuring the safety and suitability of water for various applications, including drinking water, surface water bodies, and groundwater. Water quality parameters such as temperature, pH, turbidity, dissolved oxygen, nitrates, phosphates, chlorine, ORP, and conductivity are essential for assessing the health of ecosystems and public health. Hardware units like temperature sensors, pH sensors, dissolved oxygen sensors, turbidity sensors, and conductivity sensors are integral to monitoring these parameters. Water testing is a critical aspect of water quality management, with laboratories analyzing samples for target aquifers, native groundwater, and distribution systems. Regulatory requirements mandate regular monitoring and analysis of water quality to ensure compliance with drinking water standards and protect public health.
      • Water pollution, particularly in developing countries, poses significant challenges to the market. Developing countries like China and India face issues with water treatment and wastewater disposal, leading to a scarcity of potable water. Inadequate maintenance of infrastructure such as roads, pipes, treatment plants, and wells further exacerbates the problem. To address these challenges, advanced technologies like spectroscopy, regression models, and ground object spectrometers are being employed for online monitoring and analysis of water quality parameters. These technologies enable real-time monitoring of water quality, reducing the need for labor-intensive and time-consuming sampling and analysis processes. Water quality monitoring is essential for ensuring the health of ecosystems and human populations.
      • Contaminants such as phosphorus, nitrogen, and heavy metals can have detrimental effects on ecosystem health and public health. Monitoring these contaminants is crucial for ensuring the safety and suitability of water for various applications. In conclusion, the market plays a vital role in ensuring the safety and suitability of water for various applications. Advanced technologies and innovative solutions are being employed to address the challenges posed by water pollution and inadequate infrastructure in developing countries. Continuous monitoring and analysis of water quality parameters are essential for protecting public health and ensuring the health of ecosystems.
      • Exclusive Customer Landscape

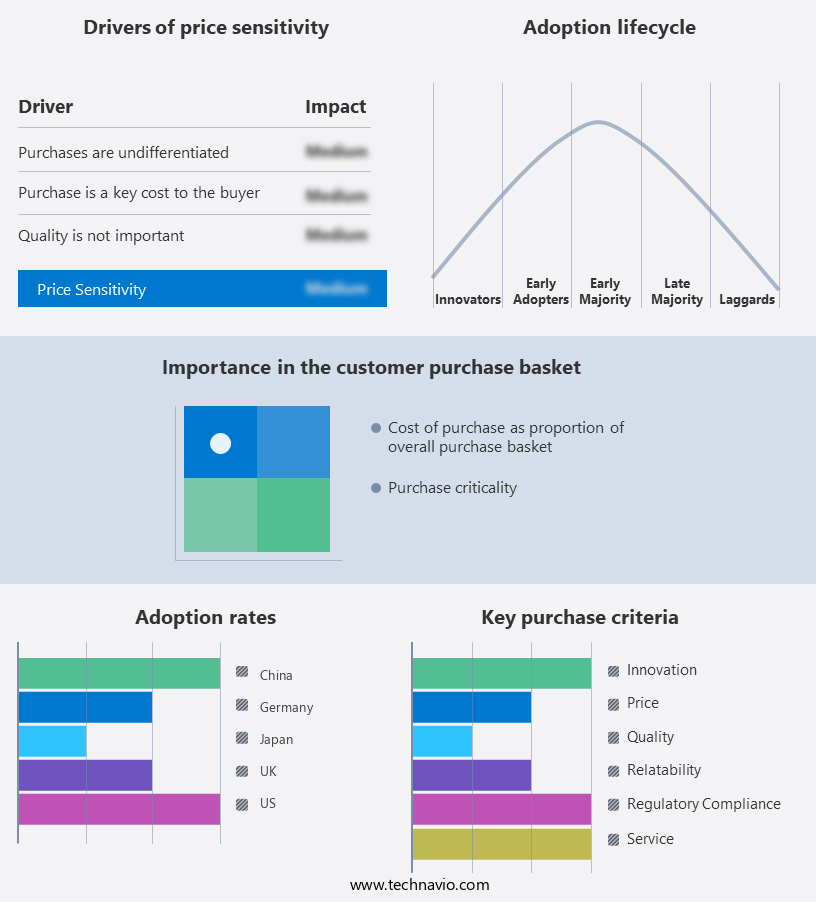
        The water quality monitoring equipment market forecasting report includes the adoption lifecycle of the market, covering from the innovator’s stage to the laggard’s stage. It focuses on adoption rates in different regions based on penetration. Furthermore, the water quality monitoring equipment market report also includes key purchase criteria and drivers of price sensitivity to help companies evaluate and develop their market growth analysis strategies.

        Water Quality Monitoring Equipment Market Share by Geography

         Customer Landscape

        Key Companies & Market Insights

        Companies are implementing various strategies, such as strategic alliances, water quality monitoring equipment market forecast, partnerships, mergers and acquisitions, geographical expansion, and product/service launches, to enhance their presence In the industry.

        Aeron Systems Pvt. Ltd. - The company provides comprehensive water quality monitoring solutions encompassing equipment like the EPA 200.8 Water Analyzer. This integrated offering includes hardware, software, consumables, professional services, and documentation, enabling accurate and efficient water quality analysis.

        The industry research and growth report includes detailed analyses of the competitive landscape of the market and information about key companies, including:

        • Aeron Systems Pvt. Ltd.
        • Agilent Technologies Inc.
        • Atlas Scientific LLC
        • Campbell Scientific Inc.
        • Danaher Corp.
        • Environmental Holdings Pty Ltd.
        • General Electric Co.
        • Geotech Environmental Equipment Inc.
        • Hanna Instruments Inc.
        • HORIBA Ltd.
        • Hydro International Ltd.
        • In Situ Inc.
        • Libelium Comunicaciones Distribuidas SL
        • Metex Corp. Ltd.
        • National Institute of Water and Atmospheric Research Ltd.
        • Optiqua Technologies Pte Ltd.
        • RS Hydro Ltd.
        • Sea Bird Scientific
        • Stevens Water Monitoring Systems Inc.
        • Thermo Fisher Scientific Inc.
        • Xylem Inc.

        Qualitative and quantitative analysis of companies has been conducted to help clients understand the wider business environment as well as the strengths and weaknesses of key industry players. Data is qualitatively analyzed to categorize companies as pure play, category-focused, industry-focused, and diversified; it is quantitatively analyzed to categorize companies as dominant, leading, strong, tentative, and weak.

        Research Analyst Overview

        The market encompasses a range of hardware units designed to measure various water quality parameters. These parameters include temperature, pH, turbidity, dissolved oxygen, conductivity, chlorine residual, and other analytes such as nitrates, phosphates, and heavy metals. Water testing is an essential aspect of ensuring the health of surface water bodies and native groundwater. The monitoring of water quality parameters plays a crucial role in assessing the ecosystem health and identifying potential contamination sources. This information is vital for both public health monitoring and regulatory compliance. Temperature sensors are used to measure the temperature of water, which is an essential parameter for determining the health of aquatic ecosystems.

        Macroinvertebrates, for instance, are sensitive to changes in water temperature and can indicate the overall health of a water body. PH sensors are used to measure the acidity or basicity of water. PH levels can significantly impact the health of aquatic organisms and the chemical reactions that occur in water. Dissolved oxygen sensors measure the amount of oxygen present in water. Oxygen levels are crucial for the survival of aquatic organisms and can indicate the overall health of a water body. Conductivity sensors measure the ability of water to conduct an electrical current. This parameter is essential for determining the salinity of water and can indicate the presence of dissolved ions and minerals.

        Chlorine sensors are used to measure the level of chlorine residual in water. Chlorine is commonly used as a disinfectant in drinking water distribution systems and is essential for maintaining public health. ORP (Oxidation-Reduction Potential) sensors measure the ability of water to oxidize or reduce other substances. ORP is an essential parameter for assessing the water quality in relation to the presence of redox-active compounds. Turbidity sensors measure the cloudiness or clarity of water. Turbidity can impact the health of aquatic organisms and can indicate the presence of suspended particles or contaminants. The use of advanced technologies such as spectroscopy and regression models has revolutionized water quality monitoring.

        Ground object spectrometers, for instance, can be used to measure the spectral characteristics of water, providing valuable information on the presence of various analytes. Water quality monitoring is essential for ensuring the health of both surface water bodies and native groundwater. The use of online sensors and real-time data analysis has made it possible to monitor water quality continuously, enabling early detection of contamination events and prompt response to mitigate their impact. Regulatory requirements play a significant role in driving the demand for water quality monitoring equipment. Drinking water regulations, for instance, require regular monitoring of water quality parameters to ensure the safety of public health.

        In conclusion, the market is a dynamic and essential industry that plays a crucial role in ensuring the health of aquatic ecosystems and public health. The use of advanced technologies and real-time data analysis has made it possible to monitor water quality continuously, enabling prompt response to contamination events and maintaining regulatory compliance.

        Market Scope

        Report Coverage

        Details

        Page number

        159

        Base year

        2023

        Historic period

        2018-2022

        Forecast period

        2024-2028

        Growth momentum & CAGR

        Accelerate at a CAGR of 4.5%

        Market growth 2024-2028

        USD 979.3 million

        Market structure

        Fragmented

        YoY growth 2023-2024(%)

        4.23

        Key countries

        US, China, Germany, Japan, and UK

        Competitive landscape

        Leading Companies, Market Positioning of Companies, Competitive Strategies, and Industry Risks

        Request Free Sample

        What are the Key Data Covered in this Water Quality Monitoring Equipment Market Research and Growth Report?

        • CAGR of the Water Quality Monitoring Equipment industry during the forecast period
        • Detailed information on factors that will drive the growth and forecasting between 2024 and 2028
        • Precise estimation of the size of the market and its contribution of the industry in focus to the parent market
        • Accurate predictions about upcoming growth and trends and changes in consumer behaviour
        • Growth of the market across North America, APAC, Europe, Middle East and Africa, and South America
        • Thorough analysis of the market’s competitive landscape and detailed information about companies
        • Comprehensive analysis of factors that will challenge the water quality monitoring equipment market growth of industry companies

        We can help! Our analysts can customize this water quality monitoring equipment market research report to meet your requirements.

        Get in touch


        1 Executive Summary

        • 1.1 Market overview
          • Executive Summary - Chart on Market Overview
          • Executive Summary - Data Table on Market Overview
          • Executive Summary - Chart on Global Market Characteristics
          • Executive Summary - Chart on Market by Geography
          • Executive Summary - Chart on Market Segmentation by Application
          • Executive Summary - Chart on Incremental Growth
          • Executive Summary - Data Table on Incremental Growth
          • Executive Summary - Chart on Company Market Positioning

        2 Market Landscape

        • 2.1 Market ecosystem
          • Parent Market
          • Data Table on - Parent Market
        • 2.2 Market characteristics
          • Market characteristics analysis
        • 2.3 Value chain analysis
          • Value Chain Analysis

        3 Market Sizing

        • 3.1 Market definition
          • Offerings of companies included in the market definition
        • 3.2 Market segment analysis
          • Market segments
        • 3.3 Market size 2023
          • 3.4 Market outlook: Forecast for 2023-2028
            • Chart on Global - Market size and forecast 2023-2028 ($ million)
            • Data Table on Global - Market size and forecast 2023-2028 ($ million)
            • Chart on Global Market: Year-over-year growth 2023-2028 (%)
            • Data Table on Global Market: Year-over-year growth 2023-2028 (%)

          4 Historic Market Size

          • 4.1 Global Water Quality Monitoring Equipment Market 2018 - 2022
            • Historic Market Size - Data Table on Global Water Quality Monitoring Equipment Market 2018 - 2022 ($ million)
          • 4.2 Application segment analysis 2018 - 2022
            • Historic Market Size - Application Segment 2018 - 2022 ($ million)
          • 4.3 Geography segment analysis 2018 - 2022
            • Historic Market Size - Geography Segment 2018 - 2022 ($ million)
          • 4.4 Country segment analysis 2018 - 2022
            • Historic Market Size - Country Segment 2018 - 2022 ($ million)

          5 Five Forces Analysis

          • 5.1 Five forces summary
            • Five forces analysis - Comparison between 2023 and 2028
          • 5.2 Bargaining power of buyers
            • Bargaining power of buyers - Impact of key factors 2023 and 2028
          • 5.3 Bargaining power of suppliers
            • Bargaining power of suppliers - Impact of key factors in 2023 and 2028
          • 5.4 Threat of new entrants
            • Threat of new entrants - Impact of key factors in 2023 and 2028
          • 5.5 Threat of substitutes
            • Threat of substitutes - Impact of key factors in 2023 and 2028
          • 5.6 Threat of rivalry
            • Threat of rivalry - Impact of key factors in 2023 and 2028
          • 5.7 Market condition
            • Chart on Market condition - Five forces 2023 and 2028

          6 Market Segmentation by Application

          • 6.1 Market segments
            • Chart on Application - Market share 2023-2028 (%)
            • Data Table on Application - Market share 2023-2028 (%)
          • 6.2 Comparison by Application
            • Chart on Comparison by Application
            • Data Table on Comparison by Application
          • 6.3 Groundwater - Market size and forecast 2023-2028
            • Chart on Groundwater - Market size and forecast 2023-2028 ($ million)
            • Data Table on Groundwater - Market size and forecast 2023-2028 ($ million)
            • Chart on Groundwater - Year-over-year growth 2023-2028 (%)
            • Data Table on Groundwater - Year-over-year growth 2023-2028 (%)
          • 6.4 Drinking water - Market size and forecast 2023-2028
            • Chart on Drinking water - Market size and forecast 2023-2028 ($ million)
            • Data Table on Drinking water - Market size and forecast 2023-2028 ($ million)
            • Chart on Drinking water - Year-over-year growth 2023-2028 (%)
            • Data Table on Drinking water - Year-over-year growth 2023-2028 (%)
          • 6.5 Wastewater - Market size and forecast 2023-2028
            • Chart on Wastewater - Market size and forecast 2023-2028 ($ million)
            • Data Table on Wastewater - Market size and forecast 2023-2028 ($ million)
            • Chart on Wastewater - Year-over-year growth 2023-2028 (%)
            • Data Table on Wastewater - Year-over-year growth 2023-2028 (%)
          • 6.6 Aquaculture - Market size and forecast 2023-2028
            • Chart on Aquaculture - Market size and forecast 2023-2028 ($ million)
            • Data Table on Aquaculture - Market size and forecast 2023-2028 ($ million)
            • Chart on Aquaculture - Year-over-year growth 2023-2028 (%)
            • Data Table on Aquaculture - Year-over-year growth 2023-2028 (%)
          • 6.7 Others - Market size and forecast 2023-2028
            • Chart on Others - Market size and forecast 2023-2028 ($ million)
            • Data Table on Others - Market size and forecast 2023-2028 ($ million)
            • Chart on Others - Year-over-year growth 2023-2028 (%)
            • Data Table on Others - Year-over-year growth 2023-2028 (%)
          • 6.8 Market opportunity by Application
            • Market opportunity by Application ($ million)
            • Data Table on Market opportunity by Application ($ million)

          7 Customer Landscape

          • 7.1 Customer landscape overview
            • Analysis of price sensitivity, lifecycle, customer purchase basket, adoption rates, and purchase criteria

          8 Geographic Landscape

          • 8.1 Geographic segmentation
            • Chart on Market share by geography 2023-2028 (%)
            • Data Table on Market share by geography 2023-2028 (%)
          • 8.2 Geographic comparison
            • Chart on Geographic comparison
            • Data Table on Geographic comparison
          • 8.3 North America - Market size and forecast 2023-2028
            • Chart on North America - Market size and forecast 2023-2028 ($ million)
            • Data Table on North America - Market size and forecast 2023-2028 ($ million)
            • Chart on North America - Year-over-year growth 2023-2028 (%)
            • Data Table on North America - Year-over-year growth 2023-2028 (%)
          • 8.4 APAC - Market size and forecast 2023-2028
            • Chart on APAC - Market size and forecast 2023-2028 ($ million)
            • Data Table on APAC - Market size and forecast 2023-2028 ($ million)
            • Chart on APAC - Year-over-year growth 2023-2028 (%)
            • Data Table on APAC - Year-over-year growth 2023-2028 (%)
          • 8.5 Europe - Market size and forecast 2023-2028
            • Chart on Europe - Market size and forecast 2023-2028 ($ million)
            • Data Table on Europe - Market size and forecast 2023-2028 ($ million)
            • Chart on Europe - Year-over-year growth 2023-2028 (%)
            • Data Table on Europe - Year-over-year growth 2023-2028 (%)
          • 8.6 Middle East and Africa - Market size and forecast 2023-2028
            • Chart on Middle East and Africa - Market size and forecast 2023-2028 ($ million)
            • Data Table on Middle East and Africa - Market size and forecast 2023-2028 ($ million)
            • Chart on Middle East and Africa - Year-over-year growth 2023-2028 (%)
            • Data Table on Middle East and Africa - Year-over-year growth 2023-2028 (%)
          • 8.7 South America - Market size and forecast 2023-2028
            • Chart on South America - Market size and forecast 2023-2028 ($ million)
            • Data Table on South America - Market size and forecast 2023-2028 ($ million)
            • Chart on South America - Year-over-year growth 2023-2028 (%)
            • Data Table on South America - Year-over-year growth 2023-2028 (%)
          • 8.8 US - Market size and forecast 2023-2028
            • Chart on US - Market size and forecast 2023-2028 ($ million)
            • Data Table on US - Market size and forecast 2023-2028 ($ million)
            • Chart on US - Year-over-year growth 2023-2028 (%)
            • Data Table on US - Year-over-year growth 2023-2028 (%)
          • 8.9 China - Market size and forecast 2023-2028
            • Chart on China - Market size and forecast 2023-2028 ($ million)
            • Data Table on China - Market size and forecast 2023-2028 ($ million)
            • Chart on China - Year-over-year growth 2023-2028 (%)
            • Data Table on China - Year-over-year growth 2023-2028 (%)
          • 8.10 Germany - Market size and forecast 2023-2028
            • Chart on Germany - Market size and forecast 2023-2028 ($ million)
            • Data Table on Germany - Market size and forecast 2023-2028 ($ million)
            • Chart on Germany - Year-over-year growth 2023-2028 (%)
            • Data Table on Germany - Year-over-year growth 2023-2028 (%)
          • 8.11 Japan - Market size and forecast 2023-2028
            • Chart on Japan - Market size and forecast 2023-2028 ($ million)
            • Data Table on Japan - Market size and forecast 2023-2028 ($ million)
            • Chart on Japan - Year-over-year growth 2023-2028 (%)
            • Data Table on Japan - Year-over-year growth 2023-2028 (%)
          • 8.12 UK - Market size and forecast 2023-2028
            • Chart on UK - Market size and forecast 2023-2028 ($ million)
            • Data Table on UK - Market size and forecast 2023-2028 ($ million)
            • Chart on UK - Year-over-year growth 2023-2028 (%)
            • Data Table on UK - Year-over-year growth 2023-2028 (%)
          • 8.13 Market opportunity by geography
            • Market opportunity by geography ($ million)
            • Data Tables on Market opportunity by geography ($ million)

          9 Drivers, Challenges, and Opportunity/Restraints

          • 9.1 Market drivers
            • 9.2 Market challenges
              • 9.3 Impact of drivers and challenges
                • Impact of drivers and challenges in 2023 and 2028
              • 9.4 Market opportunities/restraints

                10 Competitive Landscape

                • 10.1 Overview
                  • 10.2 Competitive Landscape
                    • Overview on criticality of inputs and factors of differentiation
                  • 10.3 Landscape disruption
                    • Overview on factors of disruption
                  • 10.4 Industry risks
                    • Impact of key risks on business

                  11 Competitive Analysis

                  • 11.1 Companies profiled
                    • Companies covered
                  • 11.2 Market positioning of companies
                    • Matrix on companies position and classification
                  • 11.3 Agilent Technologies Inc.
                    • Agilent Technologies Inc. - Overview
                    • Agilent Technologies Inc. - Business segments
                    • Agilent Technologies Inc. - Key news
                    • Agilent Technologies Inc. - Key offerings
                    • Agilent Technologies Inc. - Segment focus
                  • 11.4 Atlas Scientific LLC
                    • Atlas Scientific LLC - Overview
                    • Atlas Scientific LLC - Product / Service
                    • Atlas Scientific LLC - Key offerings
                  • 11.5 Campbell Scientific Inc.
                    • Campbell Scientific Inc. - Overview
                    • Campbell Scientific Inc. - Product / Service
                    • Campbell Scientific Inc. - Key offerings
                  • 11.6 Danaher Corp.
                    • Danaher Corp. - Overview
                    • Danaher Corp. - Business segments
                    • Danaher Corp. - Key news
                    • Danaher Corp. - Key offerings
                    • Danaher Corp. - Segment focus
                  • 11.7 General Electric Co.
                    • General Electric Co. - Overview
                    • General Electric Co. - Business segments
                    • General Electric Co. - Key news
                    • General Electric Co. - Key offerings
                    • General Electric Co. - Segment focus
                  • 11.8 HORIBA Ltd.
                    • HORIBA Ltd. - Overview
                    • HORIBA Ltd. - Business segments
                    • HORIBA Ltd. - Key news
                    • HORIBA Ltd. - Key offerings
                    • HORIBA Ltd. - Segment focus
                  • 11.9 In Situ Inc.
                    • In Situ Inc. - Overview
                    • In Situ Inc. - Product / Service
                    • In Situ Inc. - Key offerings
                  • 11.10 Libelium Comunicaciones Distribuidas SL
                    • Libelium Comunicaciones Distribuidas SL - Overview
                    • Libelium Comunicaciones Distribuidas SL - Product / Service
                    • Libelium Comunicaciones Distribuidas SL - Key offerings
                  • 11.11 Thermo Fisher Scientific Inc.
                    • Thermo Fisher Scientific Inc. - Overview
                    • Thermo Fisher Scientific Inc. - Business segments
                    • Thermo Fisher Scientific Inc. - Key news
                    • Thermo Fisher Scientific Inc. - Key offerings
                    • Thermo Fisher Scientific Inc. - Segment focus
                  • 11.12 Xylem Inc.
                    • Xylem Inc. - Overview
                    • Xylem Inc. - Business segments
                    • Xylem Inc. - Key news
                    • Xylem Inc. - Key offerings
                    • Xylem Inc. - Segment focus

                  12 Appendix

                  • 12.1 Scope of the report
                    • 12.2 Inclusions and exclusions checklist
                      • Inclusions checklist
                      • Exclusions checklist
                    • 12.3 Currency conversion rates for US$
                      • Currency conversion rates for US$
                    • 12.4 Research methodology
                      • Research methodology
                    • 12.5 Data procurement
                      • Information sources
                    • 12.6 Data validation
                      • Data validation
                    • 12.7 Validation techniques employed for market sizing
                      • Validation techniques employed for market sizing
                    • 12.8 Data synthesis
                      • Data synthesis
                    • 12.9 360 degree market analysis
                      • 360 degree market analysis
                    • 12.10 List of abbreviations
                      • List of abbreviations

                    Research Methodology

                    Technavio presents a detailed picture of the market by way of study, synthesis, and summation of data from multiple sources. The analysts have presented the various facets of the market with a particular focus on identifying the key industry influencers. The data thus presented is comprehensive, reliable, and the result of extensive research, both primary and secondary.

                    INFORMATION SOURCES

                    Primary sources

                    • Manufacturers and suppliers
                    • Channel partners
                    • Industry experts
                    • Strategic decision makers

                    Secondary sources

                    • Industry journals and periodicals
                    • Government data
                    • Financial reports of key industry players
                    • Historical data
                    • Press releases

                    DATA ANALYSIS

                    Data Synthesis

                    • Collation of data
                    • Estimation of key figures
                    • Analysis of derived insights

                    Data Validation

                    • Triangulation with data models
                    • Reference against proprietary databases
                    • Corroboration with industry experts

                    REPORT WRITING

                    Qualitative

                    • Market drivers
                    • Market challenges
                    • Market trends
                    • Five forces analysis

                    Quantitative

                    • Market size and forecast
                    • Market segmentation
                    • Geographical insights
                    • Competitive landscape

                    Interested in this report?

                    Get your sample now to see our research methodology and insights!

                    Download Now

                    Frequently Asked Questions

                    Water Quality Monitoring Equipment market growth will increase by $ 979.3 mn during 2024-2028.

                    The Water Quality Monitoring Equipment market is expected to grow at a CAGR of 4.5% during 2024-2028.

                    Water Quality Monitoring Equipment market is segmented by Application( Groundwater, Drinking water, Wastewater, Aquaculture, Others)

                    Aeron Systems Pvt. Ltd., Agilent Technologies Inc., Atlas Scientific LLC, Campbell Scientific Inc., Danaher Corp., Environmental Holdings Pty Ltd., General Electric Co., Geotech Environmental Equipment Inc., Hanna Instruments Inc., HORIBA Ltd., Hydro International Ltd., In Situ Inc., Libelium Comunicaciones Distribuidas SL, Metex Corp. Ltd., National Institute of Water and Atmospheric Research Ltd., Optiqua Technologies Pte Ltd., RS Hydro Ltd., Sea Bird Scientific, Stevens Water Monitoring Systems Inc., Thermo Fisher Scientific Inc., Xylem Inc. are a few of the key vendors in the Water Quality Monitoring Equipment market.

                    APAC will register the highest growth rate of 38% among the other regions. Therefore, the Water Quality Monitoring Equipment market in APAC is expected to garner significant business opportunities for the vendors during the forecast period.

                    US, China, Germany, Japan, UK

                    • Increasing pollution adversely affecting quality of drinking waterChanges in climatic conditions can be attributed to increasing pollution and have led to more frequent droughts is the driving factor this market.
                    • storms is the driving factor this market.
                    • and floods. Often is the driving factor this market.
                    • the repair and retrofitting activities of utilities that are undertaken after such calamities are slow or delayed is the driving factor this market.
                    • for which utilities face severe backlash from the public. Utilities need to be prepared to cater to the demands of end-users in such situations. Therefore is the driving factor this market.
                    • more utilities are adopting water quality monitoring systems to prepare themselves for contingency plans in such situations so that they can take prompt action. For instance is the driving factor this market.
                    • in February 2017 is the driving factor this market.
                    • the Southern Nevada Water Authority (SNWA) in the US collaborated with the US EPA Creating Resilient Water Utilities program to assess the vulnerability of the Las Vegas service area due to the changes in climatic conditions predicted by 2035. This assessment helped the SNWA to identify potential actions that must be undertaken in response to the impact of climate change.Denver Water is the driving factor this market.
                    • a Colorado-based water utility is the driving factor this market.
                    • conducted a Joint Front Range Climate Change Vulnerability Study to research the effect of temperature and precipitation on the water supply system. Since the analysis of the data related to climatic changes is relatively new for water utilities is the driving factor this market.
                    • these utilities have collaborated with each other. For instance is the driving factor this market.
                    • the Water Utility Climate Alliance (founded in 2007) is a group of 12 water utilities in the US is the driving factor this market.
                    • which undertakes research and development (R and D) on the impact of climate change on drinking water. Its vision is to implement climate-resilient water utilities that would lead to thriving communities. Such initiatives have increased the need for efficient water quality sensors and associated systems and equipment is the driving factor this market.
                    • all of which can provide critical data on the pH level or other contaminants in the water is the driving factor this market.
                    • which can be analyzed using water quality monitoring systems that provide real-time data to utilities. Thus is the driving factor this market.
                    • the global water quality monitoring systems will witness growth during the forecast period. is the driving factor this market.

                    The Water Quality Monitoring Equipment market vendors should focus on grabbing business opportunities from the Groundwater segment as it accounted for the largest market share in the base year.