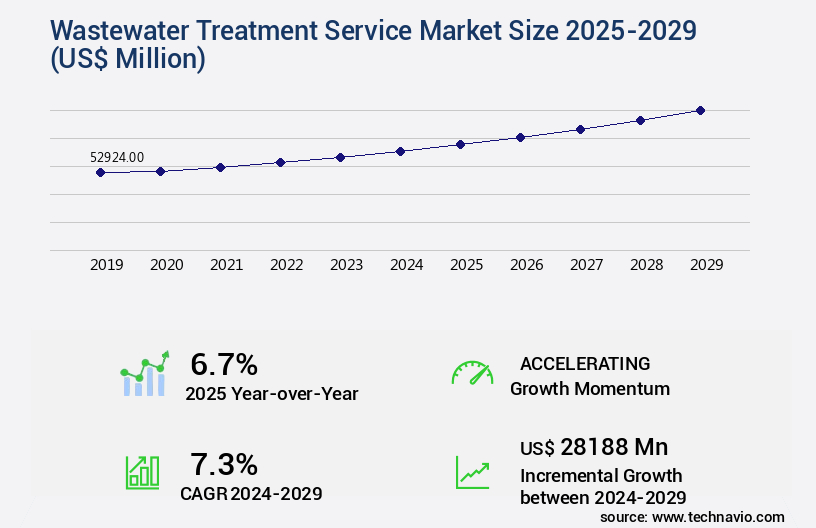
Wastewater Treatment Service Market Size 2025-2029
The wastewater treatment service market size is valued to increase USD 28.19 billion, at a CAGR of 7.3% from 2024 to 2029. Stringent environmental regulations will drive the wastewater treatment service market.
Major Market Trends & Insights
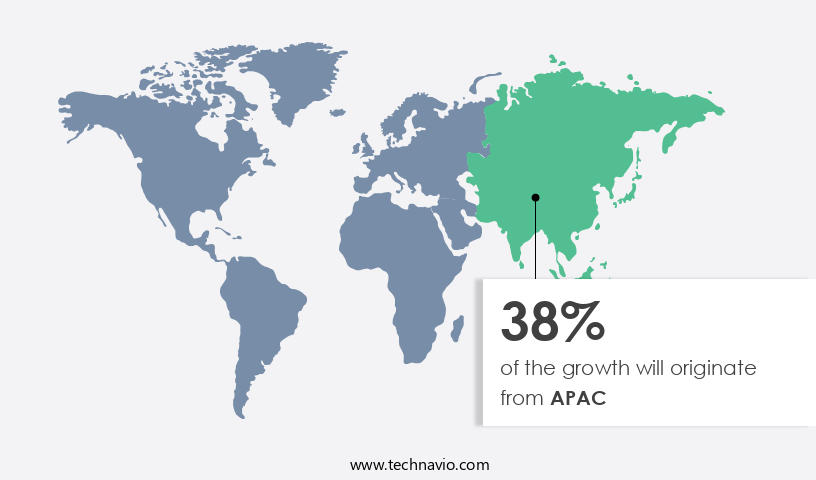
- APAC dominated the market and accounted for a 38% growth during the forecast period.
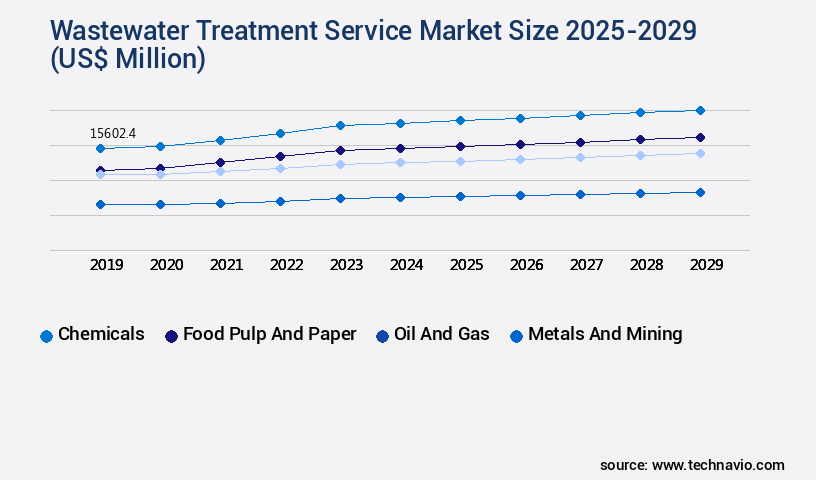
- By End-user - Chemicals segment was valued at USD 15.6 billion in 2023
- By Type - Design and engineering consultation segment accounted for the largest market revenue share in 2023
Market Size & Forecast
- Market Opportunities: USD 79.52 million
- Market Future Opportunities: USD 28.19 billion
- CAGR : 7.3%
- APAC: Largest market in 2023
Market Summary
- The market encompasses a continually evolving landscape shaped by stringent environmental regulations and advances in wastewater treatment technology. The market is driven by stringent environmental regulations, necessitating the effective smart water management and treatment of wastewater to meet increasingly rigorous standards. Core technologies, such as activated sludge and biological nutrient removal, dominate the market, accounting for over 60% of the global share. Service types, including design, construction, operation and maintenance, and consulting, cater to various applications, including municipal and industrial sectors. The high cost of wastewater treatment technologies poses a significant challenge, while opportunities lie in emerging markets and the integration of smart technologies.
- For instance, the adoption rate of membrane filtration technology is projected to grow at a steady pace due to its ability to produce high-quality effluent. Despite these dynamics, the market remains a critical component of global water resource management, ensuring the protection of public health and the environment.
What will be the Size of the Wastewater Treatment Service Market during the forecast period?
Get Key Insights on Market Forecast (PDF) Request Free Sample
How is the Wastewater Treatment Service Market Segmented and what are the key trends of market segmentation?
The wastewater treatment service industry research report provides comprehensive data (region-wise segment analysis), with forecasts and estimates in "USD million" for the period 2025-2029, as well as historical data from 2019-2023 for the following segments.
- End-user
- Chemicals
- Food pulp and paper
- Oil and gas
- Metals and mining
- Others
- Type
- Design and engineering consultation
- Building and installation services
- Operation and process control
- Maintenance services
- Technology
- Physical
- Biological
- Chemical
- Advanced
- Geography
- North America
- US
- Canada
- Europe
- France
- Germany
- UK
- APAC
- Australia
- China
- India
- Japan
- South Korea
- Rest of World (ROW)
- North America
By End-user Insights
The chemicals segment is estimated to witness significant growth during the forecast period.
The market is witnessing significant advancements, driven by the integration of automation in treatment processes and the adoption of innovative technologies. For instance, wastewater pretreatment techniques, such as grit removal systems, flow equalization basins, and screening systems, are increasingly being used to enhance the efficiency of primary treatment processes. Moreover, the market is witnessing a growing focus on advanced nutrient removal processes, including biological nutrient removal and anaerobic digestion. These techniques enable the effective removal of nitrogen and phosphorus from wastewater, ensuring compliance with stringent effluent discharge standards. Ozone disinfection technology and advanced oxidation processes are gaining popularity due to their ability to eliminate recalcitrant contaminants.
Membrane separation techniques, such as membrane filtration and reverse osmosis, are also being extensively used for tertiary treatment processes to achieve high-quality effluent. The industrial sector is a significant contributor to the market growth, with the demand for wastewater treatment services increasing due to the need for stricter compliance with environmental regulations. In the food and beverage industry, for example, wastewater characterization and the implementation of activated sludge processes and UV disinfection systems are crucial for ensuring water reuse and maintaining high-quality output. The market is also witnessing the adoption of emerging technologies, such as membrane bioreactor systems, ph control systems, and bioaugmentation strategies, to enhance the efficiency and sustainability of wastewater treatment processes.
These innovations are expected to drive future growth in the market. According to recent studies, the global wastewater treatment services market is projected to grow by 12.5% in the next two years.
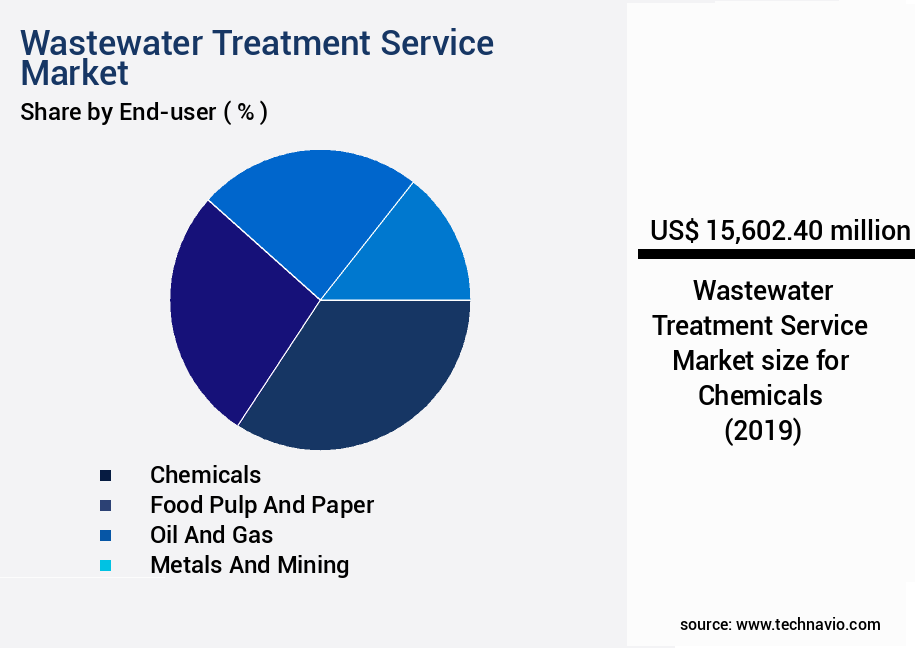
The Chemicals segment was valued at USD 15.6 billion in 2019 and showed a gradual increase during the forecast period.
Regional Analysis
APAC is estimated to contribute 38% to the growth of the global market during the forecast period.Technavio's analysts have elaborately explained the regional trends and drivers that shape the market during the forecast period.
See How Wastewater Treatment Service Market Demand is Rising in APAC Request Free Sample
In North America, the US and Canada are significant contributors to the market, driven by stringent water purification regulations and the presence of extensive industrial infrastructure in sectors like power generation, oil and gas, mining, chemical, and pulp and paper. The demand for sustainable water reuse practices to conserve the environment and ensure safe potable water, as mandated by regulations such as the Safe Drinking Water Act, will fuel market expansion. According to the latest data, approximately 30 billion gallons of wastewater are treated daily in the US alone, and this number is projected to increase due to the growing emphasis on water conservation and regulatory compliance.
Additionally, the adoption of advanced technologies like membrane filtration and activated carbon adsorption is expected to further boost market growth.
Market Dynamics
Our researchers analyzed the data with 2024 as the base year, along with the key drivers, trends, and challenges. A holistic analysis of drivers will help companies refine their marketing strategies to gain a competitive advantage.
The market encompasses a range of technologies and services aimed at addressing the growing demand for advanced and sustainable wastewater management solutions. Key areas of focus include the enhancement of treatment efficiency through processes such as membrane bioreactor operational costs and anaerobic digestion biogas production. These methods contribute significantly to nutrient removal using biological processes, ensuring compliance with discharge permits and promoting sustainable wastewater management. Wastewater treatment plant automation plays a crucial role in optimizing processes, with effluent quality monitoring techniques and improved sludge handling methods enabling energy-efficient wastewater treatment. Process control system design and hydraulic modeling software facilitate predictive maintenance program implementation and remote monitoring of wastewater parameters, further optimizing plant performance.
One notable trend in the market is the adoption of enhanced biological nutrient removal techniques, which have gained traction due to their ability to effectively address nutrient pollution. Reverse osmosis membrane fouling remains a challenge, necessitating ongoing research and innovation to improve membrane performance and reduce operational costs. Comparatively, optimizing the activated sludge process accounts for a substantial share of market investments, with more than 60% of wastewater treatment facilities relying on this method. This emphasis on process optimization reflects the growing recognition of the need for efficient and cost-effective wastewater treatment solutions. Biosolids utilization and disposal continue to be critical considerations, with an increasing focus on sustainable disposal methods and the potential for energy recovery from sludge.
Overall, the market is poised for growth, driven by stringent regulations, population growth, and the need for sustainable water management solutions.
What are the key market drivers leading to the rise in the adoption of Wastewater Treatment Service Industry?
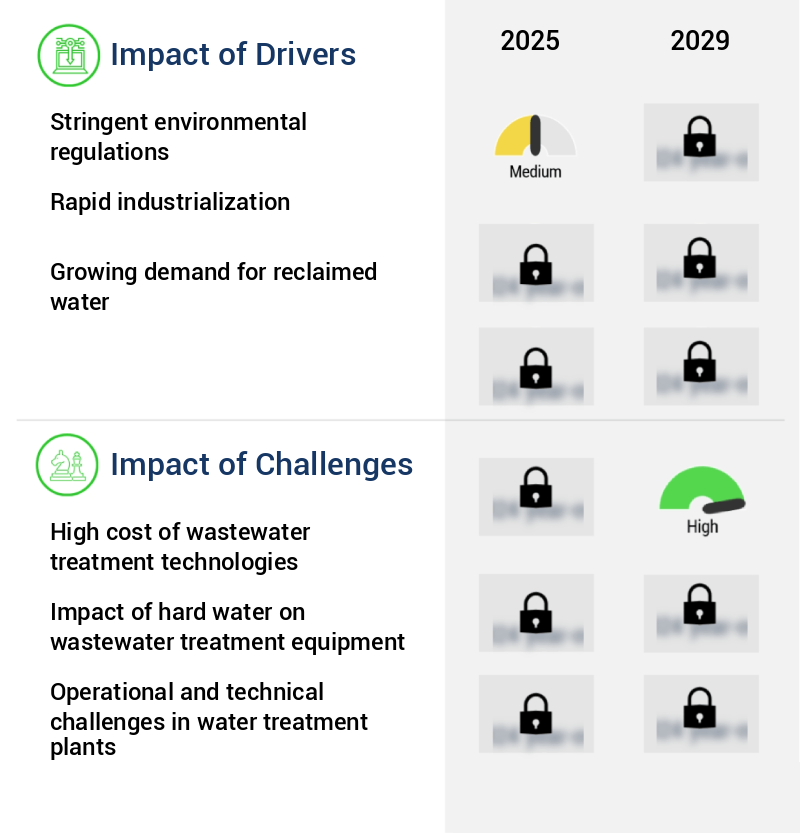
- Stringent environmental regulations serve as the primary driver for market growth in this industry.
- Climate change and population growth have amplified the disparity between water demand and availability. Industrial and economic activities can result in significant environmental consequences. In response, innovative technologies are being engineered to mitigate these negative impacts. Unchecked industrial expansion poses environmental risks. Consequently, governments worldwide are prioritizing the development of eco-friendly machinery and economies. To address environmental hazards from sectors like mining and power generation, various measures are being implemented. For instance, the US Environmental Protection Agency (EPA) has published a technical document titled "Guidelines for Water Reuse." This comprehensive document summarizes state requirements and guidelines for the treatment and utilization of recycled water.
- Incorporating industrial processes with water recycling and reuse can significantly reduce water consumption and environmental footprints. The integration of advanced technologies, such as membrane filtration and reverse osmosis, enables the treatment of wastewater for various applications, including industrial processes and agricultural irrigation. Moreover, the adoption of circular economy principles in industries can lead to substantial water savings and resource efficiency. By implementing closed-loop systems and minimizing waste, industries can contribute to a more sustainable future. In conclusion, the evolving landscape of water management is driven by the pressing need to balance water demand and supply while minimizing environmental impacts.
- The integration of advanced technologies and circular economy principles plays a crucial role in creating a sustainable future for industries and economies.
What are the market trends shaping the Wastewater Treatment Service Industry?
- Advancements in wastewater treatment technology represent the current market trend. The application of innovative technologies in wastewater treatment is gaining significant traction in the industry.
- Membrane technologies have gained prominence in the fields of wastewater treatment and energy sustainability. Industrial wastewater treatment utilizes various membrane technologies, including membrane bioreactors (MBR) and reverse osmosis (RO) for desalination. These technologies offer advantages such as adaptability, ease of use, minimal environmental impact, efficient land usage, and flexibility. Membrane technology innovations have led to significant advancements. Desalination, removal or recovery of rare earth elements (REEs) and heavy metals from saline wastewater, industrial wastewater reclamation and reuse, and microfiltration, ultrafiltration, nano-filtration, reverse osmosis, forward osmosis, and membrane distillation are some of the notable improvements. The water treatment industry continues to evolve, focusing on making processes more efficient and addressing the challenges of industrial water treatment.
- Membrane technologies, with their versatility and sustainability, are at the forefront of these advancements. Companies and industries are increasingly adopting these technologies to meet their water treatment needs while minimizing their environmental footprint. Membrane technology applications extend beyond wastewater treatment, with energy sustainability being a significant area of focus. Membrane-based fuel cells, for instance, offer potential solutions for generating clean energy. As the market continues to evolve, membrane technologies will continue to play a crucial role in addressing water and energy sustainability challenges.
What challenges does the Wastewater Treatment Service Industry face during its growth?
- The high cost of implementing wastewater treatment technologies poses a significant challenge to the industry's growth trajectory.
- Wastewater treatment is a critical yet complex process that incurs significant operational costs, accounting for up to 50% of the total annual expenses. The operation costs encompass maintenance, personnel, energy consumption, and disposal fees. According to industry data, the average cost for treating wastewater ranges from USD500,000 to USD1.5 million annually for a 150,000 Gallons Per Day (GPD) capacity. This financial barrier poses a challenge for low-income companies in developing countries, such as India, hindering the market expansion during the forecast period.
- Despite the high costs, the wastewater treatment industry continues to evolve, with advancements in technologies and processes aimed at improving efficiency and reducing costs. This dynamic market landscape underscores the importance of ongoing innovation and cost optimization strategies for stakeholders.
Exclusive Customer Landscape
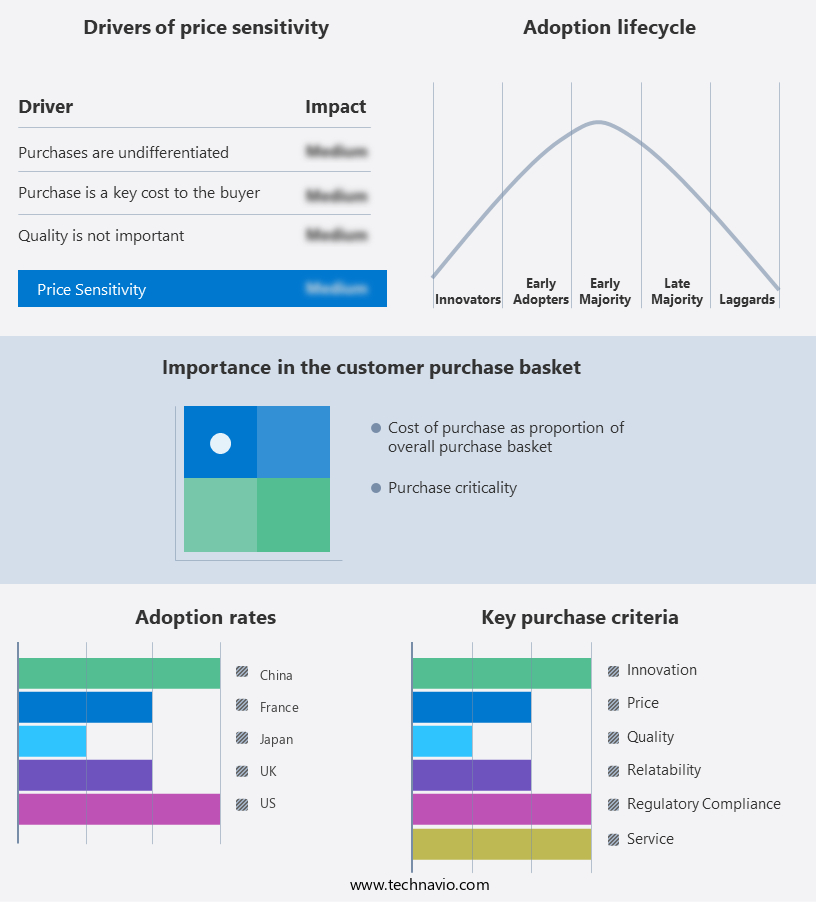
The wastewater treatment service market forecasting report includes the adoption lifecycle of the market, covering from the innovator's stage to the laggard's stage. It focuses on adoption rates in different regions based on penetration. Furthermore, the wastewater treatment service market report also includes key purchase criteria and drivers of price sensitivity to help companies evaluate and develop their market growth analysis strategies.
Customer Landscape of Wastewater Treatment Service Industry
Competitive Landscape & Market Insights
Companies are implementing various strategies, such as strategic alliances, wastewater treatment service market forecast, partnerships, mergers and acquisitions, geographical expansion, and product/service launches, to enhance their presence in the industry.
Apex Co. LLC. - The company specializes in wastewater treatment, employing advanced technologies such as Dissolved Air Flotation Clarifiers, Inclined Plate Clarifiers, and Gravity Clarifiers to effectively remove impurities and enhance water clarity. These clarification methods optimize treatment processes, ensuring regulatory compliance and environmental sustainability.
The industry research and growth report includes detailed analyses of the competitive landscape of the market and information about key companies, including:
- Apex Co. LLC.
- Aries Chemical Inc.
- Cortec Corp.
- Eckstine Electric Co.
- Ecolab Inc.
- Evoqua Water Technologies LLC
- Feralco AB
- Hydrite Chemical Co.
- Italmatch Chemicals Spa
- Rockwell Automation Inc.
- Skanska AB
- Solenis
- SUEZ SA
- The York Water Co.
- Thermax Ltd.
- Veolia Environnement SA
- VA Tech Wabag Ltd.
- WOG Group
- WSP Global Inc.
- Xylem Inc.
Qualitative and quantitative analysis of companies has been conducted to help clients understand the wider business environment as well as the strengths and weaknesses of key industry players. Data is qualitatively analyzed to categorize companies as pure play, category-focused, industry-focused, and diversified; it is quantitatively analyzed to categorize companies as dominant, leading, strong, tentative, and weak.
Recent Development and News in Wastewater Treatment Service Market
- In January 2024, Veolia Water Technologies, a global leader in water and wastewater solutions, announced the launch of its new Membrane Bioreactor (MBR) plant in Singapore. This state-of-the-art facility, which cost approximately €100 million, is designed to treat 150,000 m³/day of wastewater, significantly increasing the company's capacity in the region (Veolia Water Technologies Press Release, 2024).
- In March 2024, Siemens Water Technologies and Suez signed a strategic partnership agreement to jointly develop and market advanced wastewater treatment technologies. This collaboration aims to combine Siemens' expertise in automation and digitalization with Suez's experience in water treatment, offering integrated solutions to customers worldwide (Siemens AG Press Release, 2024).
- In May 2024, the European Union approved the European Green Deal, a €1 trillion investment plan to make Europe carbon neutral by 2050. A significant portion of this funding will be allocated to water and wastewater infrastructure, including the modernization and expansion of existing treatment plants (European Commission Press Release, 2020).
- In April 2025, GE Water & Process Technologies unveiled its new ZeeWeed Dynaflo DF2000 membrane filtration system, which can treat up to 2,000 m³/day of wastewater. This innovation marks a significant leap forward in membrane filtration technology, offering increased capacity and energy efficiency (GE Water & Process Technologies Press Release, 2025).
Dive into Technavio's robust research methodology, blending expert interviews, extensive data synthesis, and validated models for unparalleled Wastewater Treatment Service Market insights. See full methodology.
|
Market Scope |
|
|
Report Coverage |
Details |
|
Page number |
234 |
|
Base year |
2024 |
|
Historic period |
2019-2023 |
|
Forecast period |
2025-2029 |
|
Growth momentum & CAGR |
Accelerate at a CAGR of 7.3% |
|
Market growth 2025-2029 |
USD 28188 million |
|
Market structure |
Fragmented |
|
YoY growth 2024-2025(%) |
6.7 |
|
Key countries |
US, China, Canada, France, Japan, India, South Korea, UK, Germany, and Australia |
|
Competitive landscape |
Leading Companies, Market Positioning of Companies, Competitive Strategies, and Industry Risks |
Research Analyst Overview
- In the dynamic and evolving landscape of wastewater treatment services, automation plays a pivotal role in enhancing efficiency and optimizing processes. Wastewater pretreatment, a critical stage in the treatment process, employs various technologies such as grit removal systems and flow equalization basins to ensure effective removal of solids and maintain consistent flow rates. Biological nutrient removal, an essential aspect of wastewater treatment, is achieved through processes like anaerobic digestion and biological oxidation. Ozone disinfection technology and advanced oxidation processes are employed for disinfection and organic matter reduction. Dissolved oxygen control and chemical oxidation are integral parts of the biological treatment process.
- Industrial wastewater treatment and municipal wastewater treatment share several similarities but also exhibit distinct differences. Industrial wastewater often requires more stringent effluent discharge standards due to its higher contaminant levels. Membrane separation, ph control systems, and tertiary treatment processes are commonly used for industrial wastewater treatment to ensure compliance with these standards. Municipal wastewater treatment, on the other hand, focuses on water quality parameters such as turbidity, color, and odor. Screening systems, wastewater aeration systems, and filtration techniques are employed to address these issues. Nutrient removal processes like reverse osmosis treatment and sludge dewatering methods are also crucial for municipal wastewater treatment.
- The wastewater treatment market is marked by continuous innovation, with emerging technologies like UV disinfection systems, membrane bioreactor systems, and bioaugmentation strategies gaining popularity for their ability to enhance treatment efficiency and reduce operational costs. Wastewater characterization and activated sludge process remain foundational techniques, while chemical coagulation flocculation and sludge thickening methods continue to be essential components of the treatment process. In conclusion, the wastewater treatment market is a vibrant and evolving sector, with ongoing advancements in automation, biological nutrient removal, disinfection technologies, and sludge handling systems. The integration of these technologies and processes is crucial for ensuring effective and sustainable wastewater treatment, addressing the diverse needs of industrial and municipal applications.
What are the Key Data Covered in this Wastewater Treatment Service Market Research and Growth Report?
-
What is the expected growth of the Wastewater Treatment Service Market between 2025 and 2029?
-
USD 28.19 billion, at a CAGR of 7.3%
-
-
What segmentation does the market report cover?
-
The report is segmented by End-user (Chemicals, Food pulp and paper, Oil and gas, Metals and mining, and Others), Type (Design and engineering consultation, Building and installation services, Operation and process control, and Maintenance services), Technology (Physical, Biological, Chemical, and Advanced), and Geography (North America, APAC, Europe, Middle East and Africa, and South America)
-
-
Which regions are analyzed in the report?
-
North America, APAC, Europe, Middle East and Africa, and South America
-
-
What are the key growth drivers and market challenges?
-
Stringent environmental regulations, High cost of wastewater treatment technologies
-
-
Who are the major players in the Wastewater Treatment Service Market?
-
Apex Co. LLC., Aries Chemical Inc., Cortec Corp., Eckstine Electric Co., Ecolab Inc., Evoqua Water Technologies LLC, Feralco AB, Hydrite Chemical Co., Italmatch Chemicals Spa, Rockwell Automation Inc., Skanska AB, Solenis, SUEZ SA, The York Water Co., Thermax Ltd., Veolia Environnement SA, VA Tech Wabag Ltd., WOG Group, WSP Global Inc., and Xylem Inc.
-
Market Research Insights
- The market encompasses a range of technologies and services aimed at addressing the complexities of water resource management. Two significant aspects of this market are energy recovery methods and remote monitoring. Energy recovery, through techniques such as anaerobic digestion and microturbines, can help reduce operational expenditure by generating renewable energy from wastewater. In contrast, remote monitoring systems enable real-time data analytics and process optimization, reducing capital expenditure on labor and maintenance. For instance, the implementation of energy recovery methods can lead to a 30% reduction in energy consumption, while remote monitoring systems can decrease operational costs by up to 20%.
- These advancements contribute to the market's continuous evolution, with a growing emphasis on sustainability metrics, nitrogen and phosphorus removal, and compliance with environmental regulations. Additionally, SCADA systems, process simulation, hydraulic modeling, permitting requirements, and asset management are integral components of the market. Other essential elements include treatment plant design, instrumentation and control, chemical oxygen demand (COD) and biochemical oxygen demand (BOD) reduction, compliance monitoring, and water reuse strategies. Total suspended solids (TSS), total dissolved solids (TDS), and lifecycle cost analysis are also crucial factors in the market's development. Biosolids management is another essential aspect, with water reuse strategies gaining increasing importance due to the growing scarcity of water resources.
We can help! Our analysts can customize this wastewater treatment service market research report to meet your requirements.
 RIA -
RIA - 
