Food Pathogen Testing Market Analysis, Size, and Forecast 2026-2030: North America (US, Canada, and Mexico), Europe (Germany, UK, and France), APAC (China, India, and Japan), South America (Brazil, Argentina, and Colombia), Middle East and Africa (Saudi Arabia, UAE, and South Africa), Asia, Rest of World (ROW)

Food Pathogen Testing Market Analysis, Size, and Forecast 2026-2030:
North America (US, Canada, and Mexico), Europe (Germany, UK, and France), APAC (China, India, and Japan), South America (Brazil, Argentina, and Colombia), Middle East and Africa (Saudi Arabia, UAE, and South Africa), Asia, Rest of World (ROW)

Published: Apr 2026 307 Pages SKU: IRTNTR74647

Market Overview at a Glance

$2.39 B
Market Opportunity
4.8%
CAGR 2025 - 2030
29.3%
Asia Growth
$2.42 B
Meat and poultry segment 2024

Food Pathogen Testing Market Size 2026-2030

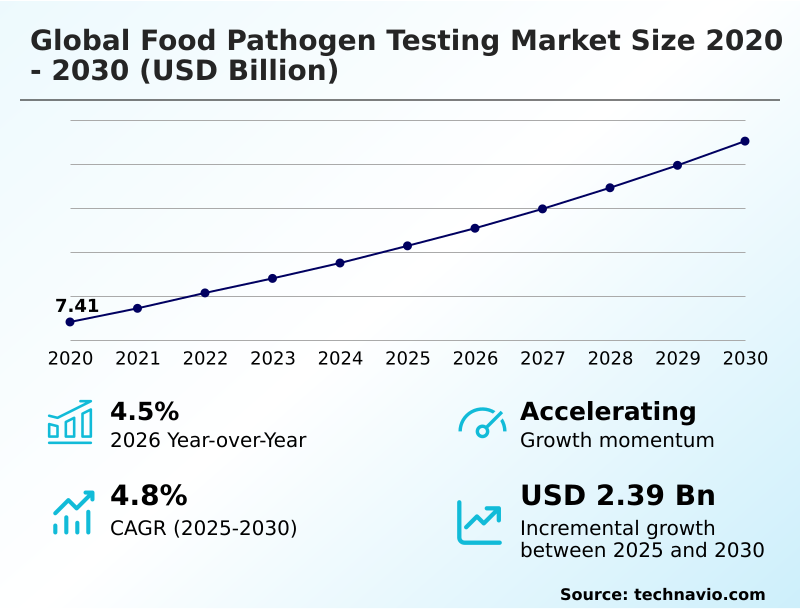
The food pathogen testing market size is valued to increase by USD 2.39 billion, at a CAGR of 4.8% from 2025 to 2030. Stringent regulatory frameworks and international compliance standards will drive the food pathogen testing market.

Major Market Trends & Insights

  • Asia dominated the market and accounted for a 29.3% growth during the forecast period.
  • By Application - Meat and poultry segment was valued at USD 2.42 billion in 2024
  • By Method - Conventional methods segment accounted for the largest market revenue share in 2024

Market Size & Forecast

  • Market Opportunities: USD 4.12 billion
  • Market Future Opportunities: USD 2.39 billion
  • CAGR from 2025 to 2030 : 4.8%

Market Summary

  • The food pathogen testing market is undergoing a structural modernization, moving beyond traditional laboratory methods toward automated, high-throughput screening systems. This evolution is driven by increasingly stringent food safety regulations and the complexities of international supply chains, which demand rapid and accurate verification to prevent foodborne illness outbreaks.
  • Technologies such as polymerase chain reaction, next-generation sequencing, and biosensors are becoming standard for identifying contaminants like Salmonella, Listeria, and E. coli with greater speed and precision. A key business scenario involves a large-scale dairy processor implementing an on-site rapid testing program for its raw milk supply.
  • By using portable immunoassay kits, the company can screen incoming tankers in under an hour, a process that previously took 48 hours with culture-based methods. This allows for the immediate rejection of contaminated batches, preventing them from entering the production line, thereby safeguarding brand integrity, ensuring regulatory compliance, and drastically reducing the financial risk associated with a potential product recall.
  • The industry is also seeing a shift toward predictive analytics, using data from environmental monitoring and historical tests to forecast contamination risks before they occur, optimizing safety protocols and resource allocation.

What will be the Size of the Food Pathogen Testing Market during the forecast period?

Get Key Insights on Market Forecast (PDF) Request Free Sample

How is the Food Pathogen Testing Market Segmented?

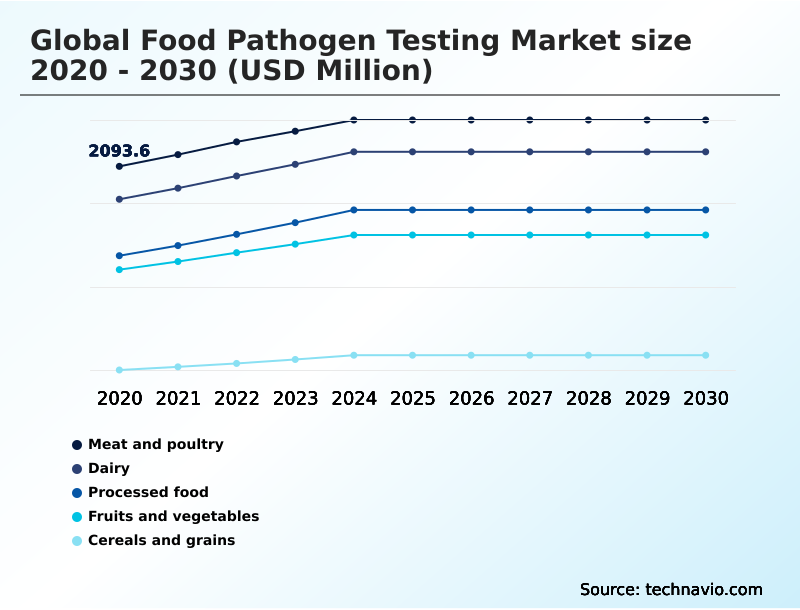
The food pathogen testing industry research report provides comprehensive data (region-wise segment analysis), with forecasts and estimates in "USD million" for the period 2026-2030, as well as historical data from 2020-2024 for the following segments.

  • Application
    • Meat and poultry
    • Dairy
    • Processed food
    • Fruits and vegetables
    • Cereals and grains
  • Method
    • Conventional methods
    • Rapid methods
  • Type
    • Salmonella
    • E coli
    • Listeria
    • Campylobacter
    • Others
  • Geography
    • North America
      • US
      • Canada
      • Mexico
    • Europe
      • Germany
      • UK
      • France
    • Asia
    • Rest of World (ROW)

By Application Insights

The meat and poultry segment is estimated to witness significant growth during the forecast period.

The meat and poultry segment commands a primary focus for rigorous pathogen surveillance due to the high intrinsic risk of contamination.

Processors are increasingly integrating a rapid diagnostic test to accelerate verification, supported by automated sample preparation to handle high volumes. A comprehensive food safety audit is now standard, governed by a strict validation protocol to ensure methods are effective.

Data management through laboratory information management systems (LIMS) is crucial for traceability. Demand for third-party laboratory services is rising as companies outsource complex testing to meet microbial limit testing standards.

Adopting on-site testing solutions enables a faster corrective action plan, with some facilities reducing recall-related losses by over 20% through quicker interventions.

Request Free Sample

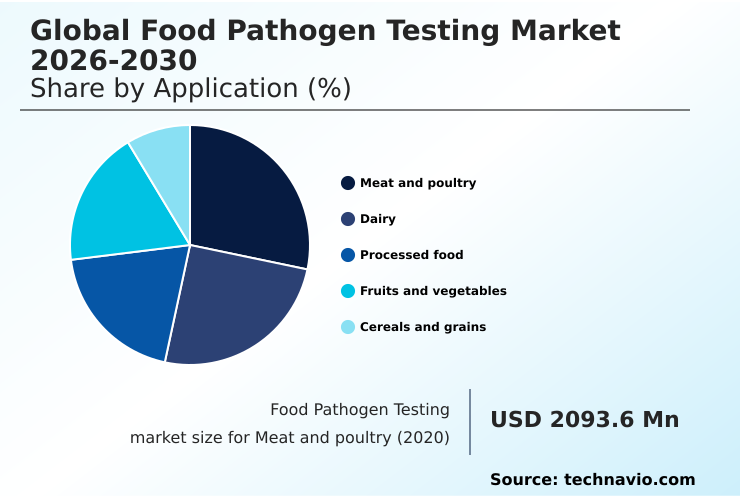
The Meat and poultry segment was valued at USD 2.42 billion in 2024 and showed a gradual increase during the forecast period.

Request Free Sample

Regional Analysis

Asia is estimated to contribute 29.3% to the growth of the global market during the forecast period.Technavio’s analysts have elaborately explained the regional trends and drivers that shape the market during the forecast period.

See How Food Pathogen Testing Market Demand is Rising in Asia Request Free Sample

Regional market dynamics are shaped by varying regulatory landscapes and supply chain complexities. In mature markets, a focus on good laboratory practices (glp) and integrated hazard analysis critical control point (haccp) systems is standard.

Technology adoption emphasizes real-time traceability and comprehensive quality assurance testing. The process often starts with an environmental monitoring swab followed by sample enrichment in a selective enrichment broth.

Advanced analysis involving dna sequencing identifies pathogens based on unique antigen-antibody reactions for precise bacterial strain typing. Automated systems for tasks like automated colony counting improve laboratory efficiency, increasing sample throughput by as much as 35% compared to manual methods.

Market Dynamics

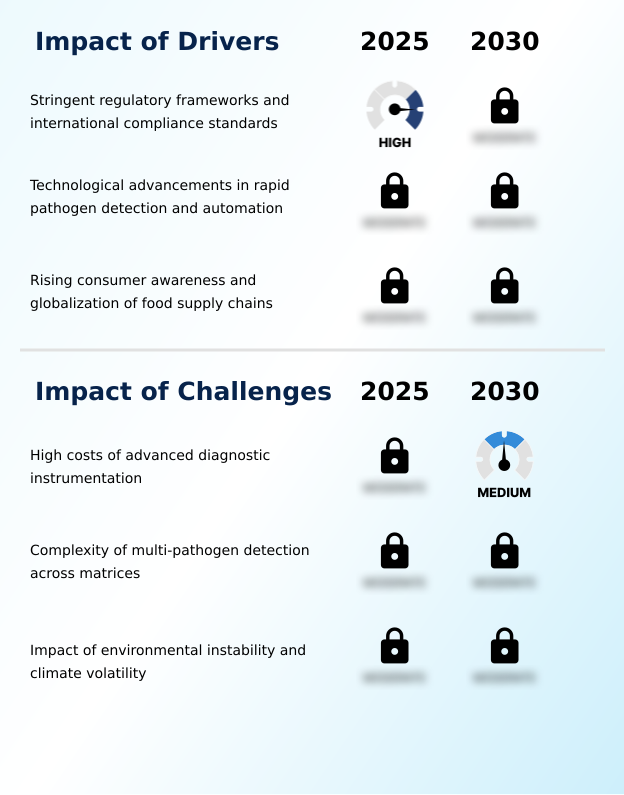
Our researchers analyzed the data with 2025 as the base year, along with the key drivers, trends, and challenges. A holistic analysis of drivers will help companies refine their marketing strategies to gain a competitive advantage.

  • The global food pathogen testing market 2026-2030 is increasingly shaped by the demand for specialized and rapid methods for salmonella testing and other critical contaminants. Technologies like real-time pcr for microbial identification and pcr technology for e. coli detection have become indispensable for ensuring food safety compliance for processed food.
  • While conventional methods for pathogen isolation remain a benchmark, the industry is moving towards advanced molecular diagnostics in food industry applications, particularly for listeria testing in dairy products and campylobacter detection in raw poultry. The effectiveness of these methods depends heavily on overcoming the challenges of multi-pathogen detection and food matrix interference.
  • For example, the use of biosensor applications in food testing and immunoassay techniques in food safety are gaining traction for e. coli screening in fresh produce. The cost of advanced diagnostic instrumentation remains a significant consideration for many operators.
  • However, the operational efficiencies gained from automated food pathogen screening systems and integrated lims for food testing laboratories often justify the investment. Effective environmental monitoring in food facilities and the validation of rapid testing methods are crucial components of a modern safety program.
  • Strategic deployment of next generation sequencing for source tracking during outbreaks is becoming more common, with whole genome sequencing for outbreaks providing unparalleled forensic detail. This focus on technology is evident across all food pathogen testing market applications, from food safety testing for meat and poultry to pathogen screening for fresh produce and pathogen detection in cereals and grains.
  • Companies adopting such advanced systems have reported more than a 25% improvement in their ability to pinpoint contamination sources swiftly.

What are the key market drivers leading to the rise in the adoption of Food Pathogen Testing Industry?

  • Stringent regulatory frameworks and international compliance standards are key drivers for the market.

  • Intensifying regulatory oversight propels market expansion, mandating robust pathogen surveillance program frameworks based on risk-based preventative models. This drives adoption of technologies enabling high-throughput screening, including enzyme-linked immunosorbent assay (ELISA) systems for routine pathogen screening.
  • The evolution of biosensor technology and advanced chromogenic media enhances detection capabilities. Moreover, the demand for accelerated results has cemented the role of real-time PCR in modern laboratories.
  • This is complemented by a move toward decentralized diagnostics with point-of-care testing, which allows for quicker decision-making at production sites, improving response times to potential contamination events by over 40% and supporting an integrated approach to food safety.

What are the market trends shaping the Food Pathogen Testing Industry?

  • The integration of predictive artificial intelligence and real-time risk analytics is an emerging market trend, signaling a shift toward proactive threat identification.

  • The industry is pivoting from reactive sampling to proactive, intelligence-driven prevention for foodborne pathogen detection. This shift toward rapid microbiological methods is essential for maintaining food safety compliance and robust microbial contamination control. The adoption of advanced technologies like polymerase chain reaction and next-generation sequencing is transforming diagnostics.
  • Real-time tools such as loop-mediated isothermal amplification and immunoassay techniques are outperforming traditional microbiological culture, with some advanced systems improving detection accuracy by up to 15%. This focus on speed and precision is critical for securing the modern food supply chain security, where turnaround times have been cut by more than 50% in certain applications.

What challenges does the Food Pathogen Testing Industry face during its growth?

  • The high cost of advanced diagnostic instrumentation presents a key challenge affecting industry growth.

  • A primary market challenge is the technical complexity of achieving accurate microbial identification and implementing advanced molecular diagnostics. The high capital cost and operational expertise needed for quantitative pcr (qpcr) and whole genome sequencing technologies create significant barriers for smaller enterprises. Furthermore, effective food matrix analysis remains difficult, as compositional variations in food products cause significant food matrix interference.
  • Implementing comprehensive food safety management systems that integrate predictive risk analytics for spoilage investigation is resource-intensive. Perfecting aseptic sampling technique is critical, as errors can lead to false negatives, with analysis showing sample contamination issues account for up to 10% of testing inaccuracies.

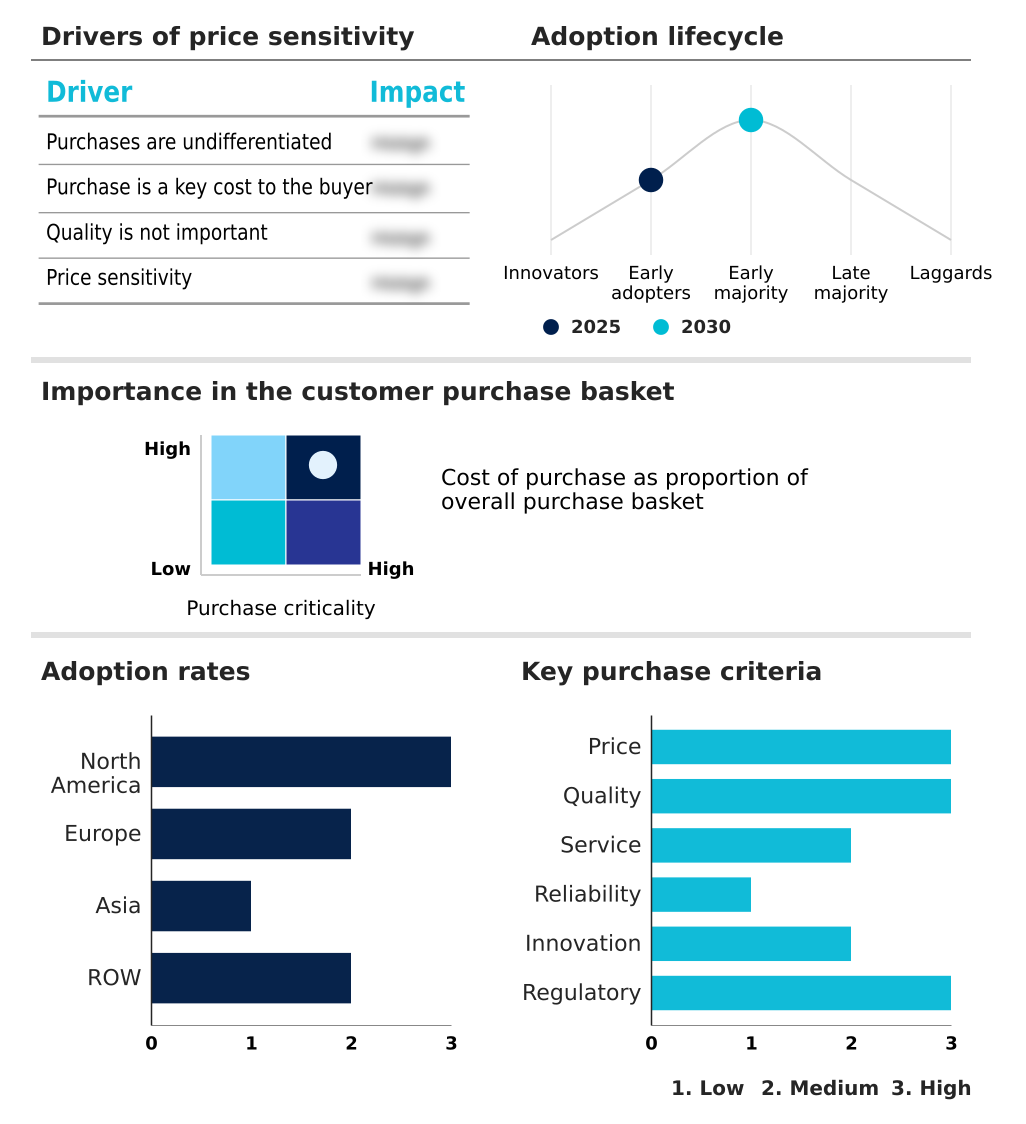
Exclusive Technavio Analysis on Customer Landscape

The food pathogen testing market forecasting report includes the adoption lifecycle of the market, covering from the innovator’s stage to the laggard’s stage. It focuses on adoption rates in different regions based on penetration. Furthermore, the food pathogen testing market report also includes key purchase criteria and drivers of price sensitivity to help companies evaluate and develop their market growth analysis strategies.

Customer Landscape of Food Pathogen Testing Industry

Competitive Landscape

Companies are implementing various strategies, such as strategic alliances, food pathogen testing market forecast, partnerships, mergers and acquisitions, geographical expansion, and product/service launches, to enhance their presence in the industry.

ALS Ltd. - Delivers advanced diagnostic systems, including rapid PCR and VIDAS platforms, for the precise detection of foodborne pathogens, ensuring food safety and compliance.

The industry research and growth report includes detailed analyses of the competitive landscape of the market and information about key companies, including:

  • ALS Ltd.
  • AsureQuality Ltd.
  • BioMerieux SA
  • Caribbean Genetics
  • Creative Diagnostics
  • Daane Labs LLC
  • Eurofins Scientific SE
  • Intertek Group Plc
  • LabGen
  • Merck KGaA
  • Merieux NutriSciences Corp.
  • Microbac Laboratories Inc.
  • Neogen Corp.
  • PerkinElmer US LLC
  • Romer Labs Division Holding GmbH
  • SGS SA
  • Symbio Laboratories
  • Thermo Fisher Scientific Inc.
  • TUV SUD AG

Qualitative and quantitative analysis of companies has been conducted to help clients understand the wider business environment as well as the strengths and weaknesses of key industry players. Data is qualitatively analyzed to categorize companies as pure play, category-focused, industry-focused, and diversified; it is quantitatively analyzed to categorize companies as dominant, leading, strong, tentative, and weak.

Recent Development and News in Food pathogen testing market

  • In September 2024, Eurofins Scientific SE expanded its North American presence by opening a new high-throughput food pathogen testing laboratory in Canada, enhancing its capacity for rapid molecular diagnostics.
  • In February 2025, bioMerieux SA introduced the GENE-UP TYPER solution, a next-generation molecular testing platform designed to provide rapid and precise identification of various pathogen strains.
  • In March 2025, Bio-Rad Laboratories Inc. launched its XP-Design Assay Salmonella Serotyping Solution, a real-time PCR technology designed for rapid serotype identification in food and environmental samples.
  • In April 2025, Thermo Fisher Scientific Inc. announced it received AOAC INTERNATIONAL Performance Tested Methods certification for its SureTect PCR System for detecting Listeria species in a wider range of food matrices.

Dive into Technavio’s robust research methodology, blending expert interviews, extensive data synthesis, and validated models for unparalleled Food Pathogen Testing Market insights. See full methodology.

Market Scope
Page number 307
Base year 2025
Historic period 2020-2024
Forecast period 2026-2030
Growth momentum & CAGR Accelerate at a CAGR of 4.8%
Market growth 2026-2030 USD 2388.9 million
Market structure Fragmented
YoY growth 2025-2026(%) 4.5%
Key countries US, Canada, Mexico, Germany, UK, France, Italy, Spain, The Netherlands, China, India, Japan, South Korea, Indonesia, Thailand, Brazil, Saudi Arabia, Argentina, UAE, South Africa, Colombia, Turkey and Israel
Competitive landscape Leading Companies, Market Positioning of Companies, Competitive Strategies, and Industry Risks

Request Free Sample

Research Analyst Overview

  • The food pathogen testing market is defined by a critical pivot toward high-precision diagnostics and data-driven safety protocols. The integration of advanced technologies like polymerase chain reaction, next-generation sequencing, and loop-mediated isothermal amplification is now central to operational strategies. A modern laboratory's workflow includes everything from traditional microbiological culture and immunoassay to advanced real-time PCR and quantitative pcr (qpcr).
  • The goal is rapid pathogen screening and precise microbial identification. This trend directly influences boardroom decisions on capital expenditure, as the adoption of whole genome sequencing for forensic-level bacterial strain typing and automated sample preparation systems becomes a competitive necessity.
  • For instance, companies that have integrated a rapid diagnostic test into their validation protocol have reported a 30% reduction in product hold times. This shift is reinforced by the need for meticulous food matrix analysis, efficient environmental monitoring swab techniques using selective enrichment broth, and the use of biosensor technology and superior chromogenic media.
  • Furthermore, systems based on dna sequencing and antigen-antibody reactions, managed via a central laboratory information management systems (LIMS), are essential for a comprehensive food safety audit.

What are the Key Data Covered in this Food Pathogen Testing Market Research and Growth Report?

  • What is the expected growth of the Food Pathogen Testing Market between 2026 and 2030?

    • USD 2.39 billion, at a CAGR of 4.8%

  • What segmentation does the market report cover?

    • The report is segmented by Application (Meat and poultry, Dairy, Processed food, Fruits and vegetables, and Cereals and grains), Method (Conventional methods, and Rapid methods), Type (Salmonella, E coli, Listeria, Campylobacter, and Others) and Geography (North America, Europe, Asia, Rest of World (ROW))

  • Which regions are analyzed in the report?

    • North America, Europe, Asia and Rest of World (ROW)

  • What are the key growth drivers and market challenges?

    • Stringent regulatory frameworks and international compliance standards, High costs of advanced diagnostic instrumentation

  • Who are the major players in the Food Pathogen Testing Market?

    • ALS Ltd., AsureQuality Ltd., BioMerieux SA, Caribbean Genetics, Creative Diagnostics, Daane Labs LLC, Eurofins Scientific SE, Intertek Group Plc, LabGen, Merck KGaA, Merieux NutriSciences Corp., Microbac Laboratories Inc., Neogen Corp., PerkinElmer US LLC, Romer Labs Division Holding GmbH, SGS SA, Symbio Laboratories, Thermo Fisher Scientific Inc. and TUV SUD AG

Market Research Insights

  • The market is shaped by a strategic focus on food safety management systems and food safety compliance. Stakeholders are implementing risk-based preventative models and robust pathogen surveillance program initiatives to enhance food supply chain security. The adoption of rapid microbiological methods enables high-throughput screening and effective microbial contamination control, with some systems reducing analysis time by over 60%.
  • This includes multi-pathogen screening and point-of-care testing solutions, which are becoming integral to modern quality assurance testing. To ensure accuracy, mastering aseptic sampling technique is critical to avoid issues like food matrix interference. Advanced platforms integrate predictive risk analytics for proactive spoilage investigation and support real-time traceability.
  • These systems, validated by third-party laboratory services, help meet microbial limit testing requirements and inform any necessary corrective action plan, with automated platforms increasing sample processing capacity by up to 40%. Good laboratory practices (GLP), automated colony counting, and adherence to hazard analysis critical control point (HACCP) standards are fundamental, along with the availability of on-site testing solutions.

We can help! Our analysts can customize this food pathogen testing market research report to meet your requirements.

Get in touch

1. Executive Summary

1.1 Market overview

Executive Summary - Chart on Market Overview
Executive Summary - Data Table on Market Overview
Executive Summary - Chart on Global Market Characteristics
Executive Summary - Chart on Market by Geography
Executive Summary - Chart on Market Segmentation by Application
Executive Summary - Chart on Market Segmentation by Method
Executive Summary - Chart on Market Segmentation by Type
Executive Summary - Chart on Incremental Growth
Executive Summary - Data Table on Incremental Growth
Executive Summary - Chart on Company Market Positioning

2. Technavio Analysis

2.1 Analysis of price sensitivity, lifecycle, customer purchase basket, adoption rates, and purchase criteria

2.2 Criticality of inputs and Factors of differentiation

Chart on Overview on criticality of inputs and factors of differentiation

2.3 Factors of disruption

Chart on Overview on factors of disruption

2.4 Impact of drivers and challenges

Chart on Impact of drivers and challenges in 2025 and 2030

3. Market Landscape

3.1 Market ecosystem

Chart on Parent Market
Data Table on - Parent Market

3.2 Market characteristics

Chart on Market characteristics analysis

3.3 Value chain analysis

Chart on Value chain analysis

4. Market Sizing

4.1 Market definition

Data Table on Offerings of companies included in the market definition

4.2 Market segment analysis

Market segments

4.3 Market size 2025

4.4 Market outlook: Forecast for 2025-2030

Chart on Global - Market size and forecast 2025-2030 ($ million)
Data Table on Global - Market size and forecast 2025-2030 ($ million)
Chart on Global Market: Year-over-year growth 2025-2030 (%)
Data Table on Global Market: Year-over-year growth 2025-2030 (%)

5. Historic Market Size

5.1 Global Food Pathogen Testing Market 2020 - 2024

Historic Market Size - Data Table on Global Food Pathogen Testing Market 2020 - 2024 ($ million)

5.2 Application segment analysis 2020 - 2024

Historic Market Size - Application Segment 2020 - 2024 ($ million)

5.3 Method segment analysis 2020 - 2024

Historic Market Size - Method Segment 2020 - 2024 ($ million)

5.4 Type segment analysis 2020 - 2024

Historic Market Size - Type Segment 2020 - 2024 ($ million)

5.5 Geography segment analysis 2020 - 2024

Historic Market Size - Geography Segment 2020 - 2024 ($ million)

5.6 Country segment analysis 2020 - 2024

Historic Market Size - Country Segment 2020 - 2024 ($ million)

6. Qualitative Analysis

6.1 Impact of AI in global food pathogen testing market

6.2 Impact of geopolitical conflict for global food pathogen testing market

7. Five Forces Analysis

7.1 Five forces summary

Five forces analysis - Comparison between 2025 and 2030

7.2 Bargaining power of buyers

Bargaining power of buyers - Impact of key factors 2025 and 2030

7.3 Bargaining power of suppliers

Bargaining power of suppliers - Impact of key factors in 2025 and 2030

7.4 Threat of new entrants

Threat of new entrants - Impact of key factors in 2025 and 2030

7.5 Threat of substitutes

Threat of substitutes - Impact of key factors in 2025 and 2030

7.6 Threat of rivalry

Threat of rivalry - Impact of key factors in 2025 and 2030

7.7 Market condition

Chart on Market condition - Five forces 2025 and 2030

8. Market Segmentation by Application

8.1 Market segments

Chart on Application - Market share 2025-2030 (%)
Data Table on Application - Market share 2025-2030 (%)

8.2 Comparison by Application

Chart on Comparison by Application
Data Table on Comparison by Application

8.3 Meat and poultry - Market size and forecast 2025-2030

Chart on Meat and poultry - Market size and forecast 2025-2030 ($ million)
Data Table on Meat and poultry - Market size and forecast 2025-2030 ($ million)
Chart on Meat and poultry - Year-over-year growth 2025-2030 (%)
Data Table on Meat and poultry - Year-over-year growth 2025-2030 (%)

8.4 Dairy - Market size and forecast 2025-2030

Chart on Dairy - Market size and forecast 2025-2030 ($ million)
Data Table on Dairy - Market size and forecast 2025-2030 ($ million)
Chart on Dairy - Year-over-year growth 2025-2030 (%)
Data Table on Dairy - Year-over-year growth 2025-2030 (%)

8.5 Processed food - Market size and forecast 2025-2030

Chart on Processed food - Market size and forecast 2025-2030 ($ million)
Data Table on Processed food - Market size and forecast 2025-2030 ($ million)
Chart on Processed food - Year-over-year growth 2025-2030 (%)
Data Table on Processed food - Year-over-year growth 2025-2030 (%)

8.6 Fruits and vegetables - Market size and forecast 2025-2030

Chart on Fruits and vegetables - Market size and forecast 2025-2030 ($ million)
Data Table on Fruits and vegetables - Market size and forecast 2025-2030 ($ million)
Chart on Fruits and vegetables - Year-over-year growth 2025-2030 (%)
Data Table on Fruits and vegetables - Year-over-year growth 2025-2030 (%)

8.7 Cereals and grains - Market size and forecast 2025-2030

Chart on Cereals and grains - Market size and forecast 2025-2030 ($ million)
Data Table on Cereals and grains - Market size and forecast 2025-2030 ($ million)
Chart on Cereals and grains - Year-over-year growth 2025-2030 (%)
Data Table on Cereals and grains - Year-over-year growth 2025-2030 (%)

8.8 Market opportunity by Application

Market opportunity by Application ($ million)
Data Table on Market opportunity by Application ($ million)

9. Market Segmentation by Method

9.1 Market segments

Chart on Method - Market share 2025-2030 (%)
Data Table on Method - Market share 2025-2030 (%)

9.2 Comparison by Method

Chart on Comparison by Method
Data Table on Comparison by Method

9.3 Conventional methods - Market size and forecast 2025-2030

Chart on Conventional methods - Market size and forecast 2025-2030 ($ million)
Data Table on Conventional methods - Market size and forecast 2025-2030 ($ million)
Chart on Conventional methods - Year-over-year growth 2025-2030 (%)
Data Table on Conventional methods - Year-over-year growth 2025-2030 (%)

9.4 Rapid methods - Market size and forecast 2025-2030

Chart on Rapid methods - Market size and forecast 2025-2030 ($ million)
Data Table on Rapid methods - Market size and forecast 2025-2030 ($ million)
Chart on Rapid methods - Year-over-year growth 2025-2030 (%)
Data Table on Rapid methods - Year-over-year growth 2025-2030 (%)

9.5 Market opportunity by Method

Market opportunity by Method ($ million)
Data Table on Market opportunity by Method ($ million)

10. Market Segmentation by Type

10.1 Market segments

Chart on Type - Market share 2025-2030 (%)
Data Table on Type - Market share 2025-2030 (%)

10.2 Comparison by Type

Chart on Comparison by Type
Data Table on Comparison by Type

10.3 Salmonella - Market size and forecast 2025-2030

Chart on Salmonella - Market size and forecast 2025-2030 ($ million)
Data Table on Salmonella - Market size and forecast 2025-2030 ($ million)
Chart on Salmonella - Year-over-year growth 2025-2030 (%)
Data Table on Salmonella - Year-over-year growth 2025-2030 (%)

10.4 E coli - Market size and forecast 2025-2030

Chart on E coli - Market size and forecast 2025-2030 ($ million)
Data Table on E coli - Market size and forecast 2025-2030 ($ million)
Chart on E coli - Year-over-year growth 2025-2030 (%)
Data Table on E coli - Year-over-year growth 2025-2030 (%)

10.5 Listeria - Market size and forecast 2025-2030

Chart on Listeria - Market size and forecast 2025-2030 ($ million)
Data Table on Listeria - Market size and forecast 2025-2030 ($ million)
Chart on Listeria - Year-over-year growth 2025-2030 (%)
Data Table on Listeria - Year-over-year growth 2025-2030 (%)

10.6 Campylobacter - Market size and forecast 2025-2030

Chart on Campylobacter - Market size and forecast 2025-2030 ($ million)
Data Table on Campylobacter - Market size and forecast 2025-2030 ($ million)
Chart on Campylobacter - Year-over-year growth 2025-2030 (%)
Data Table on Campylobacter - Year-over-year growth 2025-2030 (%)

10.7 Others - Market size and forecast 2025-2030

Chart on Others - Market size and forecast 2025-2030 ($ million)
Data Table on Others - Market size and forecast 2025-2030 ($ million)
Chart on Others - Year-over-year growth 2025-2030 (%)
Data Table on Others - Year-over-year growth 2025-2030 (%)

10.8 Market opportunity by Type

Market opportunity by Type ($ million)
Data Table on Market opportunity by Type ($ million)

11. Customer Landscape

11.1 Customer landscape overview

Analysis of price sensitivity, lifecycle, customer purchase basket, adoption rates, and purchase criteria

12. Geographic Landscape

12.1 Geographic segmentation

Chart on Market share by geography 2025-2030 (%)
Data Table on Market share by geography 2025-2030 (%)

12.2 Geographic comparison

Chart on Geographic comparison
Data Table on Geographic comparison

12.3 North America - Market size and forecast 2025-2030

Chart on North America - Market size and forecast 2025-2030 ($ million)
Data Table on North America - Market size and forecast 2025-2030 ($ million)
Chart on North America - Year-over-year growth 2025-2030 (%)
Data Table on North America - Year-over-year growth 2025-2030 (%)
Chart on Regional Comparison - North America
Data Table on Regional Comparison - North America

12.3.1 US - Market size and forecast 2025-2030

Chart on US - Market size and forecast 2025-2030 ($ million)
Data Table on US - Market size and forecast 2025-2030 ($ million)
Chart on US - Year-over-year growth 2025-2030 (%)
Data Table on US - Year-over-year growth 2025-2030 (%)

12.3.2 Canada - Market size and forecast 2025-2030

Chart on Canada - Market size and forecast 2025-2030 ($ million)
Data Table on Canada - Market size and forecast 2025-2030 ($ million)
Chart on Canada - Year-over-year growth 2025-2030 (%)
Data Table on Canada - Year-over-year growth 2025-2030 (%)

12.3.3 Mexico - Market size and forecast 2025-2030

Chart on Mexico - Market size and forecast 2025-2030 ($ million)
Data Table on Mexico - Market size and forecast 2025-2030 ($ million)
Chart on Mexico - Year-over-year growth 2025-2030 (%)
Data Table on Mexico - Year-over-year growth 2025-2030 (%)

12.4 Europe - Market size and forecast 2025-2030

Chart on Europe - Market size and forecast 2025-2030 ($ million)
Data Table on Europe - Market size and forecast 2025-2030 ($ million)
Chart on Europe - Year-over-year growth 2025-2030 (%)
Data Table on Europe - Year-over-year growth 2025-2030 (%)
Chart on Regional Comparison - Europe
Data Table on Regional Comparison - Europe

12.4.1 Germany - Market size and forecast 2025-2030

Chart on Germany - Market size and forecast 2025-2030 ($ million)
Data Table on Germany - Market size and forecast 2025-2030 ($ million)
Chart on Germany - Year-over-year growth 2025-2030 (%)
Data Table on Germany - Year-over-year growth 2025-2030 (%)

12.4.2 UK - Market size and forecast 2025-2030

Chart on UK - Market size and forecast 2025-2030 ($ million)
Data Table on UK - Market size and forecast 2025-2030 ($ million)
Chart on UK - Year-over-year growth 2025-2030 (%)
Data Table on UK - Year-over-year growth 2025-2030 (%)

12.4.3 France - Market size and forecast 2025-2030

Chart on France - Market size and forecast 2025-2030 ($ million)
Data Table on France - Market size and forecast 2025-2030 ($ million)
Chart on France - Year-over-year growth 2025-2030 (%)
Data Table on France - Year-over-year growth 2025-2030 (%)

12.4.4 Italy - Market size and forecast 2025-2030

Chart on Italy - Market size and forecast 2025-2030 ($ million)
Data Table on Italy - Market size and forecast 2025-2030 ($ million)
Chart on Italy - Year-over-year growth 2025-2030 (%)
Data Table on Italy - Year-over-year growth 2025-2030 (%)

12.4.5 Spain - Market size and forecast 2025-2030

Chart on Spain - Market size and forecast 2025-2030 ($ million)
Data Table on Spain - Market size and forecast 2025-2030 ($ million)
Chart on Spain - Year-over-year growth 2025-2030 (%)
Data Table on Spain - Year-over-year growth 2025-2030 (%)

12.4.6 The Netherlands - Market size and forecast 2025-2030

Chart on The Netherlands - Market size and forecast 2025-2030 ($ million)
Data Table on The Netherlands - Market size and forecast 2025-2030 ($ million)
Chart on The Netherlands - Year-over-year growth 2025-2030 (%)
Data Table on The Netherlands - Year-over-year growth 2025-2030 (%)

12.5 Asia - Market size and forecast 2025-2030

Chart on Asia - Market size and forecast 2025-2030 ($ million)
Data Table on Asia - Market size and forecast 2025-2030 ($ million)
Chart on Asia - Year-over-year growth 2025-2030 (%)
Data Table on Asia - Year-over-year growth 2025-2030 (%)
Chart on Regional Comparison - Asia
Data Table on Regional Comparison - Asia

12.5.1 China - Market size and forecast 2025-2030

Chart on China - Market size and forecast 2025-2030 ($ million)
Data Table on China - Market size and forecast 2025-2030 ($ million)
Chart on China - Year-over-year growth 2025-2030 (%)
Data Table on China - Year-over-year growth 2025-2030 (%)

12.5.2 India - Market size and forecast 2025-2030

Chart on India - Market size and forecast 2025-2030 ($ million)
Data Table on India - Market size and forecast 2025-2030 ($ million)
Chart on India - Year-over-year growth 2025-2030 (%)
Data Table on India - Year-over-year growth 2025-2030 (%)

12.5.3 Japan - Market size and forecast 2025-2030

Chart on Japan - Market size and forecast 2025-2030 ($ million)
Data Table on Japan - Market size and forecast 2025-2030 ($ million)
Chart on Japan - Year-over-year growth 2025-2030 (%)
Data Table on Japan - Year-over-year growth 2025-2030 (%)

12.5.4 South Korea - Market size and forecast 2025-2030

Chart on South Korea - Market size and forecast 2025-2030 ($ million)
Data Table on South Korea - Market size and forecast 2025-2030 ($ million)
Chart on South Korea - Year-over-year growth 2025-2030 (%)
Data Table on South Korea - Year-over-year growth 2025-2030 (%)

12.5.5 Indonesia - Market size and forecast 2025-2030

Chart on Indonesia - Market size and forecast 2025-2030 ($ million)
Data Table on Indonesia - Market size and forecast 2025-2030 ($ million)
Chart on Indonesia - Year-over-year growth 2025-2030 (%)
Data Table on Indonesia - Year-over-year growth 2025-2030 (%)

12.5.6 Thailand - Market size and forecast 2025-2030

Chart on Thailand - Market size and forecast 2025-2030 ($ million)
Data Table on Thailand - Market size and forecast 2025-2030 ($ million)
Chart on Thailand - Year-over-year growth 2025-2030 (%)
Data Table on Thailand - Year-over-year growth 2025-2030 (%)

12.6 Rest of World (ROW) - Market size and forecast 2025-2030

Chart on Rest of World (ROW) - Market size and forecast 2025-2030 ($ million)
Data Table on Rest of World (ROW) - Market size and forecast 2025-2030 ($ million)
Chart on Rest of World (ROW) - Year-over-year growth 2025-2030 (%)
Data Table on Rest of World (ROW) - Year-over-year growth 2025-2030 (%)
Chart on Regional Comparison - Rest of World (ROW)
Data Table on Regional Comparison - Rest of World (ROW)

12.6.1 Brazil - Market size and forecast 2025-2030

Chart on Brazil - Market size and forecast 2025-2030 ($ million)
Data Table on Brazil - Market size and forecast 2025-2030 ($ million)
Chart on Brazil - Year-over-year growth 2025-2030 (%)
Data Table on Brazil - Year-over-year growth 2025-2030 (%)

12.6.2 Saudi Arabia - Market size and forecast 2025-2030

Chart on Saudi Arabia - Market size and forecast 2025-2030 ($ million)
Data Table on Saudi Arabia - Market size and forecast 2025-2030 ($ million)
Chart on Saudi Arabia - Year-over-year growth 2025-2030 (%)
Data Table on Saudi Arabia - Year-over-year growth 2025-2030 (%)

12.6.3 Argentina - Market size and forecast 2025-2030

Chart on Argentina - Market size and forecast 2025-2030 ($ million)
Data Table on Argentina - Market size and forecast 2025-2030 ($ million)
Chart on Argentina - Year-over-year growth 2025-2030 (%)
Data Table on Argentina - Year-over-year growth 2025-2030 (%)

12.6.4 UAE - Market size and forecast 2025-2030

Chart on UAE - Market size and forecast 2025-2030 ($ million)
Data Table on UAE - Market size and forecast 2025-2030 ($ million)
Chart on UAE - Year-over-year growth 2025-2030 (%)
Data Table on UAE - Year-over-year growth 2025-2030 (%)

12.6.5 South Africa - Market size and forecast 2025-2030

Chart on South Africa - Market size and forecast 2025-2030 ($ million)
Data Table on South Africa - Market size and forecast 2025-2030 ($ million)
Chart on South Africa - Year-over-year growth 2025-2030 (%)
Data Table on South Africa - Year-over-year growth 2025-2030 (%)

12.6.6 Colombia - Market size and forecast 2025-2030

Chart on Colombia - Market size and forecast 2025-2030 ($ million)
Data Table on Colombia - Market size and forecast 2025-2030 ($ million)
Chart on Colombia - Year-over-year growth 2025-2030 (%)
Data Table on Colombia - Year-over-year growth 2025-2030 (%)

12.6.7 Turkey - Market size and forecast 2025-2030

Chart on Turkey - Market size and forecast 2025-2030 ($ million)
Data Table on Turkey - Market size and forecast 2025-2030 ($ million)
Chart on Turkey - Year-over-year growth 2025-2030 (%)
Data Table on Turkey - Year-over-year growth 2025-2030 (%)

12.6.8 Israel - Market size and forecast 2025-2030

Chart on Israel - Market size and forecast 2025-2030 ($ million)
Data Table on Israel - Market size and forecast 2025-2030 ($ million)
Chart on Israel - Year-over-year growth 2025-2030 (%)
Data Table on Israel - Year-over-year growth 2025-2030 (%)

12.7 Market opportunity by geography

Market opportunity by geography ($ million)
Data Tables on Market opportunity by geography ($ million)

13. Drivers, Challenges, and Opportunity

13.1 Market drivers

Stringent regulatory frameworks and international compliance standards
Technological advancements in rapid pathogen detection and automation
Rising consumer awareness and globalization of food supply chains

13.2 Market challenges

High costs of advanced diagnostic instrumentation
Complexity of multi-pathogen detection across matrices
Impact of environmental instability and climate volatility

13.3 Impact of drivers and challenges

Impact of drivers and challenges in 2025 and 2030

13.4 Market opportunities

Integration of predictive artificial intelligence and real-time risk analytics
Adoption of rapid molecular diagnostics and portable point-of-care testing
Rise of next-generation sequencing for comprehensive source tracking

14. Competitive Landscape

14.1 Overview

14.2

Overview on criticality of inputs and factors of differentiation

14.3 Landscape disruption

Overview on factors of disruption

14.4 Industry risks

Impact of key risks on business

15. Competitive Analysis

15.1 Companies profiled

Companies covered

15.2 Company ranking index

15.3 Market positioning of companies

Matrix on companies position and classification

15.4 ALS Ltd.

ALS Ltd. - Overview
ALS Ltd. - Business segments
ALS Ltd. - Key offerings
ALS Ltd. - Segment focus
SWOT

15.5 AsureQuality Ltd.

AsureQuality Ltd. - Overview
AsureQuality Ltd. - Product / Service
AsureQuality Ltd. - Key offerings
SWOT

15.6 BioMerieux SA

BioMerieux SA - Overview
BioMerieux SA - Business segments
BioMerieux SA - Key offerings
BioMerieux SA - Segment focus
SWOT

15.7 Daane Labs LLC

Daane Labs LLC - Overview
Daane Labs LLC - Product / Service
Daane Labs LLC - Key offerings
SWOT

15.8 Eurofins Scientific SE

Eurofins Scientific SE - Overview
Eurofins Scientific SE - Business segments
Eurofins Scientific SE - Key offerings
Eurofins Scientific SE - Segment focus
SWOT

15.9 Intertek Group Plc

Intertek Group Plc - Overview
Intertek Group Plc - Business segments
Intertek Group Plc - Key offerings
Intertek Group Plc - Segment focus
SWOT

15.10 Merck KGaA

Merck KGaA - Overview
Merck KGaA - Business segments
Merck KGaA - Key news
Merck KGaA - Key offerings
Merck KGaA - Segment focus
SWOT

15.11 Merieux NutriSciences Corp.

Merieux NutriSciences Corp. - Overview
Merieux NutriSciences Corp. - Product / Service
Merieux NutriSciences Corp. - Key offerings
SWOT

15.12 Microbac Laboratories Inc.

Microbac Laboratories Inc. - Overview
Microbac Laboratories Inc. - Product / Service
Microbac Laboratories Inc. - Key offerings
SWOT

15.13 Neogen Corp.

Neogen Corp. - Overview
Neogen Corp. - Business segments
Neogen Corp. - Key offerings
Neogen Corp. - Segment focus
SWOT

15.14 PerkinElmer US LLC

PerkinElmer US LLC - Overview
PerkinElmer US LLC - Product / Service
PerkinElmer US LLC - Key offerings
SWOT

15.15 Romer Labs Division Holding GmbH

Romer Labs Division Holding GmbH - Overview
Romer Labs Division Holding GmbH - Product / Service
Romer Labs Division Holding GmbH - Key offerings
SWOT

15.16 SGS SA

SGS SA - Overview
SGS SA - Business segments
SGS SA - Key offerings
SGS SA - Segment focus
SWOT

15.17 Thermo Fisher Scientific Inc.

Thermo Fisher Scientific Inc. - Overview
Thermo Fisher Scientific Inc. - Business segments
Thermo Fisher Scientific Inc. - Key news
Thermo Fisher Scientific Inc. - Key offerings
Thermo Fisher Scientific Inc. - Segment focus
SWOT

15.18 TUV SUD AG

TUV SUD AG - Overview
TUV SUD AG - Product / Service
TUV SUD AG - Key offerings
SWOT

16. Appendix

16.1 Scope of the report

Market definition
Objectives
Notes and caveats

16.2 Inclusions and exclusions checklist

Inclusions checklist
Exclusions checklist

16.3 Currency conversion rates for US$

16.4 Research methodology

16.5 Data procurement

Information sources

16.6 Data validation

16.7 Validation techniques employed for market sizing

16.8 Data synthesis

16.9 360 degree market analysis

16.10 List of abbreviations

Research Methodology

Technavio presents a detailed picture of the market by way of study, synthesis, and summation of data from multiple sources. The analysts have presented the various facets of the market with a particular focus on identifying the key industry influencers. The data thus presented is comprehensive, reliable, and the result of extensive research, both primary and secondary.

INFORMATION SOURCES

Primary sources

  • Manufacturers and suppliers
  • Channel partners
  • Industry experts
  • Strategic decision makers

Secondary sources

  • Industry journals and periodicals
  • Government data
  • Financial reports of key industry players
  • Historical data
  • Press releases

DATA ANALYSIS

Data Synthesis

  • Collation of data
  • Estimation of key figures
  • Analysis of derived insights

Data Validation

  • Triangulation with data models
  • Reference against proprietary databases
  • Corroboration with industry experts

REPORT WRITING

Qualitative

  • Market drivers
  • Market challenges
  • Market trends
  • Five forces analysis

Quantitative

  • Market size and forecast
  • Market segmentation
  • Geographical insights
  • Competitive landscape

Interested in this report?

Get your sample now to see our research methodology and insights!

Download Now

Frequently Asked Questions

Food Pathogen Testing market growth will increase by USD 2388.9 million during 2026-2030.

The Food Pathogen Testing market is expected to grow at a CAGR of 4.8% during 2026-2030.

Food Pathogen Testing market is segmented by Application (Meat and poultry, Dairy, Processed food, Fruits and vegetables, Cereals and grains) Method (Conventional methods, Rapid methods) Type (Salmonella, E coli, Listeria, Campylobacter, Others)

ALS Ltd., AsureQuality Ltd., BioMerieux SA, Caribbean Genetics, Creative Diagnostics, Daane Labs LLC, Eurofins Scientific SE, Intertek Group Plc, LabGen, Merck KGaA, Merieux NutriSciences Corp., Microbac Laboratories Inc., Neogen Corp., PerkinElmer US LLC, Romer Labs Division Holding GmbH, SGS SA, Symbio Laboratories, Thermo Fisher Scientific Inc., TUV SUD AG are a few of the key vendors in the Food Pathogen Testing market.

Asia will register the highest growth rate of 29.3% among the other regions. Therefore, the Food Pathogen Testing market in Asia is expected to garner significant business opportunities for the vendors during the forecast period.

US, Canada, Mexico, Germany, UK, France, Italy, Spain, The Netherlands, China, India, Japan, South Korea, Indonesia, Thailand, Brazil, Saudi Arabia, Argentina, UAE, South Africa, Colombia, Turkey, Israel

  • Stringent regulatory frameworks and international compliance standards is the driving factor this market.

The Food Pathogen Testing market vendors should focus on grabbing business opportunities from the Application segment as it accounted for the largest market share in the base year.
RIA - Research AI Assistant
Ask RIA