Livestock Feeding Systems Market Analysis Europe, North America, APAC, South America, Middle East and Africa - US, Germany, The Netherlands, Australia, UK - Size and Forecast 2024-2028

Livestock Feeding Systems Market Analysis Europe, North America, APAC, South America, Middle East and Africa - US, Germany, The Netherlands, Australia, UK - Size and Forecast 2024-2028

Published: Jul 2024 174 Pages SKU: IRTNTR45772

Market Overview at a Glance

$2.60 B
Market Opportunity
6.78%
CAGR
6.23
YoY growth 2023-2024(%)

Livestock Feeding Systems Market Size 2024-2028

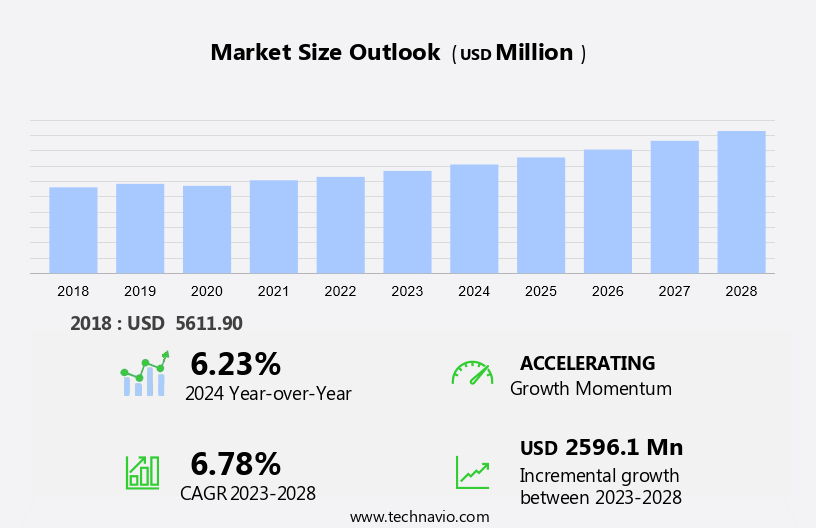
The livestock feeding systems market size is forecast to increase by USD 2.6 billion at a CAGR of 6.78% between 2023 and 2028.

  • The market is experiencing significant growth, driven by the increasing population of cattle in farms and the rising demand for modular and flexible systems. The global livestock industry is expanding, leading to an increased focus on efficient and cost-effective feeding systems. This trend is particularly prominent in developed markets, where intensive farming practices are prevalent. Moreover, the need for significant initial investments in advanced feeding systems, such as automated and computerized systems, presents both opportunities and challenges for market participants. On one hand, these systems offer improved productivity, reduced labor costs, and enhanced animal welfare. On the other hand, they require substantial capital expenditures and ongoing maintenance costs. Key trends In the market include the integration of IoT and data analytics to optimize feeding operations, the increasing popularity of alternative protein sources, and the growing adoption of sustainable and eco-friendly feeding systems. Companies seeking to capitalize on these opportunities must stay abreast of the latest technological advancements and regulatory requirements, while also addressing the challenges posed by rising input costs and increasing competition. Effective strategic planning, operational efficiency, and a strong focus on innovation will be essential for success in this dynamic and evolving market.

What will be the Size of the Market during the forecast period?

Livestock Feeding Systems Market Size

 Request Free Sample

  • The market encompasses a range of technologies and practices designed to efficiently and effectively deliver feed to cattle, dairy farms, poultry, swine, equine, and other livestock producers. This market is driven by the need to optimize farm profitability, enhance animal health, and improve labor efficiency. Automated feeding systems, including feed mixes, feeding tables, and cameras with artificial intelligence, are increasingly popular solutions.
  • Feed management systems, incorporating heat detection and health monitoring technologies, enable farmers to optimize feeding schedules and prevent potential health issues. Novel feeding solutions, such as acoustic feeding technology and shrimp farming systems, also contribute to the market's growth. Overall, the market is expected to continue expanding as technology advances and farmers seek to maximize productivity and profitability.

How is this Livestock Feeding Systems Industry segmented?

The livestock feeding systems industry research report provides comprehensive data (region-wise segment analysis), with forecasts and estimates in "USD billion" for the period 2024-2028, as well as historical data from 2018-2022 for the following segments.

  • Application
    • Poultry
    • Ruminants
    • Swine
    • Others
  • Technology
    • Manual
    • Automated
    • Robotic
    • Others
  • Geography
    • Europe
      • Germany
      • The Netherlands
      • UK
    • North America
      • US
    • APAC
      • Australia
    • South America
    • Middle East and Africa

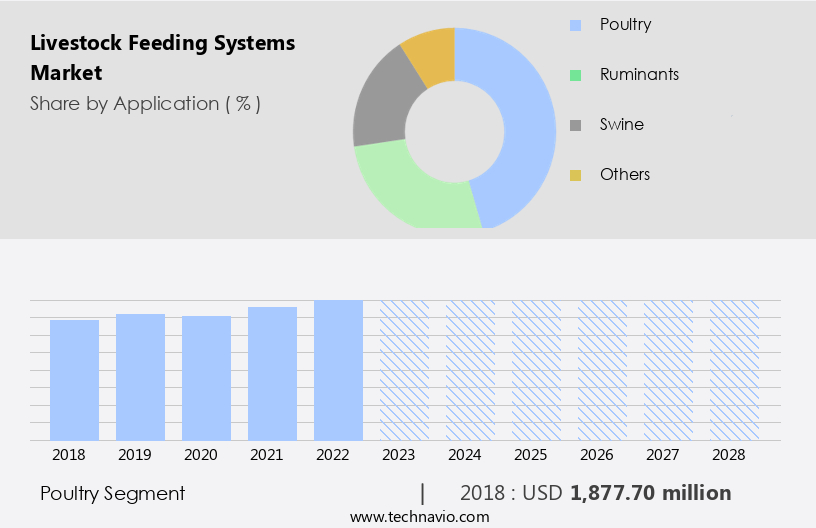
By Application Insights

The poultry segment is estimated to witness significant growth during the forecast period. The global livestock industry is witnessing significant growth, particularly In the poultry, pig, equine, ruminant, and aquaculture segments. According to the Organization for Economic Co-operation and Development (OECD), the global consumption of poultry meat is projected to reach 150 million tons by 2029, driving the demand for advanced livestock feeding systems. Labor intensive activities, such as feeding, are a significant challenge for livestock producers, especially in dairy farming with dairy cattle. Automated feeding systems, including feed pushers, feeding robots, and automated feeding tables, are gaining popularity to improve farm profitability and animal health. Feed components, such as soybean meal, feed additives, and feed mixes, are essential for optimal livestock growth and production efficiency.

Livestock Feeding Systems Market Size

Get a glance at the market report of share of various segments Request Free Sample

The poultry segment was valued at USD 1.88 billion in 2018 and showed a gradual increase during the forecast period.
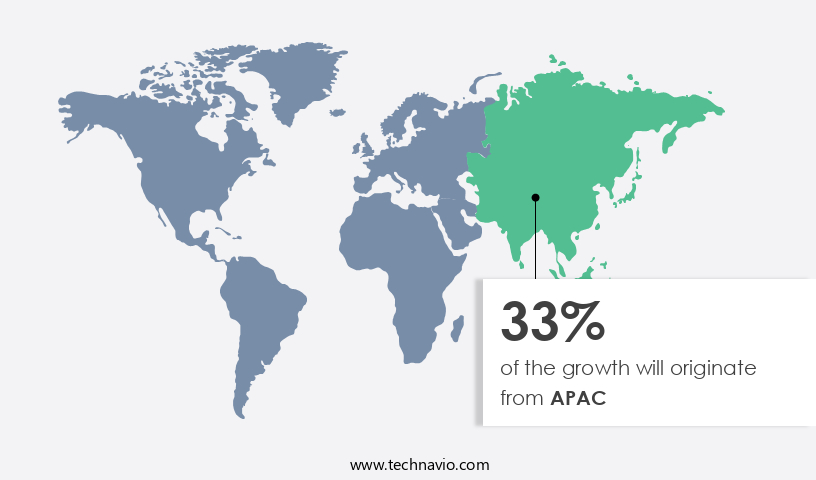
Regional Analysis

APAC is estimated to contribute 33% to the growth of the global market during the forecast period. Technavio's analysts have elaborately explained the regional trends and drivers that shape the market during the forecast period.

Livestock Feeding Systems Market Share by Geography

For more insights on the market size of various regions, Request Free Sample

In Europe, the market is witnessing significant growth due to the increasing demand for meat products both domestically and internationally. The European Union (EU) is a major contributor to the global meat industry, accounting for a substantial portion of livestock production. To cater to the rising demand, livestock producers are adopting advanced feeding systems, such as automated feeding systems and feed additives, to improve production efficiency, animal health, and farm profitability. Companies like Roxell BV are introducing innovative products, such as MiniMax feeder pans, to meet the specific requirements of various livestock categories, including poultry, cattle, and equine. Additionally, agriculture technology, such as GIS, GPS systems, and satellite devices, is being integrated into livestock monitoring services to optimize feed management, heat detection, health monitoring, and real-time updates on air temperatures, CO2 levels, and humidity levels.

Market Dynamics

Our researchers analyzed the data with 2023 as the base year, along with the key drivers, trends, and challenges. A holistic analysis of drivers will help companies refine their marketing strategies to gain a competitive advantage.

What are the key market drivers leading to the rise In the adoption of Livestock Feeding Systems Industry?

  • Rising population of cattle in farms is the key driver of the market. The global livestock farming industry has witnessed a significant expansion due to the increasing demand for meat and dairy products. According to the United States Department of Agriculture (USDA), the number of dairy cows In the US reached 9.4 million in January 2020, marking a substantial increase from a decade ago. This trend is driving the demand for cattle feed, as farmers aim to optimize their resources and enhance profitability. Advanced livestock feeding systems are essential to minimize wastage and ensure efficient nutrient utilization.
  • Consequently, The market is experiencing steady growth during the forecast period. Farmers' focus on maximizing productivity and reducing operational costs is fueling the adoption of advanced technologies and automated feeding systems. These systems offer features such as real-time monitoring, automated feeding, and precision feeding, enabling farmers to optimize their feeding practices and improve animal health and performance.

What are the market trends shaping the Livestock Feeding Systems Industry?

  • Growing demand for modular and flexible systems is the upcoming market trend. Livestock farming operations require efficient and effective feeding systems to optimize animal health and productivity. This need is driving the adoption of advanced livestock feeding systems. companies are responding to this demand by introducing new products with enhanced features. This integration of technology further improves operational efficiency, reduces labor costs, and enables data-driven decision-making. Additionally, modular and flexible feeding systems contribute to improved animal welfare and productivity by providing greater control over feeding schedules, portion sizes, and feed formulations. 
  • This results in better feed conversion rates, healthier animals, and ultimately, higher yields for farmers. For instance, in late 2020, a leading company launched a new feed grabber system for its automated feeding solution. This system streamlines the feeding process, reducing wastage during distribution, and extending the lifespan of the feed grabber bucket. Such innovations will significantly impact the market, contributing to cost savings and improved functionality for farmers during the forecast period.

What challenges does the Livestock Feeding Systems Industry face during its growth?

  • Need for significant initial investments is a key challenge affecting the industry growth. Livestock feeding systems have gained significance In the agricultural industry due to their ability to enhance livestock health and reduce operational expenses for farmers. These systems continuously monitor feed consumption, ensuring optimal nutrition and preventing wastage.
  • However, the high cost of acquisition and installation, particularly for small and medium-sized livestock farmers, poses a significant barrier to adoption. Large-scale farmers, on the other hand, require multiple systems due to the larger number of animals they manage, leading to substantial investments. Despite these challenges, companies continue to innovate and upgrade their offerings to cater to the evolving needs of the farming community.

Exclusive Customer Landscape

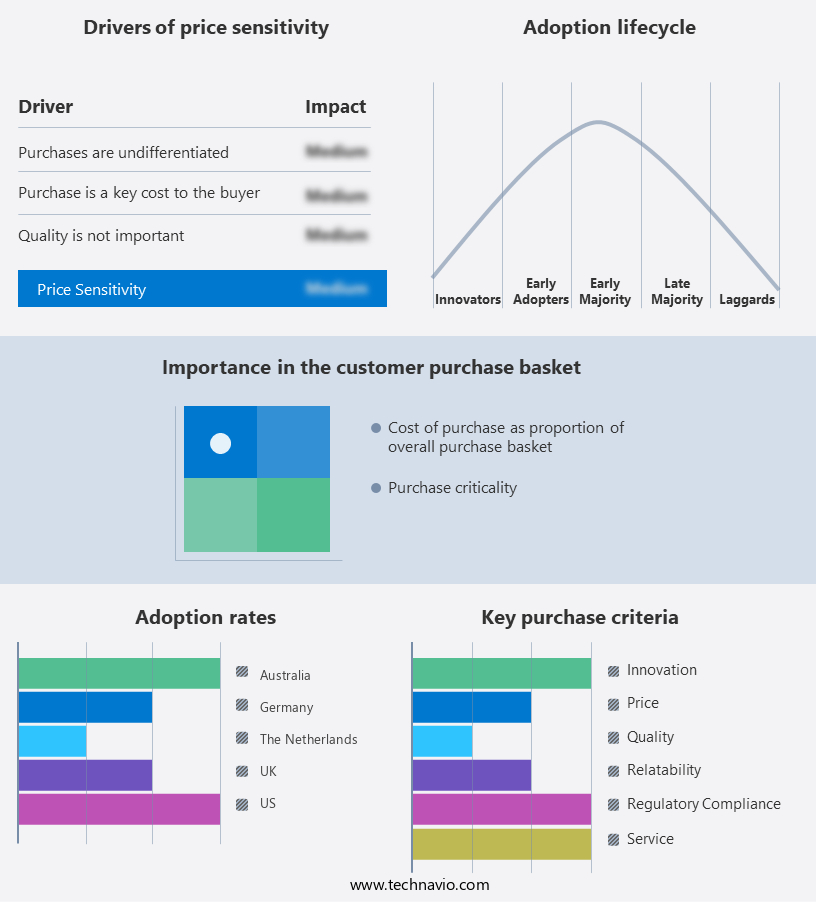
The market forecasting report includes the adoption lifecycle of the market, covering from the innovator's stage to the laggard's stage. It focuses on adoption rates in different regions based on penetration. Furthermore, the market report also includes key purchase criteria and drivers of price sensitivity to help companies evaluate and develop their market growth analysis strategies.

Livestock Feeding Systems Market Share by Geography

 Customer Landscape

Key Companies & Market Insights

Companies are implementing various strategies, such as strategic alliances, market forecast, partnerships, mergers and acquisitions, geographical expansion, and product/service launches, to enhance their presence in the industry.

The industry research and growth report includes detailed analyses of the competitive landscape of the market and information about key companies, including:

  • AGCO Corp.
  • Big Dutchman AG Holding
  • Cargill Inc.
  • CTB Inc.
  • Dairymaster
  • Daviesway Pty Ltd.
  • DeLaval International AB
  • Fullwood Ltd.
  • GEA Group AG
  • Hetwin Automation Systems Gmbh
  • JH Agro AS
  • Lely International NV
  • Madison One Holdings LLC
  • Maskinfabrikken Cormall AS
  • Pellon Group Oy
  • Rovibec Agrisolutions
  • Scale Aquaculture AS
  • Trevaskis Engineering Pty Ltd.
  • Trioliet BV
  • VDL Agrotech BV

Qualitative and quantitative analysis of companies has been conducted to help clients understand the wider business environment as well as the strengths and weaknesses of key industry players. Data is qualitatively analyzed to categorize companies as pure play, category-focused, industry-focused, and diversified; it is quantitatively analyzed to categorize companies as dominant, leading, strong, tentative, and weak.

Research Analyst Overview

Livestock feeding systems have been a crucial aspect of agricultural production for centuries. These systems play a significant role in ensuring the health and well-being of cattle, poultry, pigs, equines, and other livestock species. The livestock feeding industry has seen significant advancements in technology, automation, and innovation in recent years, aimed at improving production efficiency, reducing labor intensity, and enhancing animal health. Livestock producers have traditionally relied on labor-intensive activities such as manually preparing feed mixes and distributing them to feeding tables. However, the increasing labor shortage and the need for more precise and efficient feeding methods have led to the adoption of automated feeding systems.

Moreover, these systems utilize various components, including feed additives, feeding pushers, and feeding robots, to ensure accurate and consistent feeding. The integration of agriculture technology into livestock feeding systems has revolutionized the industry. Automated feeding systems use control devices, GIS, GPS systems, and satellite devices to optimize feed distribution and monitor livestock populations. Livestock monitoring services provide real-time updates on various parameters such as air temperatures, ventilation, CO2 levels, humidity levels, power failures, and equipment failures, enabling farmers to respond promptly to any issues. Facial recognition technology and communication interfaces have been integrated into feeding systems to improve animal health and management.

Furthermore, heat detection and health monitoring cameras enable farmers to identify sick animals early and provide timely treatment. Artificial intelligence and optifeeding systems optimize feeding based on animal behavior and digestion, improving production efficiency and feed conversion. The livestock feeding industry caters to various livestock categories, including ruminant species such as cows and buffaloes, and monogastric species such as poultry, pigs, and equines. The industry also serves the aquaculture segment, with novel feeding solutions for shrimp farming. The adoption of technology-enabled systems has led to significant improvements in farm profitability, animal health, and agricultural output. The livestock feeding industry is not limited to dairy farms and dairy cattle.

In addition, it also serves the poultry, swine, and equine management sectors, producing meat products such as chicken meat, beef, and pork. The industry's focus on innovation and automation has led to the development of acoustic feeding technology, which uses sound to attract animals to the feeding area, reducing labor requirements and improving efficiency. The integration of agriculture technology, automation, and innovation has led to significant advancements In the industry, benefiting farmers, livestock producers, and consumers alike. The future of the industry lies in continued innovation and the adoption of technology-enabled systems to optimize livestock feeding and management.

Market Scope

Report Coverage

Details

Page number

174

Base year

2023

Historic period

2018-2022

Forecast period

2024-2028

Growth momentum & CAGR

Accelerate at a CAGR of 6.78%

Market growth 2024-2028

USD 2.6 billion

Market structure

Fragmented

YoY growth 2023-2024(%)

6.23

Key countries

US, Germany, The Netherlands, Australia, and UK

Competitive landscape

Leading Companies, market growth and forecasting, Market Positioning of Companies, Competitive Strategies, and Industry Risks

Request Free Sample

What are the Key Data Covered in this Market Research and Growth Report?

  • CAGR of the Livestock Feeding Systems industry during the forecast period
  • Detailed information on factors that will drive the growth and forecasting between 2024 and 2028
  • Precise estimation of the size of the market and its contribution of the industry in focus to the parent market
  • Accurate predictions about upcoming growth and trends and changes in consumer behaviour
  • Growth of the market across Europe, North America, APAC, South America, and Middle East and Africa
  • Thorough analysis of the market's competitive landscape and detailed information about companies
  • Comprehensive analysis of factors that will challenge the market growth of industry companies

We can help! Our analysts can customize this market research report to meet your requirements.

Get in touch

1 Executive Summary

  • 1.1 Market overview
    • Executive Summary - Chart on Market Overview
    • Executive Summary - Data Table on Market Overview
    • Executive Summary - Chart on Global Market Characteristics
    • Executive Summary - Chart on Market by Geography
    • Executive Summary - Chart on Market Segmentation by Application
    • Executive Summary - Chart on Market Segmentation by Technology
    • Executive Summary - Chart on Incremental Growth
    • Executive Summary - Data Table on Incremental Growth
    • Executive Summary - Chart on Company Market Positioning

2 Market Landscape

  • 2.1 Market ecosystem
    • Parent Market
    • Data Table on - Parent Market
  • 2.2 Market characteristics
    • Market characteristics analysis
  • 2.3 Value chain analysis
    • Value Chain Analysis

3 Market Sizing

  • 3.1 Market definition
    • Offerings of companies included in the market definition
  • 3.2 Market segment analysis
    • Market segments
  • 3.3 Market size 2023
    • 3.4 Market outlook: Forecast for 2023-2028
      • Chart on Global - Market size and forecast 2023-2028 ($ million)
      • Data Table on Global - Market size and forecast 2023-2028 ($ million)
      • Chart on Global Market: Year-over-year growth 2023-2028 (%)
      • Data Table on Global Market: Year-over-year growth 2023-2028 (%)

    4 Historic Market Size

    • 4.1 Global Livestock Feeding Systems Market 2018 - 2022
      • Historic Market Size - Data Table on Global Livestock Feeding Systems Market 2018 - 2022 ($ million)
    • 4.2 Application segment analysis 2018 - 2022
      • Historic Market Size - Application Segment 2018 - 2022 ($ million)
    • 4.3 Technology segment analysis 2018 - 2022
      • Historic Market Size - Technology Segment 2018 - 2022 ($ million)
    • 4.4 Geography segment analysis 2018 - 2022
      • Historic Market Size - Geography Segment 2018 - 2022 ($ million)
    • 4.5 Country segment analysis 2018 - 2022
      • Historic Market Size - Country Segment 2018 - 2022 ($ million)

    5 Five Forces Analysis

    • 5.1 Five forces summary
      • Five forces analysis - Comparison between 2023 and 2028
    • 5.2 Bargaining power of buyers
      • Bargaining power of buyers - Impact of key factors 2023 and 2028
    • 5.3 Bargaining power of suppliers
      • Bargaining power of suppliers - Impact of key factors in 2023 and 2028
    • 5.4 Threat of new entrants
      • Threat of new entrants - Impact of key factors in 2023 and 2028
    • 5.5 Threat of substitutes
      • Threat of substitutes - Impact of key factors in 2023 and 2028
    • 5.6 Threat of rivalry
      • Threat of rivalry - Impact of key factors in 2023 and 2028
    • 5.7 Market condition
      • Chart on Market condition - Five forces 2023 and 2028

    6 Market Segmentation by Application

    • 6.1 Market segments
      • Chart on Application - Market share 2023-2028 (%)
      • Data Table on Application - Market share 2023-2028 (%)
    • 6.2 Comparison by Application
      • Chart on Comparison by Application
      • Data Table on Comparison by Application
    • 6.3 Poultry - Market size and forecast 2023-2028
      • Chart on Poultry - Market size and forecast 2023-2028 ($ million)
      • Data Table on Poultry - Market size and forecast 2023-2028 ($ million)
      • Chart on Poultry - Year-over-year growth 2023-2028 (%)
      • Data Table on Poultry - Year-over-year growth 2023-2028 (%)
    • 6.4 Ruminants - Market size and forecast 2023-2028
      • Chart on Ruminants - Market size and forecast 2023-2028 ($ million)
      • Data Table on Ruminants - Market size and forecast 2023-2028 ($ million)
      • Chart on Ruminants - Year-over-year growth 2023-2028 (%)
      • Data Table on Ruminants - Year-over-year growth 2023-2028 (%)
    • 6.5 Swine - Market size and forecast 2023-2028
      • Chart on Swine - Market size and forecast 2023-2028 ($ million)
      • Data Table on Swine - Market size and forecast 2023-2028 ($ million)
      • Chart on Swine - Year-over-year growth 2023-2028 (%)
      • Data Table on Swine - Year-over-year growth 2023-2028 (%)
    • 6.6 Others - Market size and forecast 2023-2028
      • Chart on Others - Market size and forecast 2023-2028 ($ million)
      • Data Table on Others - Market size and forecast 2023-2028 ($ million)
      • Chart on Others - Year-over-year growth 2023-2028 (%)
      • Data Table on Others - Year-over-year growth 2023-2028 (%)
    • 6.7 Market opportunity by Application
      • Market opportunity by Application ($ million)
      • Data Table on Market opportunity by Application ($ million)

    7 Market Segmentation by Technology

    • 7.1 Market segments
      • Chart on Technology - Market share 2023-2028 (%)
      • Data Table on Technology - Market share 2023-2028 (%)
    • 7.2 Comparison by Technology
      • Chart on Comparison by Technology
      • Data Table on Comparison by Technology
    • 7.3 Manual - Market size and forecast 2023-2028
      • Chart on Manual - Market size and forecast 2023-2028 ($ million)
      • Data Table on Manual - Market size and forecast 2023-2028 ($ million)
      • Chart on Manual - Year-over-year growth 2023-2028 (%)
      • Data Table on Manual - Year-over-year growth 2023-2028 (%)
    • 7.4 Automated - Market size and forecast 2023-2028
      • Chart on Automated - Market size and forecast 2023-2028 ($ million)
      • Data Table on Automated - Market size and forecast 2023-2028 ($ million)
      • Chart on Automated - Year-over-year growth 2023-2028 (%)
      • Data Table on Automated - Year-over-year growth 2023-2028 (%)
    • 7.5 Robotic - Market size and forecast 2023-2028
      • Chart on Robotic - Market size and forecast 2023-2028 ($ million)
      • Data Table on Robotic - Market size and forecast 2023-2028 ($ million)
      • Chart on Robotic - Year-over-year growth 2023-2028 (%)
      • Data Table on Robotic - Year-over-year growth 2023-2028 (%)
    • 7.6 Others - Market size and forecast 2023-2028
      • Chart on Others - Market size and forecast 2023-2028 ($ million)
      • Data Table on Others - Market size and forecast 2023-2028 ($ million)
      • Chart on Others - Year-over-year growth 2023-2028 (%)
      • Data Table on Others - Year-over-year growth 2023-2028 (%)
    • 7.7 Market opportunity by Technology
      • Market opportunity by Technology ($ million)
      • Data Table on Market opportunity by Technology ($ million)

    8 Customer Landscape

    • 8.1 Customer landscape overview
      • Analysis of price sensitivity, lifecycle, customer purchase basket, adoption rates, and purchase criteria

    9 Geographic Landscape

    • 9.1 Geographic segmentation
      • Chart on Market share by geography 2023-2028 (%)
      • Data Table on Market share by geography 2023-2028 (%)
    • 9.2 Geographic comparison
      • Chart on Geographic comparison
      • Data Table on Geographic comparison
    • 9.3 Europe - Market size and forecast 2023-2028
      • Chart on Europe - Market size and forecast 2023-2028 ($ million)
      • Data Table on Europe - Market size and forecast 2023-2028 ($ million)
      • Chart on Europe - Year-over-year growth 2023-2028 (%)
      • Data Table on Europe - Year-over-year growth 2023-2028 (%)
    • 9.4 North America - Market size and forecast 2023-2028
      • Chart on North America - Market size and forecast 2023-2028 ($ million)
      • Data Table on North America - Market size and forecast 2023-2028 ($ million)
      • Chart on North America - Year-over-year growth 2023-2028 (%)
      • Data Table on North America - Year-over-year growth 2023-2028 (%)
    • 9.5 APAC - Market size and forecast 2023-2028
      • Chart on APAC - Market size and forecast 2023-2028 ($ million)
      • Data Table on APAC - Market size and forecast 2023-2028 ($ million)
      • Chart on APAC - Year-over-year growth 2023-2028 (%)
      • Data Table on APAC - Year-over-year growth 2023-2028 (%)
    • 9.6 South America - Market size and forecast 2023-2028
      • Chart on South America - Market size and forecast 2023-2028 ($ million)
      • Data Table on South America - Market size and forecast 2023-2028 ($ million)
      • Chart on South America - Year-over-year growth 2023-2028 (%)
      • Data Table on South America - Year-over-year growth 2023-2028 (%)
    • 9.7 Middle East and Africa - Market size and forecast 2023-2028
      • Chart on Middle East and Africa - Market size and forecast 2023-2028 ($ million)
      • Data Table on Middle East and Africa - Market size and forecast 2023-2028 ($ million)
      • Chart on Middle East and Africa - Year-over-year growth 2023-2028 (%)
      • Data Table on Middle East and Africa - Year-over-year growth 2023-2028 (%)
    • 9.8 US - Market size and forecast 2023-2028
      • Chart on US - Market size and forecast 2023-2028 ($ million)
      • Data Table on US - Market size and forecast 2023-2028 ($ million)
      • Chart on US - Year-over-year growth 2023-2028 (%)
      • Data Table on US - Year-over-year growth 2023-2028 (%)
    • 9.9 Germany - Market size and forecast 2023-2028
      • Chart on Germany - Market size and forecast 2023-2028 ($ million)
      • Data Table on Germany - Market size and forecast 2023-2028 ($ million)
      • Chart on Germany - Year-over-year growth 2023-2028 (%)
      • Data Table on Germany - Year-over-year growth 2023-2028 (%)
    • 9.10 The Netherlands - Market size and forecast 2023-2028
      • Chart on The Netherlands - Market size and forecast 2023-2028 ($ million)
      • Data Table on The Netherlands - Market size and forecast 2023-2028 ($ million)
      • Chart on The Netherlands - Year-over-year growth 2023-2028 (%)
      • Data Table on The Netherlands - Year-over-year growth 2023-2028 (%)
    • 9.11 Australia - Market size and forecast 2023-2028
      • Chart on Australia - Market size and forecast 2023-2028 ($ million)
      • Data Table on Australia - Market size and forecast 2023-2028 ($ million)
      • Chart on Australia - Year-over-year growth 2023-2028 (%)
      • Data Table on Australia - Year-over-year growth 2023-2028 (%)
    • 9.12 UK - Market size and forecast 2023-2028
      • Chart on UK - Market size and forecast 2023-2028 ($ million)
      • Data Table on UK - Market size and forecast 2023-2028 ($ million)
      • Chart on UK - Year-over-year growth 2023-2028 (%)
      • Data Table on UK - Year-over-year growth 2023-2028 (%)
    • 9.13 Market opportunity by geography
      • Market opportunity by geography ($ million)
      • Data Tables on Market opportunity by geography ($ million)

    10 Drivers, Challenges, and Opportunity/Restraints

    • 10.1 Market drivers
      • 10.2 Market challenges
        • 10.3 Impact of drivers and challenges
          • Impact of drivers and challenges in 2023 and 2028
        • 10.4 Market opportunities/restraints

          11 Competitive Landscape

          • 11.1 Overview
            • 11.2 Competitive Landscape
              • Overview on criticality of inputs and factors of differentiation
            • 11.3 Landscape disruption
              • Overview on factors of disruption
            • 11.4 Industry risks
              • Impact of key risks on business

            12 Competitive Analysis

            • 12.1 Companies profiled
              • Companies covered
            • 12.2 Market positioning of companies
              • Matrix on companies position and classification
            • 12.3 AGCO Corp.
              • AGCO Corp. - Overview
              • AGCO Corp. - Business segments
              • AGCO Corp. - Key news
              • AGCO Corp. - Key offerings
              • AGCO Corp. - Segment focus
            • 12.4 Big Dutchman AG Holding
              • Big Dutchman AG Holding - Overview
              • Big Dutchman AG Holding - Product / Service
              • Big Dutchman AG Holding - Key offerings
            • 12.5 Cargill Inc.
              • Cargill Inc. - Overview
              • Cargill Inc. - Product / Service
              • Cargill Inc. - Key news
              • Cargill Inc. - Key offerings
            • 12.6 CTB Inc.
              • CTB Inc. - Overview
              • CTB Inc. - Product / Service
              • CTB Inc. - Key offerings
            • 12.7 Dairymaster
              • Dairymaster - Overview
              • Dairymaster - Product / Service
              • Dairymaster - Key offerings
            • 12.8 Daviesway Pty Ltd.
              • Daviesway Pty Ltd. - Overview
              • Daviesway Pty Ltd. - Product / Service
              • Daviesway Pty Ltd. - Key offerings
            • 12.9 DeLaval International AB
              • DeLaval International AB - Overview
              • DeLaval International AB - Business segments
              • DeLaval International AB - Key offerings
              • DeLaval International AB - Segment focus
            • 12.10 GEA Group AG
              • GEA Group AG - Overview
              • GEA Group AG - Business segments
              • GEA Group AG - Key news
              • GEA Group AG - Key offerings
              • GEA Group AG - Segment focus
            • 12.11 Lely International NV
              • Lely International NV - Overview
              • Lely International NV - Product / Service
              • Lely International NV - Key offerings
            • 12.12 Madison One Holdings LLC
              • Madison One Holdings LLC - Overview
              • Madison One Holdings LLC - Product / Service
              • Madison One Holdings LLC - Key offerings
            • 12.13 Pellon Group Oy
              • Pellon Group Oy - Overview
              • Pellon Group Oy - Product / Service
              • Pellon Group Oy - Key offerings
            • 12.14 Rovibec Agrisolutions
              • Rovibec Agrisolutions - Overview
              • Rovibec Agrisolutions - Product / Service
              • Rovibec Agrisolutions - Key offerings
            • 12.15 Scale Aquaculture AS
              • Scale Aquaculture AS - Overview
              • Scale Aquaculture AS - Product / Service
              • Scale Aquaculture AS - Key offerings
            • 12.16 Trioliet BV
              • Trioliet BV - Overview
              • Trioliet BV - Product / Service
              • Trioliet BV - Key offerings
            • 12.17 VDL Agrotech BV
              • VDL Agrotech BV - Overview
              • VDL Agrotech BV - Product / Service
              • VDL Agrotech BV - Key offerings

            13 Appendix

            • 13.1 Scope of the report
              • 13.2 Inclusions and exclusions checklist
                • Inclusions checklist
                • Exclusions checklist
              • 13.3 Currency conversion rates for US$
                • Currency conversion rates for US$
              • 13.4 Research methodology
                • Research methodology
              • 13.5 Data procurement
                • Information sources
              • 13.6 Data validation
                • Data validation
              • 13.7 Validation techniques employed for market sizing
                • Validation techniques employed for market sizing
              • 13.8 Data synthesis
                • Data synthesis
              • 13.9 360 degree market analysis
                • 360 degree market analysis
              • 13.10 List of abbreviations
                • List of abbreviations

              Research Methodology

              Technavio presents a detailed picture of the market by way of study, synthesis, and summation of data from multiple sources. The analysts have presented the various facets of the market with a particular focus on identifying the key industry influencers. The data thus presented is comprehensive, reliable, and the result of extensive research, both primary and secondary.

              INFORMATION SOURCES

              Primary sources

              • Manufacturers and suppliers
              • Channel partners
              • Industry experts
              • Strategic decision makers

              Secondary sources

              • Industry journals and periodicals
              • Government data
              • Financial reports of key industry players
              • Historical data
              • Press releases

              DATA ANALYSIS

              Data Synthesis

              • Collation of data
              • Estimation of key figures
              • Analysis of derived insights

              Data Validation

              • Triangulation with data models
              • Reference against proprietary databases
              • Corroboration with industry experts

              REPORT WRITING

              Qualitative

              • Market drivers
              • Market challenges
              • Market trends
              • Five forces analysis

              Quantitative

              • Market size and forecast
              • Market segmentation
              • Geographical insights
              • Competitive landscape

              Interested in this report?

              Get your sample now to see our research methodology and insights!

              Download Now

              Frequently Asked Questions

              Livestock Feeding Systems market growth will increase by $ 2596.1 mn during 2024-2028 .

              The Livestock Feeding Systems market is expected to grow at a CAGR of 6.78% during 2024-2028 .

              Livestock Feeding Systems market is segmented by Application( Poultry, Ruminants, Swine, Others) Technology( Manual, Automated, Robotic, Others, MEA)

              AGCO Corp., Big Dutchman AG Holding, Cargill Inc., CTB Inc., Dairymaster, Daviesway Pty Ltd., DeLaval International AB, Fullwood Ltd., GEA Group AG, Hetwin Automation Systems Gmbh, JH Agro AS, Lely International NV, Madison One Holdings LLC, Maskinfabrikken Cormall AS, Pellon Group Oy, Rovibec Agrisolutions, Scale Aquaculture AS, Trevaskis Engineering Pty Ltd., Trioliet BV, VDL Agrotech BV are a few of the key vendors in the Livestock Feeding Systems market.

              APAC will register the highest growth rate of 33% among the other regions. Therefore, the Livestock Feeding Systems market in APAC is expected to garner significant business opportunities for the vendors during the forecast period.

              US, Germany, The Netherlands, Australia, UK

              • Rising population of cattle in farmsThe consistent growth in demand for meat and dairy products has encouraged farmers to increase the population of cattle on farms. For instance is the driving factor this market.
              • according to the USDA is the driving factor this market.
              • in January 2020 is the driving factor this market.
              • there were 9.4 million dairy cows in the US is the driving factor this market.
              • and the average size of dairy increased by over 40% in the past decade. Therefore is the driving factor this market.
              • the demand for cattle feed is increasing. Farmers must ensure the optimal use of cattle feed to avoid wastage and increase profitability. Hence is the driving factor this market.
              • they require advanced models of livestock feeding systems. Therefore is the driving factor this market.
              • the rising population of cattle in farms drives the growth of the global livestock feeding systems market during the forecast period. is the driving factor this market.

              The Livestock Feeding Systems market vendors should focus on grabbing business opportunities from the Poultry segment as it accounted for the largest market share in the base year.