LNG Carriers Market Analysis North America, Middle East and Africa, Europe, APAC, South America - UK, Japan, Qatar, Greece, Malaysia - Size and Forecast 2024-2028

LNG Carriers Market Analysis North America, Middle East and Africa, Europe, APAC, South America - UK, Japan, Qatar, Greece, Malaysia - Size and Forecast 2024-2028

Published: Jul 2024 145 Pages SKU: IRTNTR72920

Market Overview at a Glance

$3600 B
Market Opportunity
4.62%
CAGR
4.23
YoY growth 2023-2024(%)

LNG Carriers Market Size 2024-2028

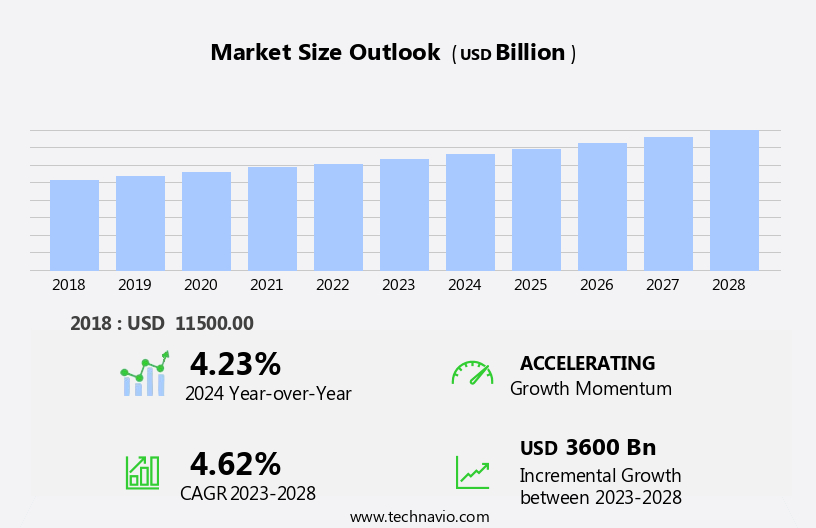
The lng carriers market size is forecast to increase by USD 3600 billion, at a CAGR of 4.62% between 2023 and 2028.

  • The LNG carrier market is experiencing significant growth, driven primarily by the increasing demand for natural gas as a cleaner alternative fuel. This shift towards cleaner energy sources is a global trend, with numerous countries and industries seeking to reduce their carbon footprint. Additionally, fluctuations in oil and gas prices continue to influence the market dynamics. While the volatility in oil prices presents both opportunities and challenges, the long-term trend of declining oil prices is expected to boost the demand for LNG as a cost-effective alternative. However, the market faces several challenges. First, the high capital costs associated with building and operating LNG carriers can be a barrier to entry for new players.
  • Second, the complex nature of LNG value chains, including production, transportation, and regasification, requires extensive expertise and coordination among various stakeholders. Lastly, the lack of infrastructure for LNG storage and distribution in some regions limits the market's growth potential. Companies seeking to capitalize on the opportunities presented by the LNG carrier market must navigate these challenges effectively by building strategic partnerships, investing in infrastructure, and leveraging their expertise to deliver cost-effective and efficient solutions.

What will be the Size of the LNG Carriers Market during the forecast period?

LNG Carriers Market Size

 Request Free Sample

The liquefied natural gas (LNG) carrier market continues to evolve, shaped by various market dynamics that impact different sectors of the industry. Emissions reduction is a key driver, with the adoption of dual-fuel engines and cryogenic technology in LNG carriers reducing greenhouse gas emissions. Weather routing and route optimization help improve fuel efficiency and reduce fuel costs in the LNG price-sensitive market. Gas infrastructure development, including liquefaction plants and LNG terminals, influences the supply and demand dynamics of the global LNG trade. Independent tanker operators and fleet management companies play a crucial role in optimizing vessel operations, ensuring safety systems, and maintaining fuel efficiency.

Ballast water management and crew training are essential components of LNG vessel operations, ensuring compliance with environmental regulations. The ongoing evolution of smart shipping and methane slip technologies contributes to the continuous optimization of LNG fueling and cargo handling processes. Freight rates, natural gas exports, and cargo hold capacity are influenced by the interplay of gas demand, LNG supply chain efficiency, and market volatility. The spot market and time charter contracts offer flexibility in the LNG transportation sector, while long-term contracts provide stability. LNG projects and fleet renewal are critical to meeting the growing demand for LNG fuel and maintaining a modern and efficient LNG carrier fleet.

The ongoing energy transition towards cleaner fuels and the increasing importance of data analytics and remote monitoring further shape the LNG carrier market's future trajectory. Pressure relief systems and hull design innovations contribute to the ongoing optimization of LNG transportation, ensuring safe and efficient gas transportation across diverse trade routes. The LNG infrastructure and tank capacity expansion continue to support the growth of the global LNG trade, making it a dynamic and evolving market.

How is this LNG Carriers Industry segmented?

The lng carriers industry research report provides comprehensive data (region-wise segment analysis), with forecasts and estimates in "USD billion" for the period 2024-2028, as well as historical data from 2018-2022 for the following segments.

  • Type
    • Membrane
    • Moss
  • Geography
    • Europe
      • Greece
      • UK
    • Middle East and Africa
      • Qatar
    • APAC
      • Japan
      • Malaysia
    • Rest of World (ROW)

By Type Insights

The membrane segment is estimated to witness significant growth during the forecast period.

Liquefied Natural Gas (LNG) carriers play a crucial role in the global energy transition by transporting this cleaner fuel from production sites to consumers. Membrane containment systems, a key component of these carriers, consist of insulated cargo tanks enclosed within an inner hull and protected by an outer hull. The spaces between the hulls serve as ballast and provide additional safety during emergencies. Membrane containment systems offer enhanced visibility compared to moss-type containments, which have protruding structures that can obstruct sightlines. Furthermore, membrane tanks have a higher carrying capacity, with a 10.27% increase in loading capacity under identical ship dimensions.

Cryogenic technology is integral to LNG carriers, enabling the liquefaction of natural gas at extremely low temperatures. Dual-fuel engines, which can run on both LNG and traditional fuels, are increasingly adopted to reduce emissions. Weather routing, optimizing routes based on meteorological conditions, and route optimization help improve fuel efficiency and reduce emissions. LNG prices and demand growth are significant factors influencing the market. Gas infrastructure, including liquefaction plants and terminals, plays a vital role in the LNG supply chain. Voyage charters, gas carriers, independent tanker operators, and fleet management companies contribute to the transportation of LNG. Environmental compliance is a priority, with ballast water management systems and safety systems essential for ensuring safe and sustainable operations.

Fleet renewal, engine optimization, propeller efficiency, and hull design are crucial aspects of fleet management. Data analytics and smart shipping technologies, such as route optimization and remote monitoring, enhance operational efficiency and reduce emissions. LNG bunkering and cargo handling are essential services in the LNG supply chain. Pressure relief systems and safety systems ensure safe vessel operations. Long-term contracts and spot market prices influence the LNG market dynamics. Market volatility and methane slip, a minor emission during LNG transportation, are challenges the industry must address. The energy transition and increasing demand for cleaner fuels are driving the growth of the LNG market. Boil-off gas, a byproduct of LNG transportation, can be utilized as fuel, further increasing the market's potential. LNG fueling infrastructure development and trade routes expansion are key areas of focus for the industry.

LNG Carriers Market Size

Request Free Sample

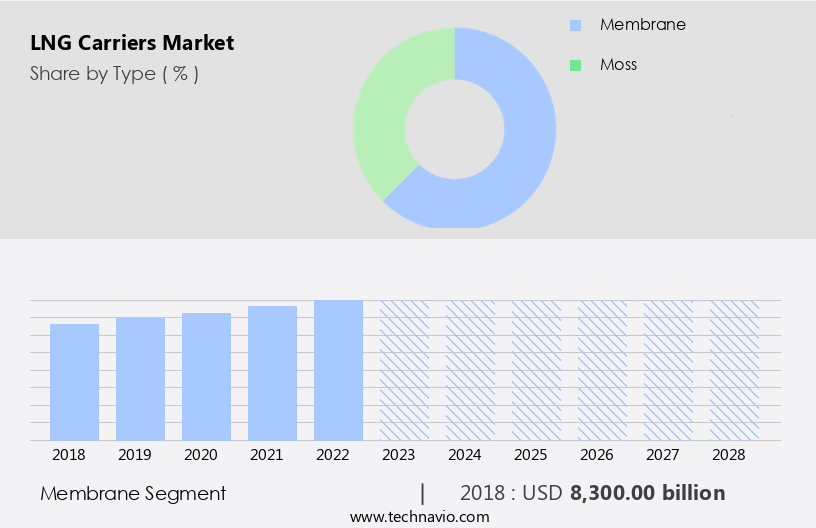
The Membrane segment was valued at USD 8,300.00 billion in 2018 and showed a gradual increase during the forecast period.

Regional Analysis

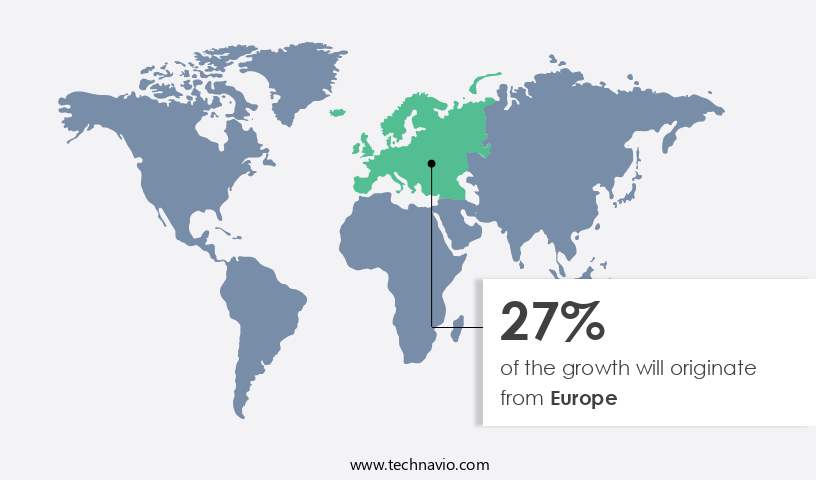
Europe is estimated to contribute 27% to the growth of the global market during the forecast period. Technavio's analysts have elaborately explained the regional trends and drivers that shape the market during the forecast period.

LNG Carriers Market Share by Geography

 Request Free Sample

The market in North America is driven by the significant production of natural gas in countries like the US and Canada. This production surge has led to a high demand for LNG carriers to transport the gas across the world. Bermuda, with its large fleet of LNG carriers owned by major shipowners such as Teekay LNG Partners, plays a crucial role in this global trade. Teekay LNG Partners' fleet includes vessels like Arwa Spirit and Cubal, with capacities of 165,500 m3 and 160,400 m3, respectively. The use of dual-fuel engines and weather routing in LNG carriers contributes to emissions reduction, enhancing their environmental compliance.

Cryogenic technology, a crucial aspect of LNG carriers, ensures the safe and efficient transportation of LNG. The global LNG trade relies on the optimization of routes and cargo handling, with data analytics playing a significant role in this process. The spot market and time charter are the primary contractual arrangements in the market. The increasing adoption of smart shipping practices, such as remote monitoring and fleet management, improves fuel efficiency and safety systems. The energy transition towards natural gas from traditional fossil fuels has led to an increase in LNG demand and the expansion of LNG infrastructure, including liquefaction plants and terminals.

The LNG supply chain faces challenges such as market volatility, methane slip, and ballast water management. To address these challenges, fleet renewal, engine optimization, hull design, and long-term contracts are essential strategies. The LNG bunkering industry is growing, providing LNG as a fuel alternative to traditional marine fuels. Crew training and safety systems are crucial for the safe operation of LNG carriers. The LNG projects underway, including new liquefaction plants and expansions, will further boost the market.

Market Dynamics

Our researchers analyzed the data with 2023 as the base year, along with the key drivers, trends, and challenges. A holistic analysis of drivers will help companies refine their marketing strategies to gain a competitive advantage.

What are the key market drivers leading to the rise in the adoption of LNG Carriers Industry?

  • The primary factor fueling the market is the rising demand for natural gas.  The International Energy Agency (IEA) projects that global natural gas demand will expand from 3,740 billion cubic meters (bcm) in 2017 to 4,100 bcm in 2023, representing a yearly growth rate of 1.6%. This expansion is largely driven by emerging economies, with China anticipated to become the world's leading natural gas importer by 2019. The IEA forecasts that China's natural gas demand will surge by 60% between 2017 and 2023, primarily due to government initiatives aimed at reducing air pollution by replacing coal with gas. In response to this growing demand, the LNG carrier market is poised for significant development.
  • LNG fuel's lower emissions compared to coal and oil make it an attractive alternative for reducing greenhouse gas emissions. To capitalize on this trend, gas carriers are increasingly adopting dual-fuel engines and implementing route optimization and weather routing to improve efficiency. Furthermore, the expansion of gas infrastructure, including liquefaction plants and LNG terminals, is expected to boost the voyage charter market for gas carriers. Independent tanker operators are also investing in cryogenic technology to enhance their fleets' competitiveness. Overall, the LNG carrier market is witnessing robust growth, driven by the increasing demand for natural gas and the need for cleaner energy sources.

What are the market trends shaping the LNG Carriers Industry?

  • The trend in the market is shifting towards an increased demand for cleaner fuels. This growing preference reflects a commitment to reducing environmental impact and promoting sustainability.
  • The market is experiencing significant growth due to the increasing demand for natural gas as a cleaner alternative to traditional energy sources such as oil and coal. According to the International Energy Agency (IEA), the global energy demand is projected to rise by 30% by 2040, driven by population growth and industrialization in emerging economies. This increasing demand for energy has led to a surge in natural gas exports and seaborne trade. LNG carriers play a crucial role in the global LNG trade by transporting the chilled fuel from production sites to importing countries. The market is driven by several factors, including the need for ballast water management to comply with international regulations, the adoption of smart shipping technologies to improve fuel efficiency and reduce methane slip, and the growing demand for LNG bunkering to support the expansion of the LNG fuel market.
  • Freight rates in the LNG carrier market are influenced by various factors, including the supply and demand balance, cargo hold size, and the type of charter agreement (spot market or time charter). The market is also impacted by the development of new LNG projects and the overall health of the global economy. Crew training and safety regulations are essential considerations in the LNG carrier market, as the transportation of LNG requires specialized skills and knowledge. The market is expected to continue growing as natural gas becomes an increasingly important part of the global energy mix.

What challenges does the LNG Carriers Industry face during its growth?

  • The volatile nature of oil and gas prices poses a significant challenge to the industry's growth trajectory. The LNG carrier market has experienced notable shifts due to the volatility in crude oil prices since the second quarter of 2016. The average crude oil import price dropped from USD 96.23/bbl in 2014 to USD 51.4/bbl in 2017, as per the International Energy Agency. This decline affected companies in the upstream oil and gas sector, leading to reduced profit margins and stalled investments. Consequently, several oil and gas projects were halted or canceled. Despite the challenges, the LNG infrastructure sector has continued to evolve, with a focus on fleet management, engine optimization, propeller efficiency, and environmental compliance.
  • Vessel operations have become more data-driven, with the integration of safety systems, fuel efficiency monitoring, and real-time cargo handling. Pressure relief systems have also gained importance to ensure safe and efficient LNG transportation. As the global gas demand continues to rise, the LNG supply chain is adapting to meet the growing needs. Companies are investing in advanced technologies to enhance fleet management, optimize engine performance, and improve propeller efficiency. Data analytics is playing a crucial role in optimizing vessel operations, ensuring regulatory compliance, and maintaining safety standards. The LNG carrier market is undergoing significant transformations to adapt to the changing market dynamics.
  • Companies are focusing on enhancing operational efficiency, ensuring safety, and complying with environmental regulations to remain competitive in the market.

Exclusive Customer Landscape

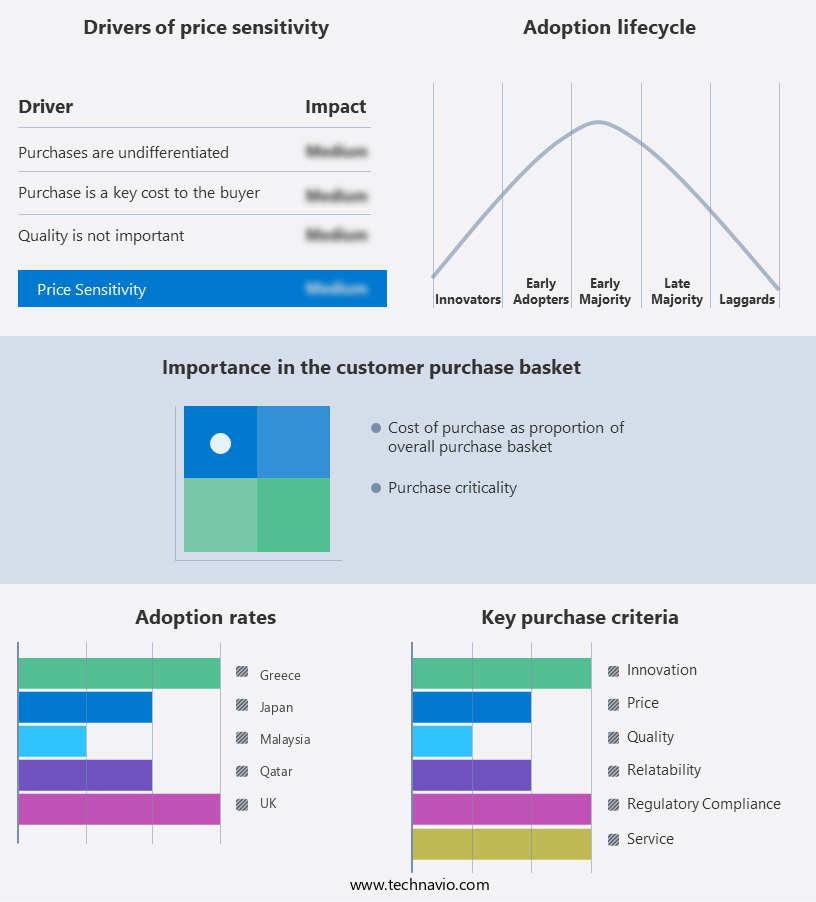
The LNG carriers market forecasting report includes the adoption lifecycle of the market, covering from the innovator's stage to the laggard's stage. It focuses on adoption rates in different regions based on penetration. Furthermore, the LNG carriers market report also includes key purchase criteria and drivers of price sensitivity to help companies evaluate and develop their market growth analysis strategies.

LNG Carriers Market Share by Geography

 Customer Landscape

Key Companies & Market Insights

Companies are implementing various strategies, such as strategic alliances, lng carriers market forecast, partnerships, mergers and acquisitions, geographical expansion, and product/service launches, to enhance their presence in the industry.

BW Group - The company specializes in providing a diverse range of LNG carrier solutions, encompassing floating LNG infrastructure such as BW LNG, BW LPG, BW Epic, BW Offshore, BW Energy, and BW Dry Cargo.

The industry research and growth report includes detailed analyses of the competitive landscape of the market and information about key companies, including:

  • BW Group
  • Dynagas Ltd.
  • Flex LNG Ltd.
  • GasLog Ltd.
  • Gaztransport and Technigaz SA
  • Golar LNG Ltd.
  • Hanwha Corp.
  • Japan Marine United Corp.
  • K Shipbuilding
  • Kawasaki Heavy Industries Ltd.
  • Maran Gas Maritime Inc.
  • Mitsubishi Heavy Industries Ltd.
  • Mitsui and Co. Ltd.
  • Nakilat
  • PETRONAS Chemicals Group Berhad
  • Samsung Heavy Industries Co. Ltd.
  • Shell plc
  • Teekay LNG Partners L.P
  • Wartsila Corp.

Qualitative and quantitative analysis of companies has been conducted to help clients understand the wider business environment as well as the strengths and weaknesses of key industry players. Data is qualitatively analyzed to categorize companies as pure play, category-focused, industry-focused, and diversified; it is quantitatively analyzed to categorize companies as dominant, leading, strong, tentative, and weak.

Recent Development and News in LNG Carriers Market

  • In February 2023, Shell and TotalEnergies announced a strategic partnership to jointly develop and construct a new LNG carrier fleet, aiming to reduce emissions and enhance their market presence in the LNG sector (Shell press release, 2023). This collaboration is expected to result in the construction of up to 12 new LNG carriers, each with a capacity of around 220,000 cubic meters, by 2028 (Shell press release, 2023).
  • In October 2024, Qatar Petroleum and ExxonMobil signed a memorandum of understanding to collaborate on the development of a new LNG production facility and associated infrastructure in Mozambique. This strategic partnership is anticipated to significantly expand the market presence of both companies in the LNG sector and contribute to the growing demand for LNG in Asia (ExxonMobil press release, 2024).
  • In January 2025, Mitsui O.S.K. Lines, Ltd. (MOL) and NYK Line, two major Japanese shipping companies, completed the merger of their LNG shipping businesses. This merger, valued at approximately USD 1.7 billion, is expected to create the world's largest LNG carrier fleet, enabling the combined entity to better compete in the global LNG shipping market and optimize their operations (MOL press release, 2025).
  • In March 2025, China's CNOOC Limited successfully deployed the world's first Type-C Flex LNG carrier, which features a unique design enabling it to load and unload LNG at a wider range of temperatures and pressures. This technological advancement is expected to significantly enhance the flexibility and efficiency of LNG trading and transportation, particularly in the rapidly growing Asian LNG market (CNOOC press release, 2025).

Research Analyst Overview

  • In the dynamic LNG carrier market, various carrier types cater to diverse customer needs, each with unique emissions profiles. Size matters in LNG shipping, with larger vessels offering economies of scale but also higher emissions. Regulation plays a significant role, driving innovation in carrier technology to enhance efficiency and sustainability. The future of LNG carriers lies in advanced designs, focusing on safety, performance, and financing. LNG carrier operations must balance efficiency with regulatory compliance and technological advancements.
  • Emissions reduction is a key trend, with carriers investing in innovative solutions to meet stringent regulations. Safety remains a top priority, with continuous improvements in carrier design and technology. Overall, the LNG carrier sector is undergoing transformative changes, shaping the future of the global energy landscape.

Dive into Technavio's robust research methodology, blending expert interviews, extensive data synthesis, and validated models for unparalleled LNG Carriers Market insights. See full methodology.

Market Scope

Report Coverage

Details

Page number

145

Base year

2023

Historic period

2018-2022

Forecast period

2024-2028

Growth momentum & CAGR

Accelerate at a CAGR of 4.62%

Market growth 2024-2028

USD 3600 billion

Market structure

Fragmented

YoY growth 2023-2024(%)

4.23

Key countries

UK, Japan, Qatar, Greece, and Malaysia

Competitive landscape

Leading Companies, Market Positioning of Companies, Competitive Strategies, and Industry Risks

Request Free Sample

What are the Key Data Covered in this LNG Carriers Market Research and Growth Report?

  • CAGR of the LNG Carriers industry during the forecast period
  • Detailed information on factors that will drive the growth and forecasting between 2024 and 2028
  • Precise estimation of the size of the market and its contribution of the industry in focus to the parent market
  • Accurate predictions about upcoming growth and trends and changes in consumer behaviour
  • Growth of the market across North America, Middle East and Africa, Europe, APAC, and South America
  • Thorough analysis of the market's competitive landscape and detailed information about companies
  • Comprehensive analysis of factors that will challenge the lng carriers market growth of industry companies

We can help! Our analysts can customize this lng carriers market research report to meet your requirements.

Get in touch

1 Executive Summary

  • 1.1 Market overview
    • Executive Summary - Chart on Market Overview
    • Executive Summary - Data Table on Market Overview
    • Executive Summary - Chart on Global Market Characteristics
    • Executive Summary - Chart on Market by Geography
    • Executive Summary - Chart on Market Segmentation by Type
    • Executive Summary - Chart on Incremental Growth
    • Executive Summary - Data Table on Incremental Growth
    • Executive Summary - Chart on Company Market Positioning

2 Market Landscape

  • 2.1 Market ecosystem
    • Parent Market
    • Data Table on - Parent Market
  • 2.2 Market characteristics
    • Market characteristics analysis
  • 2.3 Value chain analysis
    • Value Chain Analysis

3 Market Sizing

  • 3.1 Market definition
    • Offerings of companies included in the market definition
  • 3.2 Market segment analysis
    • Market segments
  • 3.3 Market size 2023
    • 3.4 Market outlook: Forecast for 2023-2028
      • Chart on Global - Market size and forecast 2023-2028 ($ billion)
      • Data Table on Global - Market size and forecast 2023-2028 ($ billion)
      • Chart on Global Market: Year-over-year growth 2023-2028 (%)
      • Data Table on Global Market: Year-over-year growth 2023-2028 (%)

    4 Historic Market Size

    • 4.1 Global LNG Carriers Market 2018 - 2022
      • Historic Market Size - Data Table on Global LNG Carriers Market 2018 - 2022 ($ billion)
    • 4.2 Type segment analysis 2018 - 2022
      • Historic Market Size - Type Segment 2018 - 2022 ($ billion)
    • 4.3 Geography segment analysis 2018 - 2022
      • Historic Market Size - Geography Segment 2018 - 2022 ($ billion)
    • 4.4 Country segment analysis 2018 - 2022
      • Historic Market Size - Country Segment 2018 - 2022 ($ billion)

    5 Five Forces Analysis

    • 5.1 Five forces summary
      • Five forces analysis - Comparison between 2023 and 2028
    • 5.2 Bargaining power of buyers
      • Bargaining power of buyers - Impact of key factors 2023 and 2028
    • 5.3 Bargaining power of suppliers
      • Bargaining power of suppliers - Impact of key factors in 2023 and 2028
    • 5.4 Threat of new entrants
      • Threat of new entrants - Impact of key factors in 2023 and 2028
    • 5.5 Threat of substitutes
      • Threat of substitutes - Impact of key factors in 2023 and 2028
    • 5.6 Threat of rivalry
      • Threat of rivalry - Impact of key factors in 2023 and 2028
    • 5.7 Market condition
      • Chart on Market condition - Five forces 2023 and 2028

    6 Market Segmentation by Type

    • 6.1 Market segments
      • Chart on Type - Market share 2023-2028 (%)
      • Data Table on Type - Market share 2023-2028 (%)
    • 6.2 Comparison by Type
      • Chart on Comparison by Type
      • Data Table on Comparison by Type
    • 6.3 Membrane - Market size and forecast 2023-2028
      • Chart on Membrane - Market size and forecast 2023-2028 ($ billion)
      • Data Table on Membrane - Market size and forecast 2023-2028 ($ billion)
      • Chart on Membrane - Year-over-year growth 2023-2028 (%)
      • Data Table on Membrane - Year-over-year growth 2023-2028 (%)
    • 6.4 Moss - Market size and forecast 2023-2028
      • Chart on Moss - Market size and forecast 2023-2028 ($ billion)
      • Data Table on Moss - Market size and forecast 2023-2028 ($ billion)
      • Chart on Moss - Year-over-year growth 2023-2028 (%)
      • Data Table on Moss - Year-over-year growth 2023-2028 (%)
    • 6.5 Market opportunity by Type
      • Market opportunity by Type ($ billion)
      • Data Table on Market opportunity by Type ($ billion)

    7 Customer Landscape

    • 7.1 Customer landscape overview
      • Analysis of price sensitivity, lifecycle, customer purchase basket, adoption rates, and purchase criteria

    8 Geographic Landscape

    • 8.1 Geographic segmentation
      • Chart on Market share by geography 2023-2028 (%)
      • Data Table on Market share by geography 2023-2028 (%)
    • 8.2 Geographic comparison
      • Chart on Geographic comparison
      • Data Table on Geographic comparison
    • 8.3 North America - Market size and forecast 2023-2028
      • Chart on North America - Market size and forecast 2023-2028 ($ billion)
      • Data Table on North America - Market size and forecast 2023-2028 ($ billion)
      • Chart on North America - Year-over-year growth 2023-2028 (%)
      • Data Table on North America - Year-over-year growth 2023-2028 (%)
    • 8.4 Middle East and Africa - Market size and forecast 2023-2028
      • Chart on Middle East and Africa - Market size and forecast 2023-2028 ($ billion)
      • Data Table on Middle East and Africa - Market size and forecast 2023-2028 ($ billion)
      • Chart on Middle East and Africa - Year-over-year growth 2023-2028 (%)
      • Data Table on Middle East and Africa - Year-over-year growth 2023-2028 (%)
    • 8.5 Europe - Market size and forecast 2023-2028
      • Chart on Europe - Market size and forecast 2023-2028 ($ billion)
      • Data Table on Europe - Market size and forecast 2023-2028 ($ billion)
      • Chart on Europe - Year-over-year growth 2023-2028 (%)
      • Data Table on Europe - Year-over-year growth 2023-2028 (%)
    • 8.6 APAC - Market size and forecast 2023-2028
      • Chart on APAC - Market size and forecast 2023-2028 ($ billion)
      • Data Table on APAC - Market size and forecast 2023-2028 ($ billion)
      • Chart on APAC - Year-over-year growth 2023-2028 (%)
      • Data Table on APAC - Year-over-year growth 2023-2028 (%)
    • 8.7 South America - Market size and forecast 2023-2028
      • Chart on South America - Market size and forecast 2023-2028 ($ billion)
      • Data Table on South America - Market size and forecast 2023-2028 ($ billion)
      • Chart on South America - Year-over-year growth 2023-2028 (%)
      • Data Table on South America - Year-over-year growth 2023-2028 (%)
    • 8.8 UK - Market size and forecast 2023-2028
      • Chart on UK - Market size and forecast 2023-2028 ($ billion)
      • Data Table on UK - Market size and forecast 2023-2028 ($ billion)
      • Chart on UK - Year-over-year growth 2023-2028 (%)
      • Data Table on UK - Year-over-year growth 2023-2028 (%)
    • 8.9 Japan - Market size and forecast 2023-2028
      • Chart on Japan - Market size and forecast 2023-2028 ($ billion)
      • Data Table on Japan - Market size and forecast 2023-2028 ($ billion)
      • Chart on Japan - Year-over-year growth 2023-2028 (%)
      • Data Table on Japan - Year-over-year growth 2023-2028 (%)
    • 8.10 Qatar - Market size and forecast 2023-2028
      • Chart on Qatar - Market size and forecast 2023-2028 ($ billion)
      • Data Table on Qatar - Market size and forecast 2023-2028 ($ billion)
      • Chart on Qatar - Year-over-year growth 2023-2028 (%)
      • Data Table on Qatar - Year-over-year growth 2023-2028 (%)
    • 8.11 Greece - Market size and forecast 2023-2028
      • Chart on Greece - Market size and forecast 2023-2028 ($ billion)
      • Data Table on Greece - Market size and forecast 2023-2028 ($ billion)
      • Chart on Greece - Year-over-year growth 2023-2028 (%)
      • Data Table on Greece - Year-over-year growth 2023-2028 (%)
    • 8.12 Malaysia - Market size and forecast 2023-2028
      • Chart on Malaysia - Market size and forecast 2023-2028 ($ billion)
      • Data Table on Malaysia - Market size and forecast 2023-2028 ($ billion)
      • Chart on Malaysia - Year-over-year growth 2023-2028 (%)
      • Data Table on Malaysia - Year-over-year growth 2023-2028 (%)
    • 8.13 Market opportunity by geography
      • Market opportunity by geography ($ billion)
      • Data Tables on Market opportunity by geography ($ billion)

    9 Drivers, Challenges, and Opportunity/Restraints

    • 9.1 Market drivers
      • 9.2 Market challenges
        • 9.3 Impact of drivers and challenges
          • Impact of drivers and challenges in 2023 and 2028
        • 9.4 Market opportunities/restraints

          10 Competitive Landscape

          • 10.1 Overview
            • 10.2 Competitive Landscape
              • Overview on criticality of inputs and factors of differentiation
            • 10.3 Landscape disruption
              • Overview on factors of disruption
            • 10.4 Industry risks
              • Impact of key risks on business

            11 Competitive Analysis

            • 11.1 Companies profiled
              • Companies covered
            • 11.2 Market positioning of companies
              • Matrix on companies position and classification
            • 11.3 BW Group
              • BW Group - Overview
              • BW Group - Product / Service
              • BW Group - Key offerings
            • 11.4 Flex LNG Ltd.
              • Flex LNG Ltd. - Overview
              • Flex LNG Ltd. - Product / Service
              • Flex LNG Ltd. - Key offerings
            • 11.5 GasLog Ltd.
              • GasLog Ltd. - Overview
              • GasLog Ltd. - Product / Service
              • GasLog Ltd. - Key offerings
            • 11.6 Gaztransport and Technigaz SA
              • Gaztransport and Technigaz SA - Overview
              • Gaztransport and Technigaz SA - Business segments
              • Gaztransport and Technigaz SA - Key news
              • Gaztransport and Technigaz SA - Key offerings
              • Gaztransport and Technigaz SA - Segment focus
            • 11.7 Hanwha Corp.
              • Hanwha Corp. - Overview
              • Hanwha Corp. - Product / Service
              • Hanwha Corp. - Key news
              • Hanwha Corp. - Key offerings
            • 11.8 Kawasaki Heavy Industries Ltd.
              • Kawasaki Heavy Industries Ltd. - Overview
              • Kawasaki Heavy Industries Ltd. - Business segments
              • Kawasaki Heavy Industries Ltd. - Key news
              • Kawasaki Heavy Industries Ltd. - Key offerings
              • Kawasaki Heavy Industries Ltd. - Segment focus
            • 11.9 Mitsubishi Heavy Industries Ltd.
              • Mitsubishi Heavy Industries Ltd. - Overview
              • Mitsubishi Heavy Industries Ltd. - Business segments
              • Mitsubishi Heavy Industries Ltd. - Key news
              • Mitsubishi Heavy Industries Ltd. - Key offerings
              • Mitsubishi Heavy Industries Ltd. - Segment focus
            • 11.10 Nakilat
              • Nakilat - Overview
              • Nakilat - Product / Service
              • Nakilat - Key offerings
            • 11.11 Samsung Heavy Industries Co. Ltd.
              • Samsung Heavy Industries Co. Ltd. - Overview
              • Samsung Heavy Industries Co. Ltd. - Product / Service
              • Samsung Heavy Industries Co. Ltd. - Key offerings
            • 11.12 Teekay LNG Partners L.P
              • Teekay LNG Partners L.P - Overview
              • Teekay LNG Partners L.P - Product / Service
              • Teekay LNG Partners L.P - Key offerings

            12 Appendix

            • 12.1 Scope of the report
              • 12.2 Inclusions and exclusions checklist
                • Inclusions checklist
                • Exclusions checklist
              • 12.3 Currency conversion rates for US$
                • Currency conversion rates for US$
              • 12.4 Research methodology
                • Research methodology
              • 12.5 Data procurement
                • Information sources
              • 12.6 Data validation
                • Data validation
              • 12.7 Validation techniques employed for market sizing
                • Validation techniques employed for market sizing
              • 12.8 Data synthesis
                • Data synthesis
              • 12.9 360 degree market analysis
                • 360 degree market analysis
              • 12.10 List of abbreviations
                • List of abbreviations

              Research Methodology

              Technavio presents a detailed picture of the market by way of study, synthesis, and summation of data from multiple sources. The analysts have presented the various facets of the market with a particular focus on identifying the key industry influencers. The data thus presented is comprehensive, reliable, and the result of extensive research, both primary and secondary.

              INFORMATION SOURCES

              Primary sources

              • Manufacturers and suppliers
              • Channel partners
              • Industry experts
              • Strategic decision makers

              Secondary sources

              • Industry journals and periodicals
              • Government data
              • Financial reports of key industry players
              • Historical data
              • Press releases

              DATA ANALYSIS

              Data Synthesis

              • Collation of data
              • Estimation of key figures
              • Analysis of derived insights

              Data Validation

              • Triangulation with data models
              • Reference against proprietary databases
              • Corroboration with industry experts

              REPORT WRITING

              Qualitative

              • Market drivers
              • Market challenges
              • Market trends
              • Five forces analysis

              Quantitative

              • Market size and forecast
              • Market segmentation
              • Geographical insights
              • Competitive landscape

              Interested in this report?

              Get your sample now to see our research methodology and insights!

              Download Now

              Frequently Asked Questions

              Lng Carriers market growth will increase by $ 3600 bn during 2024-2028 .

              The Lng Carriers market is expected to grow at a CAGR of 4.62% during 2024-2028 .

              Lng Carriers market is segmented by Type( Membrane, Moss)

              BW Group, Dynagas Ltd., Flex LNG Ltd., GasLog Ltd., Gaztransport and Technigaz SA, Golar LNG Ltd., Hanwha Corp., Japan Marine United Corp., K Shipbuilding, Kawasaki Heavy Industries Ltd., Maran Gas Maritime Inc., Mitsubishi Heavy Industries Ltd., Mitsui and Co. Ltd., Nakilat, PETRONAS Chemicals Group Berhad, Samsung Heavy Industries Co. Ltd., Shell plc, Teekay LNG Partners L.P, Wartsila Corp. are a few of the key vendors in the Lng Carriers market.

              Europe will register the highest growth rate of 27% among the other regions. Therefore, the Lng Carriers market in Europe is expected to garner significant business opportunities for the vendors during the forecast period.

              UK, Japan, Qatar, Greece, Malaysia

              • Increase in demand for natural gasAccording to the IEA is the driving factor this market.
              • the global demand for natural gas is expected to increase from 3 is the driving factor this market.
              • 740 billion cubic meters (bcm) in 2017 to 4 is the driving factor this market.
              • 100 bcm in 2023 is the driving factor this market.
              • with an average growth rate of 1.6% each year. Most of this demand will be from emerging economies like China is the driving factor this market.
              • which would account for 37% of the increase in the global demand for natural gas during the forecast period. Globally is the driving factor this market.
              • China is expected to become the largest importer of natural gas by 2019. According to the IEA is the driving factor this market.
              • the demand for natural gas in China will increase by 60% between 2017 and 2023 is the driving factor this market.
              • which is primarily driven by policies to reduce air pollution by substituting coal with gas. Similarly is the driving factor this market.
              • other countries in South and Southeast Asia will experience an increase in demand for natural gas due to their economic growth and efforts to improve the quality of air. Globally is the driving factor this market.
              • the industry and power sector are some of the major end-users that contributed to the increase in the consumption of natural gas. Natural gas is used in industrial processes and as feedstock for chemicals. The demand for natural gas is driven by industries like the fertilizer sector and feedstock for petrochemicals. According to the IEA is the driving factor this market.
              • the demand for natural gas by industry is expected to increase from 97 bcm during 2011-2017 to 157 bcm during 2017-2023. Moreover is the driving factor this market.
              • the transportation sector is another major factor that is driving the demand for natural gas. Globally is the driving factor this market.
              • the transportation sector forms one of the major sources of air pollution due to the emissions released by the air is the driving factor this market.
              • road is the driving factor this market.
              • and water transport vehicles that significantly add to the amount of GHGs in the atmosphere is the driving factor this market.
              • thereby resulting in climate change and degradation of air quality. Hence is the driving factor this market.
              • the decarbonization of the transportation sector drives the demand for natural gas. For instance is the driving factor this market.
              • the Gas4India campaign was launched in 2016 in India by the government with the objective of transforming the country into a gas-based economy. As a result is the driving factor this market.
              • the government of India is increasing the coverage of the City Gas Distribution (CGD) network in the country. Also is the driving factor this market.
              • guidelines are issued to ensure the availability of domestic natural gas to the CGD entities to meet the demand for natural gas in various transportation segments. LNG is gaining popularity over CNG due to its energy density. LNG ensures traveling long distances and enables increased storage of natural gas in fuel tanks is the driving factor this market.
              • which is an advantage for vehicles with increased horsepower. As a result is the driving factor this market.
              • in 2013 is the driving factor this market.
              • a project called LNG Blue Corridors was launched in Europe to establish a network of LNG fuel stations. Hence is the driving factor this market.
              • more than 100 LNG stations were operational by mid-2017. Some European countries like the Netherlands is the driving factor this market.
              • Spain is the driving factor this market.
              • and Italy are pro-actively building their local LNG infrastructure. Hence is the driving factor this market.
              • the popularity of natural gas in the industrial and transportation sector is likely to boost the demand for natural gas in the world is the driving factor this market.
              • which will increase the need for transporting natural gas. Since transportation of natural gas in the form of LNG is efficient and common is the driving factor this market.
              • it will positively boost the growth of the global LNG carriers market during the forecast period. is the driving factor this market.

              The Lng Carriers market vendors should focus on grabbing business opportunities from the Membrane segment as it accounted for the largest market share in the base year.