LNG Infrastructure Market Size 2024-2028
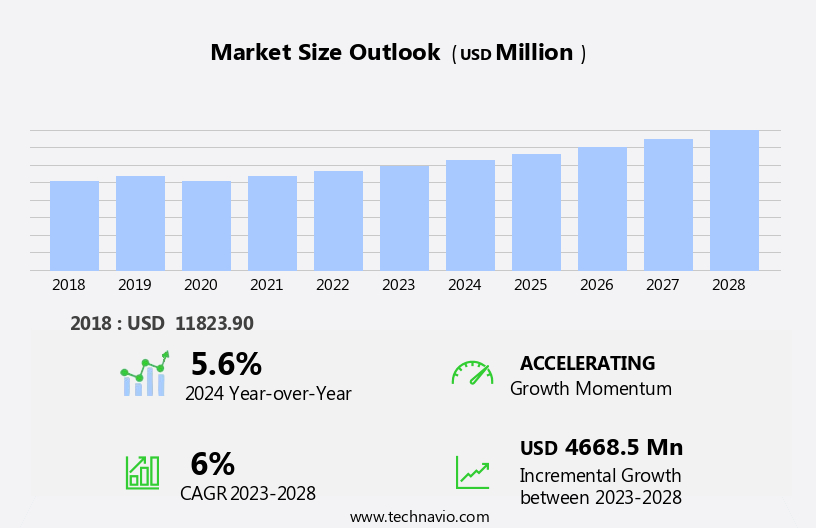
The lng infrastructure market size is forecast to increase by USD 4.67 billion, at a CAGR of 6% between 2023 and 2028.
- The market is experiencing significant growth, driven primarily by the increasing demand for cleaner fuels and the expanding need for LNG bunkering. This shift towards cleaner energy sources is a global trend, with numerous industries and countries recognizing the environmental benefits of natural gas over traditional fossil fuels. Additionally, the market is influenced by the volatility of global oil and gas prices, which can impact the profitability of LNG projects and the competitiveness of natural gas as a fuel source. Despite these opportunities, challenges persist. One major obstacle is the high capital intensity of LNG infrastructure projects, which can deter potential investors and limit the market's growth rate.
- Another challenge is the complex and evolving regulatory landscape, which can create uncertainty and hinder the expansion of the market. Companies seeking to capitalize on the opportunities in the market must navigate these challenges effectively, focusing on cost efficiency, regulatory compliance, and strategic partnerships to remain competitive.
What will be the Size of the LNG Infrastructure Market during the forecast period?
Explore in-depth regional segment analysis with market size data - historical 2018-2022 and forecasts 2024-2028 - in the full report.
Request Free Sample
The market continues to evolve, driven by the increasing demand for cleaner energy sources and the need for reliable energy supply in various sectors. Small-scale LNG solutions, such as peak shaving facilities, are gaining traction as they offer flexibility in meeting energy demands during peak hours. Cryogenic pipeline systems and LNG import terminals are essential components of the LNG infrastructure, ensuring the efficient delivery of LNG to consumers. LNG infrastructure investment remains a priority, with ongoing efforts to optimize the liquefaction process and improve safety regulations. Vaporization efficiency and methane emissions reduction are key focus areas, with advancements in vaporization technologies and gas turbine efficiency leading to significant improvements.
LNG bunkering infrastructure and distribution networks are expanding, enabling the use of LNG as a fuel in various industries. Despite the challenges posed by LNG transportation costs and price volatility, the industry is expected to grow at a robust rate. Regasification plant capacity is increasing, with regasification efficiency and process control becoming critical factors in ensuring optimal performance. Export terminals and cryogenic pump technology are essential for the efficient handling and transportation of LNG. LNG metering systems and quality control are crucial for maintaining the integrity of the LNG supply chain. Regasification plants and liquefaction plants are undergoing capacity expansions to meet the growing demand for LNG.
Pipeline integrity management and regasification efficiency are also key considerations for LNG infrastructure providers. For instance, a leading energy company reported a 15% increase in LNG sales due to the optimization of its regasification plant capacity and efficiency. The global LNG market is projected to grow by over 5% annually, driven by the increasing demand for cleaner energy sources and the expansion of LNG infrastructure.
How is this LNG Infrastructure Industry segmented?
The lng infrastructure industry research report provides comprehensive data (region-wise segment analysis), with forecasts and estimates in "USD million" for the period 2024-2028, as well as historical data from 2018-2022 for the following segments.
- Type
- Liquefaction terminal
- Regasification terminal
- Geography
- North America
- US
- Canada
- Europe
- Germany
- Russia
- APAC
- China
- India
- Japan
- South America
- Brazil
- Rest of World (ROW)
- North America
By Type Insights
The liquefaction terminal segment is estimated to witness significant growth during the forecast period.
LNG infrastructure is a critical component of the global energy market, encompassing various elements from production to distribution. Small-scale LNG solutions and peak shaving facilities are gaining traction as businesses seek flexible and efficient energy options. Cryogenic pipeline systems transport LNG through insulated pipes, maintaining low temperatures to prevent vaporization. LNG import terminals serve as key hubs for LNG transportation, with regasification plants converting the liquefied gas back into its gaseous state. Liquefaction process optimization and infrastructure investment are essential for enhancing efficiency and reducing methane emissions. Safety regulations ensure secure handling and transportation of LNG, while vaporization technologies and gas turbine efficiency improve energy utilization.
LNG bunkering infrastructure is expanding to facilitate the use of LNG as a marine fuel. Environmental impact assessments and distribution networks are crucial for minimizing the environmental footprint of LNG. Price volatility is a significant challenge, with regasification plant capacity and export terminals influencing supply and demand dynamics. Cryogenic pump technology and metering systems ensure accurate LNG measurement, while quality control and storage technologies maintain the integrity of the gas. Pipeline integrity management and regasification efficiency are vital for optimizing operations, with regasification process control and peak demand management ensuring efficient energy delivery. LNG carrier scheduling and truck transportation are essential for seamless LNG transportation, with increasing demand driving the need for advanced logistical solutions.
According to recent industry reports, the global LNG market is projected to grow by over 5% annually, driven by the increasing adoption of cleaner fuels and expanding energy demands. For instance, a major European utility company reported a 20% increase in LNG sales in the last fiscal year, highlighting the market's growing significance.
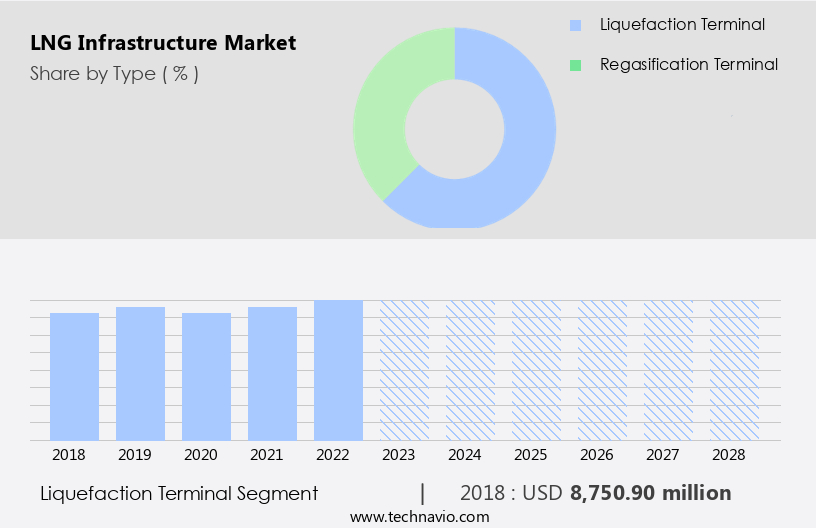
The Liquefaction terminal segment was valued at USD 8.75 billion in 2018 and showed a gradual increase during the forecast period.
Regional Analysis
North America is estimated to contribute 42% to the growth of the global market during the forecast period. Technavio's analysts have elaborately explained the regional trends and drivers that shape the market during the forecast period.
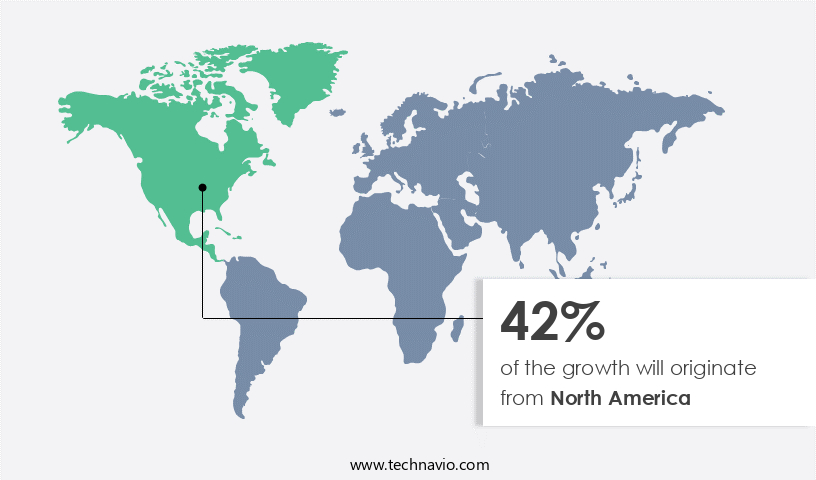
The US market is experiencing significant growth due to the shift from coal to gas in the power generation sector and competitive natural gas prices for industrial applications. The shale revolution in the US, with the Marcellus and Utica shale basins undergoing continuous developments, has made the country a major contributor to global natural gas output. LNG infrastructure investments include small-scale solutions, peak shaving facilities, and cryogenic pipeline systems, which optimize liquefaction processes and improve vaporization efficiency. Safety regulations ensure the safe handling and transportation of LNG, while methane emissions reduction technologies minimize environmental impact. LNG fuel infrastructure, including regasification plants and storage technologies, enables efficient gas turbine operation and peak demand management.
The industry is expected to grow by over 5% annually, with LNG export terminals and cryogenic pump technology playing crucial roles in the market. Regasification plant capacity expansions and regasification process control advancements enhance overall efficiency. LNG carrier scheduling and truck transportation ensure reliable distribution networks, mitigating price volatility. Environmental impact assessments and pipeline integrity management are essential considerations for the industry's sustainable growth.
Market Dynamics
Our researchers analyzed the data with 2023 as the base year, along with the key drivers, trends, and challenges. A holistic analysis of drivers will help companies refine their marketing strategies to gain a competitive advantage.
The market is experiencing significant growth as the world transitions to cleaner energy sources. Optimization of LNG regasification plant designs is a key focus area, with cryogenic pipeline integrity monitoring systems ensuring safe and efficient operations. Boil-off gas recovery and utilization, as well as efficient LNG vaporization system designs, are essential for minimizing operational costs. LNG terminal automation and control systems, coupled with LNG supply chain risk management strategies, enable seamless operations and reduce the impact of supply disruptions. Small-scale LNG liquefaction plant technologies offer flexibility in meeting diverse energy demands, while LNG storage tank thermal insulation optimization ensures minimal energy loss and maximum capacity utilization. Bunkering infrastructure development strategies and LNG carrier scheduling and optimization algorithms are crucial for efficient LNG transportation. LNG facility safety and environmental compliance, methane emissions monitoring and reduction technologies, and LNG pipeline construction and maintenance best practices are essential for ensuring sustainability and minimizing environmental impact. The market's economic analysis and investment considerations are critical in ensuring the viability of LNG as a competitive energy source. LNG transportation cost reduction strategies, LNG distribution network planning and management, and optimization of LNG liquefaction plant operations are all essential components of a successful LNG business model. Moreover, the development of LNG infrastructure plays a significant role in enhancing energy security by diversifying energy sources and reducing dependence on traditional fossil fuels. As the market continues to evolve, it is essential to stay abreast of the latest advancements and best practices to maximize returns and minimize risks.
What are the key market drivers leading to the rise in the adoption of LNG Infrastructure Industry?
- The surge in consumer preference for cleaner fuel sources is the primary market catalyst.
- The global energy landscape is undergoing significant shifts as the world population is projected to reach 10 billion by 2050, leading to a 30% increase in energy demand by 2040, according to the International Energy Agency (IEA). Traditional energy sources like oil and coal have dominated the energy mix, contributing to a substantial rise in carbon dioxide (CO2) and other greenhouse gas emissions. In 2023, global energy-related CO2 emissions grew by 1%. To mitigate the environmental impact, there is a growing emphasis on cleaner energy sources, leading to a surge in the market. For instance, the use of LNG as a marine fuel has increased by 35% in 2020 compared to the previous year.
- The IEA anticipates that LNG will account for 15% of the global gas demand by 2025. This trend signifies a promising future for the market, offering a viable solution to meet the increasing energy demand while reducing carbon emissions.
What are the market trends shaping the LNG Infrastructure Industry?
- The growing demand for liquefied natural gas (LNG) bunkering represents an emerging market trend. LNG bunkering, or the supply of LNG as fuel to ships, is gaining increasing importance in the maritime industry.
- The market is witnessing significant growth due to the increasing demand for environmentally sustainable marine fuels. LNG bunkering, the practice of providing LNG fuel to ships, is gaining popularity as a solution to reduce emissions from shipping activities. According to the International Energy Agency (IEA), heavy fuel oil (HFO) accounted for 79% of the fuel mix in marine bunkers in 2020. However, the International Maritime Organization (IMO) has proposed a regulation that would limit the sulfur content in marine fuel to 0%, which is expected to drive the adoption of LNG as a marine fuel. In 2020, the LNG bunkering market was estimated to be worth a significant percentage of the global energy market.
- Looking forward, the market is projected to grow at a robust rate, with LNG expected to capture a larger share of the marine fuel market in the coming years. The increasing number of LNG bunkering facilities being developed at ports worldwide is further fueling the market growth.
What challenges does the LNG Infrastructure Industry face during its growth?
- The volatile nature of global oil and gas prices poses a significant challenge to the industry's growth trajectory.
- The market has experienced significant volatility due to fluctuations in crude oil prices since 2014. For instance, Japan, a major importer of oil, saw a crude oil import cost of USD 104.16 per barrel in 2014. However, the price dropped to USD 54.42 per barrel in 2017 before rising to USD 76.49 per barrel in September 2018. More recently, prices reached USD 69.08/barrel in May 2021, only to increase further to USD 74/barrel in December 2021. These price reductions have negatively impacted the profit margins of companies in the upstream oil and gas sector, making it challenging to attract substantial investments.
- As a result, the industry has missed out on significant market potential. According to the International Energy Agency, the LNG market is expected to grow by over 5% per year between 2022 and 2026.
Exclusive Customer Landscape
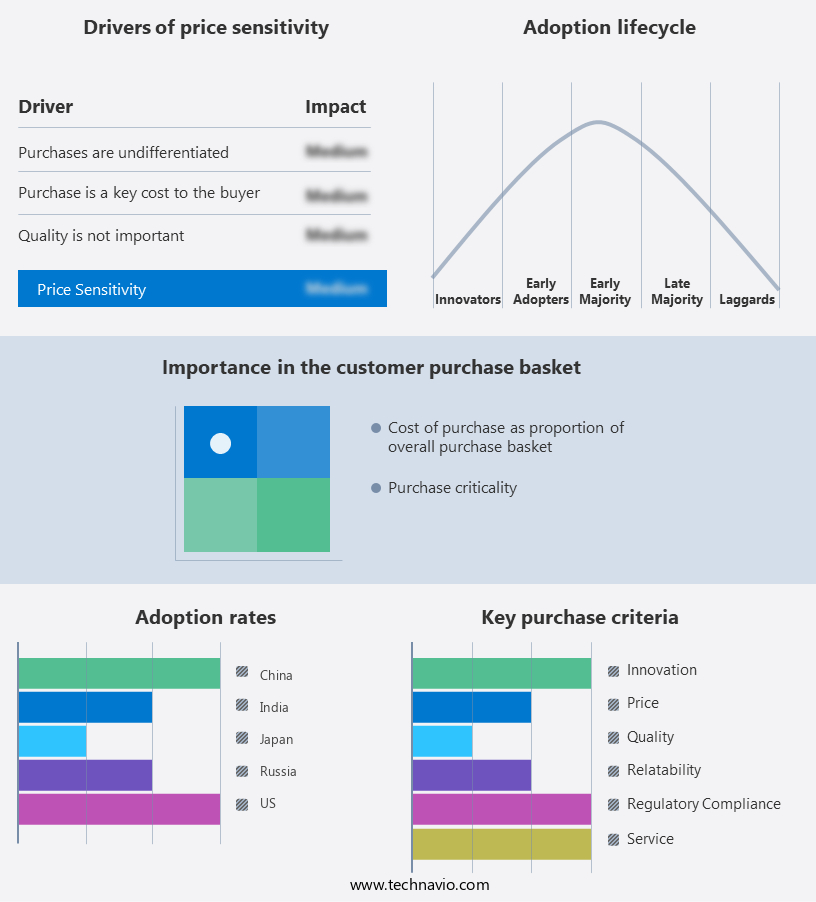
The LNG infrastructure market forecasting report includes the adoption lifecycle of the market, covering from the innovator's stage to the laggard's stage. It focuses on adoption rates in different regions based on penetration. Furthermore, the LNG infrastructure market report also includes key purchase criteria and drivers of price sensitivity to help companies evaluate and develop their market growth analysis strategies.
Customer Landscape
Key Companies & Market Insights
Companies are implementing various strategies, such as strategic alliances, lng infrastructure market forecast, partnerships, mergers and acquisitions, geographical expansion, and product/service launches, to enhance their presence in the industry.
Bechtel Corp. - Bechtel Corporation is a leading global provider of integrated LNG infrastructure solutions.
The industry research and growth report includes detailed analyses of the competitive landscape of the market and information about key companies, including:
- Bechtel Corp.
- Cheniere Energy Inc.
- Chevron Corp.
- Chiyoda Corp.
- Exxon Mobil Corp.
- Fluor Corp.
- Gazprom Nedra LLC
- INPEX Corp.
- JGC Holdings Corp.
- John Wood Group PLC
- McDermott International Ltd.
- NextDecade Corp.
- Occidental Petroleum Corp.
- PAO NOVATEK
- PETRONAS Chemicals Group Berhad
- Shell plc
- Saipem S.p.A.
- Sempra Energy
- Steelhead LNG Corp.
Qualitative and quantitative analysis of companies has been conducted to help clients understand the wider business environment as well as the strengths and weaknesses of key industry players. Data is qualitatively analyzed to categorize companies as pure play, category-focused, industry-focused, and diversified; it is quantitatively analyzed to categorize companies as dominant, leading, strong, tentative, and weak.
Recent Development and News in LNG Infrastructure Market
- In January 2024, Shell and Qatar Petroleum announced a strategic partnership to develop a new LNG liquefaction train in Qatar, expanding the Ras Laffan Industrial City's production capacity by 6.4 million metric tons per annum (mtpa) (Shell press release, 2024).
- In March 2024, Tellurian Inc. secured a significant investment of USD 1.5 billion from TotalEnergies to support the development of its Driftwood LNG project in Louisiana, USA (TotalEnergies press release, 2024).
- In May 2024, the European Commission approved the Nord Stream 2 pipeline project, allowing the construction of the 1,222-kilometer pipeline from Russia to Germany to proceed (European Commission press release, 2024).
- In April 2025, Siemens Energy and Baker Hughes announced a collaboration to develop a new, more efficient LNG liquefaction technology, combining Siemens Energy's expertise in power generation and Baker Hughes' experience in gas processing (Siemens Energy press release, 2025).
Research Analyst Overview
- The market continues to evolve, with ongoing activities shaping its landscape. LNG facility automation and terminal automation are increasingly prioritized to enhance efficiency and reduce operational costs. Environmental regulations compliance is a significant focus, driving the adoption of risk assessment methodologies and methane slip reduction technologies. LNG transportation optimization and pipeline integrity are essential aspects of infrastructure development, with safety protocols and pipeline construction adhering to stringent standards. One example of market dynamics at play is the implementation of advanced regasification unit design and LNG custody transfer technologies, resulting in a 10% increase in regasification capacity for a major European terminal.
- Industry growth is expected to reach 5% annually, with a strong emphasis on energy efficiency improvements, LNG infrastructure planning, and terminal expansion. Additionally, ongoing efforts in LNG pipeline construction, infrastructure maintenance, and upgrades prioritize pipeline safety standards and LNG distribution management. Cryogenic equipment maintenance and LNG infrastructure upgrades are crucial for ensuring optimal LNG storage and capacity expansion.
Dive into Technavio's robust research methodology, blending expert interviews, extensive data synthesis, and validated models for unparalleled LNG Infrastructure Market insights. See full methodology.
|
Market Scope |
|
|
Report Coverage |
Details |
|
Page number |
162 |
|
Base year |
2023 |
|
Historic period |
2018-2022 |
|
Forecast period |
2024-2028 |
|
Growth momentum & CAGR |
Accelerate at a CAGR of 6% |
|
Market growth 2024-2028 |
USD 4668.5 million |
|
Market structure |
Fragmented |
|
YoY growth 2023-2024(%) |
5.6 |
|
Key countries |
US, China, Japan, India, Russia, Canada, Germany, United Arab Emirates, Saudi Arabia, and Brazil |
|
Competitive landscape |
Leading Companies, Market Positioning of Companies, Competitive Strategies, and Industry Risks |
What are the Key Data Covered in this LNG Infrastructure Market Research and Growth Report?
- CAGR of the LNG Infrastructure industry during the forecast period
- Detailed information on factors that will drive the growth and forecasting between 2024 and 2028
- Precise estimation of the size of the market and its contribution of the industry in focus to the parent market
- Accurate predictions about upcoming growth and trends and changes in consumer behaviour
- Growth of the market across North America, APAC, Europe, Middle East and Africa, and South America
- Thorough analysis of the market's competitive landscape and detailed information about companies
- Comprehensive analysis of factors that will challenge the lng infrastructure market growth of industry companies
We can help! Our analysts can customize this lng infrastructure market research report to meet your requirements.
 RIA -
RIA - 
