Liquefied Natural Gas (LNG) Bunkering Market Analysis, Size, and Forecast 2025-2029: North America (US), Europe (Denmark, France, Germany, Norway, The Netherlands, and UK), APAC (China, Japan, and Singapore), and Rest of World (ROW)

Liquefied Natural Gas (LNG) Bunkering Market Analysis, Size, and Forecast 2025-2029:
North America (US), Europe (Denmark, France, Germany, Norway, The Netherlands, and UK), APAC (China, Japan, and Singapore), and Rest of World (ROW)

Published: May 2025 221 Pages SKU: IRTNTR72440

Market Overview at a Glance

$1.59 B
Market Opportunity
21.9%
CAGR
18.6
YoY growth 2024-2025(%)

Liquefied Natural Gas (LNG) Bunkering Market Size 2025-2029

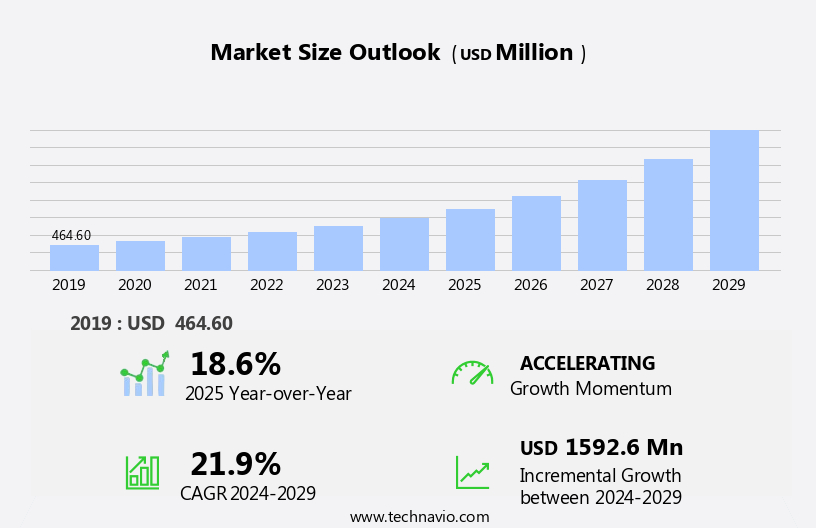
The liquefied natural gas (lng) bunkering market size is forecast to increase by USD 1.59 billion, at a CAGR of 21.9% between 2024 and 2029.

  • The market is experiencing significant growth, driven by the increasing supply of LNG and the rising demand for cleaner fuels in the maritime industry. The abundance of natural gas resources and advancements in liquefaction and transportation technologies have led to a surge in LNG production, making it a viable alternative to traditional heavy fuel oil and marine diesel. However, the high capital requirements for using LNG as a marine fuel pose a significant challenge for market participants. The infrastructure investments needed for LNG bunkering, including the construction of LNG terminals, the acquisition of specialized LNG bunker vessels, and the development of onboard LNG fuel storage and handling systems, can be substantial.
  • Companies seeking to capitalize on the opportunities presented by the growing LNG bunkering market must carefully consider these financial considerations and develop strategies to mitigate the associated risks. Additionally, the complexities of handling and transporting LNG, including the need for specialized equipment and training, add to the challenges faced by market players. Navigating these obstacles will be crucial for companies looking to effectively serve the expanding LNG bunkering market and meet the growing demand for cleaner, more sustainable fuel solutions in the maritime industry.

What will be the Size of the Liquefied Natural Gas (LNG) Bunkering Market during the forecast period?

Liquefied Natural Gas (LNG) Bunkering Market Size

Explore in-depth regional segment analysis with market size data - historical 2019-2023 and forecasts 2025-2029 - in the full report.  
Request Free Sample

The market continues to evolve, driven by the expanding use of LNG as a cleaner alternative fuel in various sectors. Cost optimization and operational efficiency are key priorities for market participants, leading to the adoption of advanced technologies such as automation in regasification processes and predictive maintenance systems for equipment. For instance, a leading LNG carrier vessel operator reported a 10% increase in fuel efficiency gains by implementing remote monitoring and automation technologies for its cryogenic storage tanks. Furthermore, port infrastructure development and safety protocols are essential for ensuring regulatory compliance and efficient bunkering logistics. Emission reduction is another critical factor shaping the market.

Methane emissions from LNG value chains must be minimized to meet International Maritime Organization (IMO) standards. This has led to the development of advanced fuel transfer systems, leak detection systems, and vaporization systems to optimize the bunkering process. The market's continuous dynamism is also reflected in the evolving bunkering methods, including ship-to-ship, truck-to-ship, and barge-to-ship transfers. The industry is expected to grow at a robust rate, with analysts projecting a 15% increase in LNG demand for bunkering by 2025. Despite these opportunities, challenges remain, including the need for safety protocols during emergency shutdown systems and the environmental impact of LNG bunkering infrastructure.

Fuel quality control and temperature monitoring are also crucial for ensuring the safe and efficient transfer of LNG. The LNG bunkering market is a continuously evolving landscape, shaped by factors such as cost optimization, operational efficiency, regulatory compliance, and emission reduction. The market's dynamism is reflected in the ongoing development of advanced technologies, bunkering methods, and infrastructure.

How is this Liquefied Natural Gas (LNG) Bunkering Industry segmented?

The liquefied natural gas (lng) bunkering industry research report provides comprehensive data (region-wise segment analysis), with forecasts and estimates in "USD million" for the period 2025-2029, as well as historical data from 2019-2023 for the following segments.

  • Application
    • Tanker
    • Ferry and ro-ro
    • Container
    • Others
  • End-user
    • Commercial
    • Defense
  • Product Type
    • Ship-to-ship
    • Port-to-ship
    • Truck-to-ship
    • Portable tanks
  • Geography
    • North America
      • US
    • Europe
      • Denmark
      • France
      • Germany
      • Norway
      • The Netherlands
      • UK
    • APAC
      • China
      • Japan
      • Singapore
    • Rest of World (ROW)

By Application Insights

The tanker segment is estimated to witness significant growth during the forecast period.

The LNG bunkering market is witnessing significant growth due to the increasing adoption of LNG as a marine fuel, particularly in the segment of oil and chemical tankers. With the capacity to carry various gases, including LNG and LPG, this segment presents a substantial opportunity for the implementation of LNG as a marine fuel. In the North Sea, for instance, shuttle tankers are commonly used to transport crude oil from offshore facilities to shoreside refineries, creating a demand for LNG as a more sustainable and efficient alternative. New vessels in this segment, such as Aframax and Suezmax oil tankers, with over 100,000 deadweight tonnage (DWT,) have emerged in the past year.

Furthermore, the construction of 114,000 DWT ice-class 1A tankers is underway, enabling year-round operation in the Baltic Sea and Northern Europe for transporting crude oil and petroleum products. This development is expected to boost the LNG bunkering market, as these vessels are designed for efficient LNG consumption. Operational efficiency is a crucial factor driving the market, with predictive maintenance and automation technologies playing a significant role. Regasification processes, fuel transfer systems, and remote monitoring are essential components of this efficiency-driven approach. Safety protocols and regulatory compliance are also essential, with methane emissions and leak detection systems being critical areas of focus.

Cost optimization is another significant trend, with bunkering logistics and cargo handling systems being optimized to minimize fuel consumption and ensure fuel quality control. The IMO's stringent emission reduction standards further emphasize the importance of fuel efficiency gains. The LNG bunkering infrastructure is evolving to accommodate these demands, with ship-to-ship and truck-to-ship transfer methods gaining popularity for their cost-effectiveness and convenience. According to recent industry reports, the LNG bunkering market is projected to grow by over 15% annually, as the maritime industry shifts towards cleaner, more efficient fuel sources. This growth is attributed to the increasing number of LNG carrier vessels, the expansion of LNG bunkering infrastructure, and the growing demand for LNG as a marine fuel.

The integration of advanced technologies, such as cryogenic storage tanks, temperature monitoring, and pressure relief valves, is further enhancing the market's potential.

Liquefied Natural Gas (LNG) Bunkering Market Size

Request Free Sample

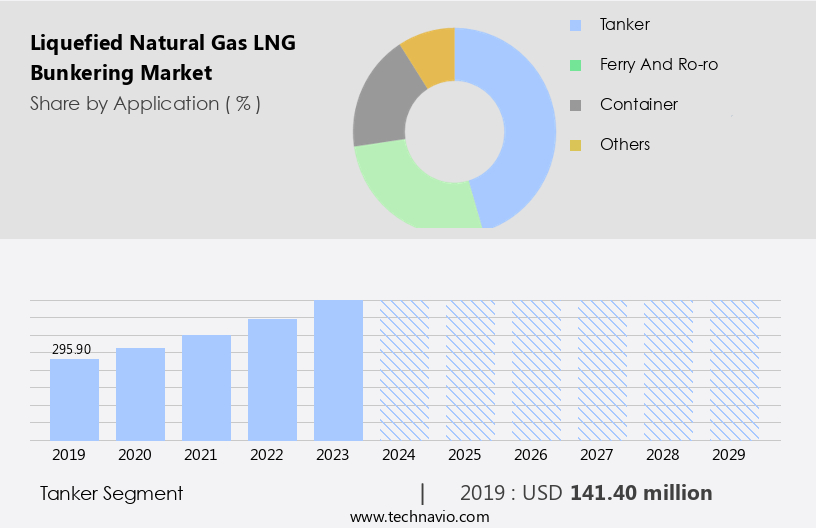
The Tanker segment was valued at USD 141.40 billion in 2019 and showed a gradual increase during the forecast period.

Regional Analysis

Europe is estimated to contribute 60% to the growth of the global market during the forecast period.Technavio's analysts have elaborately explained the regional trends and drivers that shape the market during the forecast period.

Liquefied Natural Gas (LNG) Bunkering Market Share by Geography

 Request Free Sample

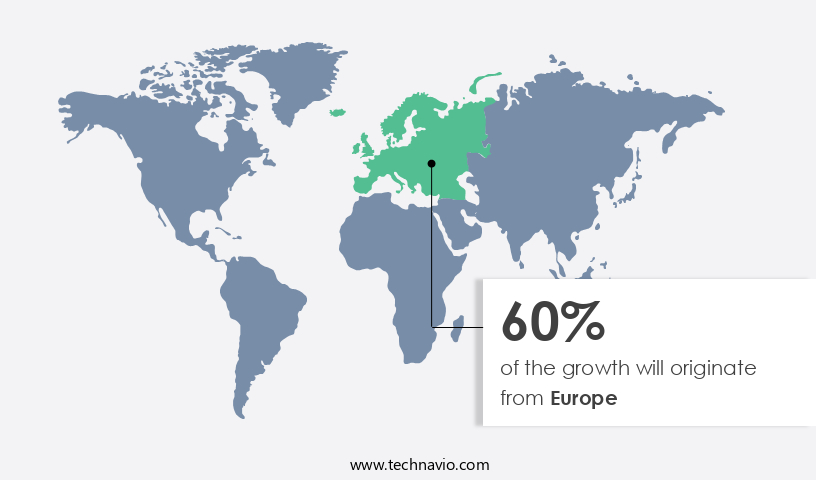
The European LNG bunkering market is currently the largest segment, driven by the significant production of LNG in the region. According to the International Energy Agency (IEA), Russia, as the world's second-largest natural gas producer, has underutilized production capacity in the Yamal Peninsula. Seeking to diversify its natural gas export outlets, Russia is planning a pipeline to China, contributing approximately 15 bcm to the global liquefaction capacity of 140 bcm by 2024's end. In Norway, Hammerfest, also known as Polarbase, is the largest LNG bunkering facility. Cost optimization and operational efficiency are crucial factors in the LNG bunkering market.

Regasification processes and fuel transfer systems require predictive maintenance to ensure safety protocols and regulatory compliance. Methane emissions are a concern, with emission reduction technologies and leak detection systems essential for environmental impact mitigation. Automation technologies, such as remote monitoring and temperature monitoring, play a significant role in improving fuel quality control and operational efficiency. Ship-to-ship and truck-to-ship transfers, as well as barge-to-ship transfers, require advanced bunkering logistics and cargo handling systems. Pressure relief valves and vaporization systems are essential safety features in LNG bunkering infrastructure. The IMO (International Maritime Organization) sets standards for LNG bunkering, ensuring fuel efficiency gains and safety.

The LNG bunkering market is expected to grow by over 10% annually, as the demand for cleaner maritime transport increases. For instance, a leading shipping company reported a 20% increase in fuel savings by switching to LNG bunkering.

Market Dynamics

Our researchers analyzed the data with 2024 as the base year, along with the key drivers, trends, and challenges. A holistic analysis of drivers will help companies refine their marketing strategies to gain a competitive advantage.

The global LNG bunkering market is experiencing significant growth as more maritime industries shift towards cleaner fuel alternatives. LNG bunkering vessel design considerations are crucial for efficient and safe operations, including cryogenic tank insulation technologies to minimize boil-off loss and optimize regasification processes. Safety features in LNG fuel transfer systems are essential, with ship-to-ship and shore-to-ship bunkering each presenting unique operational challenges.

LNG boil-off gas recovery and utilization methods are essential for cost-effective bunkering, while effective supply chain management practices ensure timely and efficient bunkering operations. Mitigation strategies for LNG bunkering emissions are vital for regulatory compliance and environmental sustainability. Cost-effective infrastructure development is a priority, with optimization of LNG bunkering processes for efficiency and safety being key. Technology advancements, such as automated bunkering systems and digitalization, are transforming the market. Safety protocols for LNG bunkering operations and training are essential to minimize risks and ensure regulatory compliance.

Environmental impact assessments for LNG bunkering projects are necessary to minimize negative impacts on the environment. Economic feasibility and profitability factors, including logistics planning and execution strategies, are critical for successful LNG bunkering projects. Comparing different LNG bunkering methodologies and costs is essential for making informed decisions.

LNG bunkering port infrastructure upgrade and expansion are necessary to meet the growing demand for LNG as a marine fuel. Managing risk in LNG bunkering operations and maintenance is crucial for ensuring safety and efficiency. Overall, the LNG bunkering market is dynamic and requires continuous innovation and adaptation to meet the evolving needs of the maritime industry.

What are the key market drivers leading to the rise in the adoption of Liquefied Natural Gas (LNG) Bunkering Industry?

  • The increase in the supply of liquefied natural gas (LNG) serves as the primary market driver. 
  • The global natural gas market is experiencing significant growth due to the increase in unconventional resources such as coalbed methane, shale gas, and tight gas. This trend is making natural gas the fastest-growing fossil fuel in the oil and gas industry. According to Shell's projections, global LNG demand is expected to increase by 60% by 2040, reaching between 630 million and 718 million metric tons annually. This surge in demand is driven by the rising energy needs in Asia and the push to reduce emissions in heavy industries and transportation.
  • For instance, Shell's initiative aims to address these factors and underscores the crucial role LNG will play in the global energy transition. The forecasted growth in LNG demand represents a substantial opportunity for market participants.

What are the market trends shaping the Liquefied Natural Gas (LNG) Bunkering Industry?

  • The increasing demand for cleaner fuels represents a notable market trend. A growing number of consumers and industries prioritize the use of cleaner fuel sources.
  • The transportation sector, encompassing roadways, ships, and airways, plays a crucial role in global trade and economic growth. Maritime transport, in particular, is a significant contributor, connecting demand and supply across the world. This sector's expansion leads to an increase in fuel consumption, resulting in the emission of greenhouse gases (GHG), primarily CO2 from the combustion of petroleum-based fuels.
  • As of now, the transportation sector accounts for approximately 23% of global energy-related CO2 emissions. Looking ahead, there's a growing emphasis on reducing the carbon footprint of the transportation sector. One potential solution is the adoption of liquefied natural gas (LNG) as a cleaner alternative to traditional petroleum-based fuels.
  • The LNG bunkering market is expected to experience a surge, with future growth reaching up to 27% of the total marine fuel market share. This shift towards LNG is driven by its environmental benefits, as it emits up to 25% less CO2 compared to traditional marine fuels. The robust growth of the LNG bunkering market will contribute significantly to reducing the transportation sector's carbon footprint and promoting sustainable growth in the global economy.

What challenges does the Liquefied Natural Gas (LNG) Bunkering Industry face during its growth?

  • The high capital requirements for utilizing LNG (Liquefied Natural Gas) as a marine fuel represent a significant challenge to the industry's growth, as substantial investments are necessary for infrastructure development, such as LNG bunkering facilities and fuel storage tanks on ships. 
  • The LNG bunkering market faces significant challenges due to the high capital and operational costs associated with using LNG to fuel ships. Capital expenses include investments in LNG tanks and connections, bunkering stations, automation, and interfacing, with an oil tanker requiring approximately USD105,621.66 for an LNG system, USD17,475.73 for engine modifications, and USD9,708.74 for yard costs. The construction of a dual-fueled vessel is approximately five times more expensive than building a conventionally-fueled ship due to the necessity of installing larger LNG tanks.
  • According to industry reports, the global LNG bunkering market is expected to grow by over 20% in the next decade, driven by increasing demand for cleaner fuel options and stricter emissions regulations. For instance, the adoption of LNG as a marine fuel has increased by 50% in the past five years.

Exclusive Customer Landscape

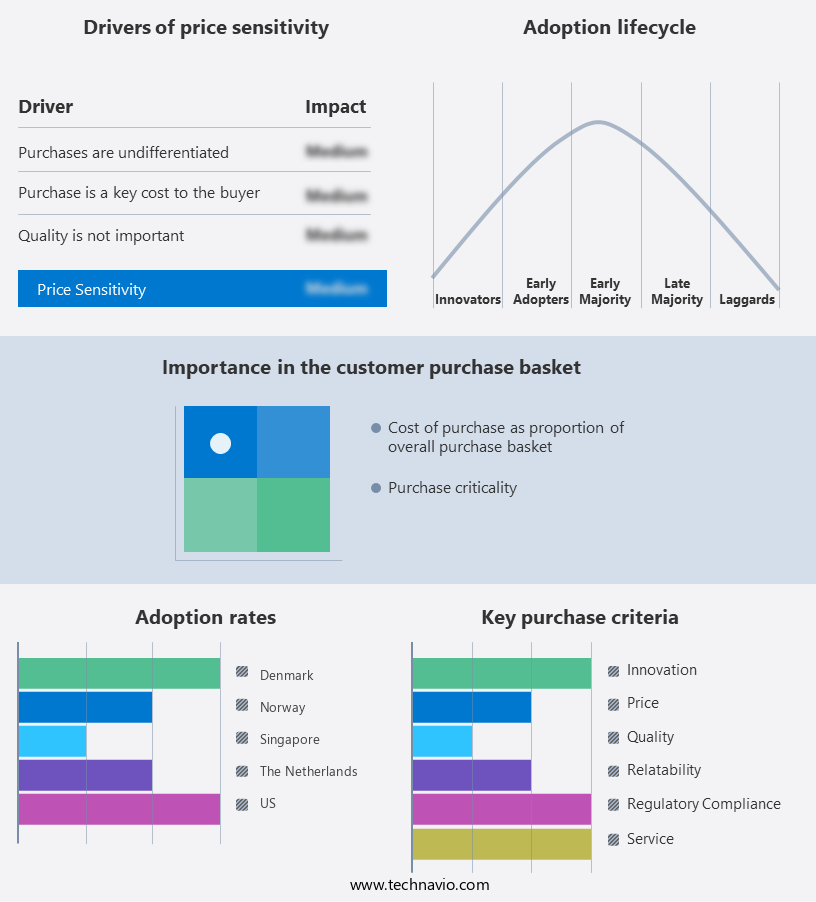
The liquefied natural gas (lng) bunkering market forecasting report includes the adoption lifecycle of the market, covering from the innovator's stage to the laggard's stage. It focuses on adoption rates in different regions based on penetration. Furthermore, the liquefied natural gas (lng) bunkering market report also includes key purchase criteria and drivers of price sensitivity to help companies evaluate and develop their market growth analysis strategies.

Liquefied Natural Gas (LNG) Bunkering Market Share by Geography

 Customer Landscape

Key Companies & Market Insights

Companies are implementing various strategies, such as strategic alliances, liquefied natural gas (lng) bunkering market forecast, partnerships, mergers and acquisitions, geographical expansion, and product/service launches, to enhance their presence in the industry.

Arkas Holding SA - The company specializes in Liquefied Natural Gas (LNG) bunkering services, facilitating the transfer of LNG from supply vessels or terminals to marine vessels as an alternative fuel source. This service contributes to the decarbonization of the maritime industry.

The industry research and growth report includes detailed analyses of the competitive landscape of the market and information about key companies, including:

  • Arkas Holding SA
  • Barents NaturGass AS
  • Crowley Maritime Corp.
  • Eagle LNG Partners
  • Equinor ASA
  • EVOL LNG
  • Fluxys SA
  • Gasum Oy
  • Harvey Gulf International Marine LLC
  • Naturgy Energy Group SA
  • PETRONAS Chemicals Group Berhad
  • Petronet LNG Ltd.
  • QLNG Transport LLC
  • Shell plc
  • SHV Energy
  • Singapore Technologies Engineering Ltd.
  • TotalEnergies SE
  • Trelleborg AB

Qualitative and quantitative analysis of companies has been conducted to help clients understand the wider business environment as well as the strengths and weaknesses of key industry players. Data is qualitatively analyzed to categorize companies as pure play, category-focused, industry-focused, and diversified; it is quantitatively analyzed to categorize companies as dominant, leading, strong, tentative, and weak.

Recent Development and News in Liquefied Natural Gas (LNG) Bunkering Market

  • In January 2024, Shell and TotalEnergies announced a strategic partnership to jointly develop an LNG bunkering hub in the Port of Rotterdam, the Netherlands. This collaboration aimed to strengthen their positions in the European LNG bunkering market and support the decarbonization of shipping (Shell press release, 2024).
  • In March 2024, ExxonMobil and Cheniere Energy completed the first commercial LNG bunkering operation in the U.S. At the Cheniere Sabine Pass LNG terminal in Louisiana. This marked a significant milestone in the expansion of LNG bunkering services in the American market (ExxonMobil press release, 2024).
  • In May 2024, Mitsui O.S.K. Lines (MOL) and NYK Line, two leading Japanese shipping companies, signed a memorandum of understanding (MOU) with Qatargas to construct an LNG bunkering vessel. The vessel, scheduled for delivery in 2026, will serve the growing demand for LNG as a marine fuel in the Asia-Pacific region (MOL press release, 2024).
  • In April 2025, the European Union (EU) passed the Alternative Fuels Infrastructure Regulation, which mandates the deployment of at least 100 LNG bunkering stations in the EU by 2030. This regulatory initiative is expected to accelerate the adoption of LNG as a marine fuel and reduce greenhouse gas emissions from the shipping sector (European Commission press release, 2025).

Research Analyst Overview

  • The LNG bunkering market exhibits continuous evolution, driven by the expanding use of LNG as a cleaner maritime fuel across various sectors. Cryogenic pumping techniques have streamlined bunkering operations, enabling efficient transfer of LNG from storage facilities to vessels. However, port congestion and bunkering scheduling challenges persist, necessitating the optimization of bunker delivery methods and bunkering time. Fuel consumption data reveals a significant reduction in greenhouse gas emissions, bolstering the environmental benefits of LNG as a fuel. According to industry reports, LNG demand is projected to grow by 15% over the next decade, fueled by economic viability and fuel switching strategies.
  • Vapor pressure control, safety management systems, operational costs, maintenance procedures, maritime fuel standards, training and certification, environmental regulations, LNG storage capacity, infrastructure investment, and bunker fuel pricing are crucial factors shaping the market landscape. For instance, a major European port reported a 25% increase in LNG bunkering activities in the past year, underscoring the market's ongoing dynamism.

Dive into Technavio's robust research methodology, blending expert interviews, extensive data synthesis, and validated models for unparalleled Liquefied Natural Gas (LNG) Bunkering Market insights. See full methodology.

Market Scope

Report Coverage

Details

Page number

221

Base year

2024

Historic period

2019-2023

Forecast period

2025-2029

Growth momentum & CAGR

Accelerate at a CAGR of 21.9%

Market growth 2025-2029

USD 1592.6 million

Market structure

Fragmented

YoY growth 2024-2025(%)

18.6

Key countries

Norway, The Netherlands, Singapore, US, Denmark, UK, Germany, France, China, and Japan

Competitive landscape

Leading Companies, Market Positioning of Companies, Competitive Strategies, and Industry Risks

Request Free Sample

What are the Key Data Covered in this Liquefied Natural Gas (LNG) Bunkering Market Research and Growth Report?

  • CAGR of the Liquefied Natural Gas (LNG) Bunkering industry during the forecast period
  • Detailed information on factors that will drive the growth and forecasting between 2025 and 2029
  • Precise estimation of the size of the market and its contribution of the industry in focus to the parent market
  • Accurate predictions about upcoming growth and trends and changes in consumer behaviour
  • Growth of the market across Europe, APAC, North America, South America, and Middle East and Africa
  • Thorough analysis of the market's competitive landscape and detailed information about companies
  • Comprehensive analysis of factors that will challenge the liquefied natural gas (lng) bunkering market growth of industry companies

We can help! Our analysts can customize this liquefied natural gas (lng) bunkering market research report to meet your requirements.

Get in touch

1 Executive Summary

  • 1.1 Market overview
    • Executive Summary - Chart on Market Overview
    • Executive Summary - Data Table on Market Overview
    • Executive Summary - Chart on Global Market Characteristics
    • Executive Summary - Chart on Market by Geography
    • Executive Summary - Chart on Market Segmentation by Application
    • Executive Summary - Chart on Market Segmentation by End-user
    • Executive Summary - Chart on Market Segmentation by Product Type
    • Executive Summary - Chart on Incremental Growth
    • Executive Summary - Data Table on Incremental Growth
    • Executive Summary - Chart on Company Market Positioning

2 Technavio Analysis

  • 2.1 Analysis of price sensitivity, lifecycle, customer purchase basket, adoption rates, and purchase criteria
    • Analysis of price sensitivity, lifecycle, customer purchase basket, adoption rates, and purchase criteria
  • 2.2 Criticality of inputs and Factors of differentiation
    • Overview on criticality of inputs and factors of differentiation
  • 2.3 Factors of disruption
    • Overview on factors of disruption
  • 2.4 Impact of drivers and challenges
    • Impact of drivers and challenges in 2024 and 2029

3 Market Landscape

  • 3.1 Market ecosystem
    • Parent Market
    • Data Table on - Parent Market
  • 3.2 Market characteristics
    • Market characteristics analysis
  • 3.3 Value chain analysis
    • Value chain analysis

4 Market Sizing

  • 4.1 Market definition
    • Offerings of companies included in the market definition
  • 4.2 Market segment analysis
    • Market segments
  • 4.3 Market size 2024
    • 4.4 Market outlook: Forecast for 2024-2029
      • Chart on Global - Market size and forecast 2024-2029 ($ million)
      • Data Table on Global - Market size and forecast 2024-2029 ($ million)
      • Chart on Global Market: Year-over-year growth 2024-2029 (%)
      • Data Table on Global Market: Year-over-year growth 2024-2029 (%)

    5 Historic Market Size

    • 5.1 Global Liquefied Natural Gas (LNG) Bunkering Market 2019 - 2023
      • Historic Market Size - Data Table on Global Liquefied Natural Gas (LNG) Bunkering Market 2019 - 2023 ($ million)
    • 5.2 Application segment analysis 2019 - 2023
      • Historic Market Size - Application Segment 2019 - 2023 ($ million)
    • 5.3 End-user segment analysis 2019 - 2023
      • Historic Market Size - End-user Segment 2019 - 2023 ($ million)
    • 5.4 Product Type segment analysis 2019 - 2023
      • Historic Market Size - Product Type Segment 2019 - 2023 ($ million)
    • 5.5 Geography segment analysis 2019 - 2023
      • Historic Market Size - Geography Segment 2019 - 2023 ($ million)
    • 5.6 Country segment analysis 2019 - 2023
      • Historic Market Size - Country Segment 2019 - 2023 ($ million)

    6 Qualitative Analysis

    • 6.1 Impact of AI on Global Liquefied Natural Gas (LNG) Bunkering Market

      7 Five Forces Analysis

      • 7.1 Five forces summary
        • Five forces analysis - Comparison between 2024 and 2029
      • 7.2 Bargaining power of buyers
        • Bargaining power of buyers - Impact of key factors 2024 and 2029
      • 7.3 Bargaining power of suppliers
        • Bargaining power of suppliers - Impact of key factors in 2024 and 2029
      • 7.4 Threat of new entrants
        • Threat of new entrants - Impact of key factors in 2024 and 2029
      • 7.5 Threat of substitutes
        • Threat of substitutes - Impact of key factors in 2024 and 2029
      • 7.6 Threat of rivalry
        • Threat of rivalry - Impact of key factors in 2024 and 2029
      • 7.7 Market condition
        • Chart on Market condition - Five forces 2024 and 2029

      8 Market Segmentation by Application

      • 8.1 Market segments
        • Chart on Application - Market share 2024-2029 (%)
        • Data Table on Application - Market share 2024-2029 (%)
      • 8.2 Comparison by Application
        • Chart on Comparison by Application
        • Data Table on Comparison by Application
      • 8.3 Tanker - Market size and forecast 2024-2029
        • Chart on Tanker - Market size and forecast 2024-2029 ($ million)
        • Data Table on Tanker - Market size and forecast 2024-2029 ($ million)
        • Chart on Tanker - Year-over-year growth 2024-2029 (%)
        • Data Table on Tanker - Year-over-year growth 2024-2029 (%)
      • 8.4 Ferry and ro-ro - Market size and forecast 2024-2029
        • Chart on Ferry and ro-ro - Market size and forecast 2024-2029 ($ million)
        • Data Table on Ferry and ro-ro - Market size and forecast 2024-2029 ($ million)
        • Chart on Ferry and ro-ro - Year-over-year growth 2024-2029 (%)
        • Data Table on Ferry and ro-ro - Year-over-year growth 2024-2029 (%)
      • 8.5 Container - Market size and forecast 2024-2029
        • Chart on Container - Market size and forecast 2024-2029 ($ million)
        • Data Table on Container - Market size and forecast 2024-2029 ($ million)
        • Chart on Container - Year-over-year growth 2024-2029 (%)
        • Data Table on Container - Year-over-year growth 2024-2029 (%)
      • 8.6 Others - Market size and forecast 2024-2029
        • Chart on Others - Market size and forecast 2024-2029 ($ million)
        • Data Table on Others - Market size and forecast 2024-2029 ($ million)
        • Chart on Others - Year-over-year growth 2024-2029 (%)
        • Data Table on Others - Year-over-year growth 2024-2029 (%)
      • 8.7 Market opportunity by Application
        • Market opportunity by Application ($ million)
        • Data Table on Market opportunity by Application ($ million)

      9 Market Segmentation by End-user

      • 9.1 Market segments
        • Chart on End-user - Market share 2024-2029 (%)
        • Data Table on End-user - Market share 2024-2029 (%)
      • 9.2 Comparison by End-user
        • Chart on Comparison by End-user
        • Data Table on Comparison by End-user
      • 9.3 Commercial - Market size and forecast 2024-2029
        • Chart on Commercial - Market size and forecast 2024-2029 ($ million)
        • Data Table on Commercial - Market size and forecast 2024-2029 ($ million)
        • Chart on Commercial - Year-over-year growth 2024-2029 (%)
        • Data Table on Commercial - Year-over-year growth 2024-2029 (%)
      • 9.4 Defense - Market size and forecast 2024-2029
        • Chart on Defense - Market size and forecast 2024-2029 ($ million)
        • Data Table on Defense - Market size and forecast 2024-2029 ($ million)
        • Chart on Defense - Year-over-year growth 2024-2029 (%)
        • Data Table on Defense - Year-over-year growth 2024-2029 (%)
      • 9.5 Market opportunity by End-user
        • Market opportunity by End-user ($ million)
        • Data Table on Market opportunity by End-user ($ million)

      10 Market Segmentation by Product Type

      • 10.1 Market segments
        • Chart on Product Type - Market share 2024-2029 (%)
        • Data Table on Product Type - Market share 2024-2029 (%)
      • 10.2 Comparison by Product Type
        • Chart on Comparison by Product Type
        • Data Table on Comparison by Product Type
      • 10.3 Ship-to-ship - Market size and forecast 2024-2029
        • Chart on Ship-to-ship - Market size and forecast 2024-2029 ($ million)
        • Data Table on Ship-to-ship - Market size and forecast 2024-2029 ($ million)
        • Chart on Ship-to-ship - Year-over-year growth 2024-2029 (%)
        • Data Table on Ship-to-ship - Year-over-year growth 2024-2029 (%)
      • 10.4 Port-to-ship - Market size and forecast 2024-2029
        • Chart on Port-to-ship - Market size and forecast 2024-2029 ($ million)
        • Data Table on Port-to-ship - Market size and forecast 2024-2029 ($ million)
        • Chart on Port-to-ship - Year-over-year growth 2024-2029 (%)
        • Data Table on Port-to-ship - Year-over-year growth 2024-2029 (%)
      • 10.5 Truck-to-ship - Market size and forecast 2024-2029
        • Chart on Truck-to-ship - Market size and forecast 2024-2029 ($ million)
        • Data Table on Truck-to-ship - Market size and forecast 2024-2029 ($ million)
        • Chart on Truck-to-ship - Year-over-year growth 2024-2029 (%)
        • Data Table on Truck-to-ship - Year-over-year growth 2024-2029 (%)
      • 10.6 Portable tanks - Market size and forecast 2024-2029
        • Chart on Portable tanks - Market size and forecast 2024-2029 ($ million)
        • Data Table on Portable tanks - Market size and forecast 2024-2029 ($ million)
        • Chart on Portable tanks - Year-over-year growth 2024-2029 (%)
        • Data Table on Portable tanks - Year-over-year growth 2024-2029 (%)
      • 10.7 Market opportunity by Product Type
        • Market opportunity by Product Type ($ million)
        • Data Table on Market opportunity by Product Type ($ million)

      11 Customer Landscape

      • 11.1 Customer landscape overview
        • Analysis of price sensitivity, lifecycle, customer purchase basket, adoption rates, and purchase criteria

      12 Geographic Landscape

      • 12.1 Geographic segmentation
        • Chart on Market share by geography 2024-2029 (%)
        • Data Table on Market share by geography 2024-2029 (%)
      • 12.2 Geographic comparison
        • Chart on Geographic comparison
        • Data Table on Geographic comparison
      • 12.3 Europe - Market size and forecast 2024-2029
        • Chart on Europe - Market size and forecast 2024-2029 ($ million)
        • Data Table on Europe - Market size and forecast 2024-2029 ($ million)
        • Chart on Europe - Year-over-year growth 2024-2029 (%)
        • Data Table on Europe - Year-over-year growth 2024-2029 (%)
      • 12.4 APAC - Market size and forecast 2024-2029
        • Chart on APAC - Market size and forecast 2024-2029 ($ million)
        • Data Table on APAC - Market size and forecast 2024-2029 ($ million)
        • Chart on APAC - Year-over-year growth 2024-2029 (%)
        • Data Table on APAC - Year-over-year growth 2024-2029 (%)
      • 12.5 North America - Market size and forecast 2024-2029
        • Chart on North America - Market size and forecast 2024-2029 ($ million)
        • Data Table on North America - Market size and forecast 2024-2029 ($ million)
        • Chart on North America - Year-over-year growth 2024-2029 (%)
        • Data Table on North America - Year-over-year growth 2024-2029 (%)
      • 12.6 South America - Market size and forecast 2024-2029
        • Chart on South America - Market size and forecast 2024-2029 ($ million)
        • Data Table on South America - Market size and forecast 2024-2029 ($ million)
        • Chart on South America - Year-over-year growth 2024-2029 (%)
        • Data Table on South America - Year-over-year growth 2024-2029 (%)
      • 12.7 Middle East and Africa - Market size and forecast 2024-2029
        • Chart on Middle East and Africa - Market size and forecast 2024-2029 ($ million)
        • Data Table on Middle East and Africa - Market size and forecast 2024-2029 ($ million)
        • Chart on Middle East and Africa - Year-over-year growth 2024-2029 (%)
        • Data Table on Middle East and Africa - Year-over-year growth 2024-2029 (%)
      • 12.8 Norway - Market size and forecast 2024-2029
        • Chart on Norway - Market size and forecast 2024-2029 ($ million)
        • Data Table on Norway - Market size and forecast 2024-2029 ($ million)
        • Chart on Norway - Year-over-year growth 2024-2029 (%)
        • Data Table on Norway - Year-over-year growth 2024-2029 (%)
      • 12.9 Singapore - Market size and forecast 2024-2029
        • Chart on Singapore - Market size and forecast 2024-2029 ($ million)
        • Data Table on Singapore - Market size and forecast 2024-2029 ($ million)
        • Chart on Singapore - Year-over-year growth 2024-2029 (%)
        • Data Table on Singapore - Year-over-year growth 2024-2029 (%)
      • 12.10 The Netherlands - Market size and forecast 2024-2029
        • Chart on The Netherlands - Market size and forecast 2024-2029 ($ million)
        • Data Table on The Netherlands - Market size and forecast 2024-2029 ($ million)
        • Chart on The Netherlands - Year-over-year growth 2024-2029 (%)
        • Data Table on The Netherlands - Year-over-year growth 2024-2029 (%)
      • 12.11 US - Market size and forecast 2024-2029
        • Chart on US - Market size and forecast 2024-2029 ($ million)
        • Data Table on US - Market size and forecast 2024-2029 ($ million)
        • Chart on US - Year-over-year growth 2024-2029 (%)
        • Data Table on US - Year-over-year growth 2024-2029 (%)
      • 12.12 Denmark - Market size and forecast 2024-2029
        • Chart on Denmark - Market size and forecast 2024-2029 ($ million)
        • Data Table on Denmark - Market size and forecast 2024-2029 ($ million)
        • Chart on Denmark - Year-over-year growth 2024-2029 (%)
        • Data Table on Denmark - Year-over-year growth 2024-2029 (%)
      • 12.13 UK - Market size and forecast 2024-2029
        • Chart on UK - Market size and forecast 2024-2029 ($ million)
        • Data Table on UK - Market size and forecast 2024-2029 ($ million)
        • Chart on UK - Year-over-year growth 2024-2029 (%)
        • Data Table on UK - Year-over-year growth 2024-2029 (%)
      • 12.14 Germany - Market size and forecast 2024-2029
        • Chart on Germany - Market size and forecast 2024-2029 ($ million)
        • Data Table on Germany - Market size and forecast 2024-2029 ($ million)
        • Chart on Germany - Year-over-year growth 2024-2029 (%)
        • Data Table on Germany - Year-over-year growth 2024-2029 (%)
      • 12.15 France - Market size and forecast 2024-2029
        • Chart on France - Market size and forecast 2024-2029 ($ million)
        • Data Table on France - Market size and forecast 2024-2029 ($ million)
        • Chart on France - Year-over-year growth 2024-2029 (%)
        • Data Table on France - Year-over-year growth 2024-2029 (%)
      • 12.16 China - Market size and forecast 2024-2029
        • Chart on China - Market size and forecast 2024-2029 ($ million)
        • Data Table on China - Market size and forecast 2024-2029 ($ million)
        • Chart on China - Year-over-year growth 2024-2029 (%)
        • Data Table on China - Year-over-year growth 2024-2029 (%)
      • 12.17 Japan - Market size and forecast 2024-2029
        • Chart on Japan - Market size and forecast 2024-2029 ($ million)
        • Data Table on Japan - Market size and forecast 2024-2029 ($ million)
        • Chart on Japan - Year-over-year growth 2024-2029 (%)
        • Data Table on Japan - Year-over-year growth 2024-2029 (%)
      • 12.18 Market opportunity by geography
        • Market opportunity by geography ($ million)
        • Data Tables on Market opportunity by geography ($ million)

      13 Drivers, Challenges, and Opportunity/Restraints

      • 13.1 Market drivers
        • 13.2 Market challenges
          • 13.3 Impact of drivers and challenges
            • Impact of drivers and challenges in 2024 and 2029
          • 13.4 Market opportunities/restraints

            14 Competitive Landscape

            • 14.1 Overview
              • 14.2 Competitive Landscape
                • Overview on criticality of inputs and factors of differentiation
              • 14.3 Landscape disruption
                • Overview on factors of disruption
              • 14.4 Industry risks
                • Impact of key risks on business

              15 Competitive Analysis

              • 15.1 Companies profiled
                • Companies covered
              • 15.2 Company ranking index
                • Company ranking index
              • 15.3 Market positioning of companies
                • Matrix on companies position and classification
              • 15.4 Arkas Holding SA
                • Arkas Holding SA - Overview
                • Arkas Holding SA - Product / Service
                • Arkas Holding SA - Key offerings
                • SWOT
              • 15.5 Barents NaturGass AS
                • Barents NaturGass AS - Overview
                • Barents NaturGass AS - Product / Service
                • Barents NaturGass AS - Key offerings
                • SWOT
              • 15.6 Crowley Maritime Corp.
                • Crowley Maritime Corp. - Overview
                • Crowley Maritime Corp. - Product / Service
                • Crowley Maritime Corp. - Key offerings
                • SWOT
              • 15.7 Eagle LNG Partners
                • Eagle LNG Partners - Overview
                • Eagle LNG Partners - Product / Service
                • Eagle LNG Partners - Key offerings
                • SWOT
              • 15.8 Equinor ASA
                • Equinor ASA - Overview
                • Equinor ASA - Business segments
                • Equinor ASA - Key news
                • Equinor ASA - Key offerings
                • Equinor ASA - Segment focus
                • SWOT
              • 15.9 EVOL LNG
                • EVOL LNG - Overview
                • EVOL LNG - Product / Service
                • EVOL LNG - Key offerings
                • SWOT
              • 15.10 Fluxys SA
                • Fluxys SA - Overview
                • Fluxys SA - Product / Service
                • Fluxys SA - Key offerings
                • SWOT
              • 15.11 Gasum Oy
                • Gasum Oy - Overview
                • Gasum Oy - Product / Service
                • Gasum Oy - Key offerings
                • SWOT
              • 15.12 Harvey Gulf International Marine LLC
                • Harvey Gulf International Marine LLC - Overview
                • Harvey Gulf International Marine LLC - Product / Service
                • Harvey Gulf International Marine LLC - Key offerings
                • SWOT
              • 15.13 Naturgy Energy Group SA
                • Naturgy Energy Group SA - Overview
                • Naturgy Energy Group SA - Product / Service
                • Naturgy Energy Group SA - Key offerings
                • SWOT
              • 15.14 PETRONAS Chemicals Group Berhad
                • PETRONAS Chemicals Group Berhad - Overview
                • PETRONAS Chemicals Group Berhad - Business segments
                • PETRONAS Chemicals Group Berhad - Key offerings
                • PETRONAS Chemicals Group Berhad - Segment focus
                • SWOT
              • 15.15 Petronet LNG Ltd.
                • Petronet LNG Ltd. - Overview
                • Petronet LNG Ltd. - Product / Service
                • Petronet LNG Ltd. - Key offerings
                • SWOT
              • 15.16 QLNG Transport LLC
                • QLNG Transport LLC - Overview
                • QLNG Transport LLC - Product / Service
                • QLNG Transport LLC - Key offerings
                • SWOT
              • 15.17 Shell plc
                • Shell plc - Overview
                • Shell plc - Business segments
                • Shell plc - Key news
                • Shell plc - Key offerings
                • Shell plc - Segment focus
                • SWOT
              • 15.18 Singapore Technologies Engineering Ltd.
                • Singapore Technologies Engineering Ltd. - Overview
                • Singapore Technologies Engineering Ltd. - Business segments
                • Singapore Technologies Engineering Ltd. - Key news
                • Singapore Technologies Engineering Ltd. - Key offerings
                • Singapore Technologies Engineering Ltd. - Segment focus
                • SWOT

              16 Appendix

              • 16.1 Scope of the report
                • 16.2 Inclusions and exclusions checklist
                  • Inclusions checklist
                  • Exclusions checklist
                • 16.3 Currency conversion rates for US$
                  • Currency conversion rates for US$
                • 16.4 Research methodology
                  • Research methodology
                • 16.5 Data procurement
                  • Information sources
                • 16.6 Data validation
                  • Data validation
                • 16.7 Validation techniques employed for market sizing
                  • Validation techniques employed for market sizing
                • 16.8 Data synthesis
                  • Data synthesis
                • 16.9 360 degree market analysis
                  • 360 degree market analysis
                • 16.10 List of abbreviations
                  • List of abbreviations

                Research Methodology

                Technavio presents a detailed picture of the market by way of study, synthesis, and summation of data from multiple sources. The analysts have presented the various facets of the market with a particular focus on identifying the key industry influencers. The data thus presented is comprehensive, reliable, and the result of extensive research, both primary and secondary.

                INFORMATION SOURCES

                Primary sources

                • Manufacturers and suppliers
                • Channel partners
                • Industry experts
                • Strategic decision makers

                Secondary sources

                • Industry journals and periodicals
                • Government data
                • Financial reports of key industry players
                • Historical data
                • Press releases

                DATA ANALYSIS

                Data Synthesis

                • Collation of data
                • Estimation of key figures
                • Analysis of derived insights

                Data Validation

                • Triangulation with data models
                • Reference against proprietary databases
                • Corroboration with industry experts

                REPORT WRITING

                Qualitative

                • Market drivers
                • Market challenges
                • Market trends
                • Five forces analysis

                Quantitative

                • Market size and forecast
                • Market segmentation
                • Geographical insights
                • Competitive landscape

                Interested in this report?

                Get your sample now to see our research methodology and insights!

                Download Now

                Frequently Asked Questions

                Liquefied Natural Gas (Lng) Bunkering market growth will increase by $ 1592.6 mn during 2025-2029 .

                The Liquefied Natural Gas (Lng) Bunkering market is expected to grow at a CAGR of 21.9% during 2025-2029 .

                Liquefied Natural Gas (Lng) Bunkering market is segmented by Application( Tanker, Ferry and ro-ro, Container, Others) End-user( Commercial, Defense, Americas) Product Type( Ship-to-ship, Port-to-ship, Truck-to-ship, Portable tanks, Middle East and Africa)

                Arkas Holding SA, Barents NaturGass AS, Crowley Maritime Corp., Eagle LNG Partners, Equinor ASA, EVOL LNG, Fluxys SA, Gasum Oy, Harvey Gulf International Marine LLC, Naturgy Energy Group SA, PETRONAS Chemicals Group Berhad, Petronet LNG Ltd., QLNG Transport LLC, Shell plc, SHV Energy, Singapore Technologies Engineering Ltd., TotalEnergies SE, Trelleborg AB are a few of the key vendors in the Liquefied Natural Gas (Lng) Bunkering market.

                Europe will register the highest growth rate of 60% among the other regions. Therefore, the Liquefied Natural Gas (Lng) Bunkering market in Europe is expected to garner significant business opportunities for the vendors during the forecast period.

                Norway, The Netherlands, Singapore, US, Denmark, UK, Germany, France, China, Japan

                • Increase in supply of LNGDue to the increase in the global supply of coalbed methane is the driving factor this market.
                • shale gas is the driving factor this market.
                • and tight gas is the driving factor this market.
                • natural gas has become the fastest-growing fossil fuel. Hence is the driving factor this market.
                • the global oil and gas industry will experience a significant increase in unconventional oil and gas resources. In February 2025 is the driving factor this market.
                • Shell projected a 60% increase in global LNG demand by 2040. This initiative aimed to address the rising energy needs driven by economic growth in Asia and efforts to reduce emissions in heavy industries and transportation. The forecast highlighted the significant role LNG will play in the global energy transition. For example is the driving factor this market.
                • Shell expects LNG demand to reach between 630 million and 718 million metric tons annually by 2040. Shell projection underscores the growing importance of LNG as a cleaner energy source is the driving factor this market.
                • particularly in regions striving to balance economic growth with environmental sustainability. The anticipated rise in demand is attributed to several factors is the driving factor this market.
                • including the shift from coal to gas in power generation and the increasing adoption of LNG in maritime and heavy-duty transport sectors.With the increase in natural gas production is the driving factor this market.
                • the production of LNG has increased is the driving factor this market.
                • which is likely to boost the growth of the global LNG bunkering market during the forecast period. is the driving factor this market.

                The Liquefied Natural Gas (Lng) Bunkering market vendors should focus on grabbing business opportunities from the Tanker segment as it accounted for the largest market share in the base year.