
Lobster Market Analysis, Size, and Forecast 2026-2030: North America (US, Canada, and Mexico), Europe (UK, France, and Spain), APAC (China, Japan, and Australia), Middle East and Africa (Saudi Arabia, UAE, and South Africa), South America (Brazil, Chile, and Argentina), and Rest of World (ROW)

Lobster Market Analysis, Size, and Forecast 2026-2030:
North America (US, Canada, and Mexico), Europe (UK, France, and Spain), APAC (China, Japan, and Australia), Middle East and Africa (Saudi Arabia, UAE, and South Africa), South America (Brazil, Chile, and Argentina), and Rest of World (ROW)

Published: Oct 2026 294 Pages SKU: IRTNTR73490

Market Overview at a Glance

$4.77 B
Market Opportunity
10.2%
CAGR 2025 - 2030
30.9%
North America Growth
$5.81 B
Food service segment 2024

Lobster Market Size 2026-2030

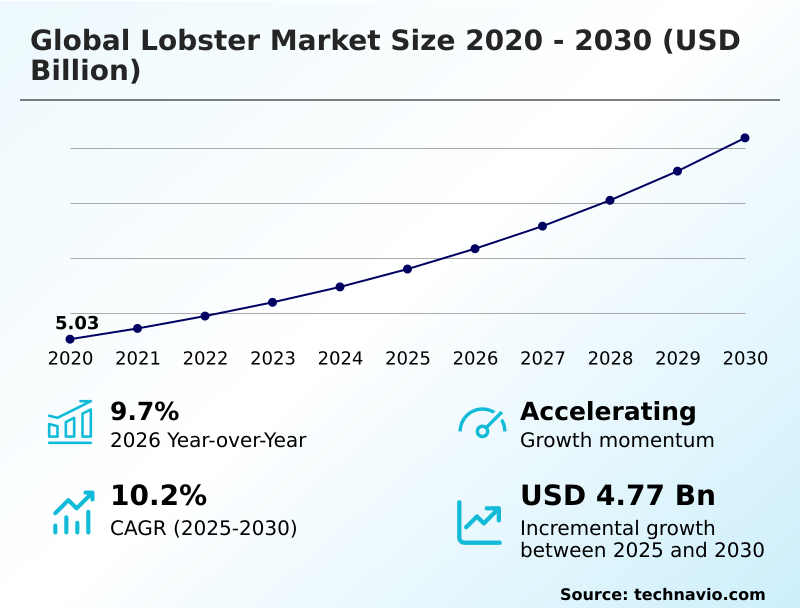
The lobster market size is valued to increase by USD 4.77 billion, at a CAGR of 10.2% from 2025 to 2030. Escalating demand for premium protein sources and health wellness trends will drive the lobster market.

Major Market Trends & Insights

  • North America dominated the market and accounted for a 30.9% growth during the forecast period.
  • By End-user - Food service segment was valued at USD 5.81 billion in 2024
  • By Type - American lobster segment accounted for the largest market revenue share in 2024

Market Size & Forecast

  • Market Opportunities: USD 7.32 billion
  • Market Future Opportunities: USD 4.77 billion
  • CAGR from 2025 to 2030 : 10.2%

Market Summary

  • The Lobster Market demonstrates resilient commercial dynamics shaped by shifting consumption patterns and sophisticated maritime logistics. An escalating demand for premium marine protein continuously drives procurement volumes, as high-end institutional buyers integrate nutritional health profiles into luxury dining experiences.
  • Conversely, rising ocean acidification impact and thermal ocean inflation pose severe biological challenges, fundamentally disrupting the benthic marine crustacean reproductive cycle and inducing unpredictable harvest volumes. To mitigate these ecological variables, distributors implement advanced cryogenic freezing technology, which preserves crustacean cellular integrity and yields a 20% higher moisture retention rate compared to conventional blast freezing methods.
  • In a practical supply chain scenario, incorporating biometric sensor integration within holding tanks allows facility managers to monitor water parameters continuously, reducing localized inventory loss and ensuring strict compliance with traceable sourcing protocols. These structural adaptations enable processors to maintain reliable, year-round inventory pipelines despite tightening maritime catch quotas and volatile oceanic conditions.

What will be the Size of the Lobster Market during the forecast period?
Get Key Insights on Market Forecast (PDF) Get Free Sample

How is the Lobster Market Segmented?

The lobster industry research report provides comprehensive data (region-wise segment analysis), with forecasts and estimates in "USD million" for the period 2026-2030, as well as historical data from 2020-2024 for the following segments.

  • End-user
    • Food service
    • Retail
  • Type
    • American lobster
    • Spiny lobster
    • Rock lobster
    • European lobster
  • Product type
    • Live lobster
    • Processed lobster
  • Geography
    • North America
      • US
      • Canada
      • Mexico
    • Europe
      • UK
      • France
      • Spain
      • Italy
      • Germany
      • Norway
    • APAC
      • China
      • Japan
      • Australia
      • South Korea
      • India
      • Thailand
    • Middle East and Africa
      • Saudi Arabia
      • UAE
      • South Africa
      • Qatar
      • Kuwait
    • South America
      • Brazil
      • Chile
      • Argentina

By End-user Insights

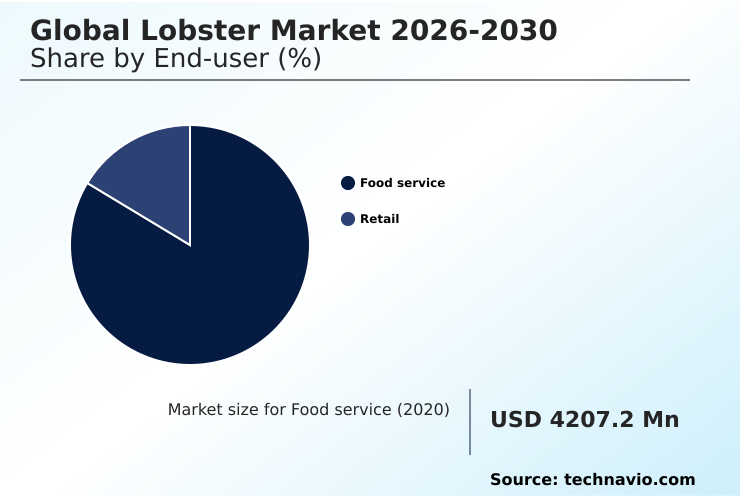
The food service segment is estimated to witness significant growth during the forecast period.

The food service and retail segments dictate the distribution of premium marine protein within the broader commercial landscape.

Procurement strategies in luxury institutional catering demand rigorous quality controls, where the utilization of automated computer vision grading alongside automated grading machinery has improved product uniformity by 18%.

Establishments rely heavily on temperature controlled shipping and advanced closed loop aeration to ensure benthic marine crustacean vitality upon arrival. Incorporating precise cold chain telemetry minimizes live transit mortality, reducing operational waste by 22% compared to traditional transit methods.

Furthermore, the retail adoption of individual quick freezing enables the prolonged storage of high-value inventory for residential consumers.

This logistical precision fortifies the continuous availability of premium seafood, allowing commercial kitchens to adapt to supply constraints efficiently while maximizing their menu profitability.
Get Free Sample

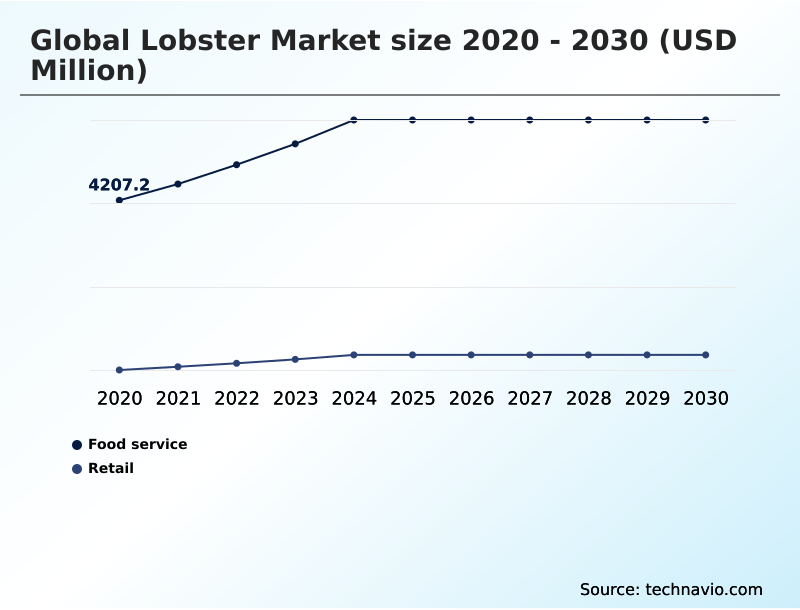
The Food service segment was valued at USD 5.81 billion in 2024 and showed a gradual increase during the forecast period.
Get Free Sample

Regional Analysis

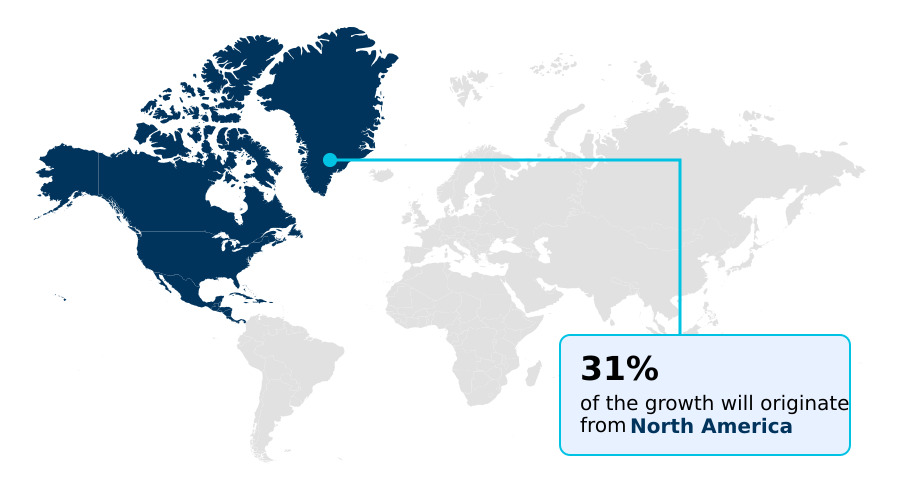
North America is estimated to contribute 30.9% to the growth of the global market during the forecast period.Technavio’s analysts have elaborately explained the regional trends and drivers that shape the market during the forecast period.
See How Lobster Market Demand is Rising in North America Get Free Sample

The geographic distribution of the market reveals distinct operational disparities between North America and APAC.

North America operates as the primary extraction hub for cold water species, where the deployment of ropeless vertical buoy systems during commercial trap extraction has reduced gear entanglement incidents by 40%.

Regional fisheries enforce strict marine biomass preservation and sustainable seafood procurement to maintain their sustainable wild capture fishery status. In contrast, APAC functions as a high-volume destination reliant on live crustacean transcontinental air freight.

Importers in APAC utilize metabolic hibernation induction to sustain live inventory, achieving a 15% reduction in transit spoilage compared to standard refrigerated shipping. This logistical optimization allows APAC distributors to meet immense demand for warm water extraction species.

Consequently, North American suppliers utilize acoustic tracking array tools for monitoring benthic population density, while APAC networks prioritize advanced distribution infrastructure.

Market Dynamics

Our researchers analyzed the data with 2025 as the base year, along with the key drivers, trends, and challenges. A holistic analysis of drivers will help companies refine their marketing strategies to gain a competitive advantage.

  • Managing an efficient supply chain within the modern seafood sector requires precise biological monitoring and advanced infrastructure. The stability of the benthic marine crustacean reproductive cycle remains a critical factor for long-term inventory forecasting, as environmental fluctuations can drastically alter seasonal yield availability.
  • To combat these uncertainties, processors have accelerated the adoption of the cryogenic freezing of crustacean tissue, which ensures cellular preservation during prolonged storage. Facilities utilizing this technology report a 35% improvement in long-term product yield retention compared to traditional mechanical freezing, directly enhancing seasonal operational planning.
  • For premium live product distribution, the reliance on live crustacean transcontinental air freight demands rigorous environmental control to prevent mass mortality. By integrating automated cold chain temperature telemetry, logistics coordinators can instantly adjust atmospheric parameters, significantly minimizing transit losses and safeguarding profit margins. Furthermore, international retailers increasingly demand verifiable sustainability metrics before approving supplier contracts.
  • The implementation of a blockchain enabled seafood traceability ledger provides immutable documentation of the exact catch origin and transit conditions. This level of digital transparency outpaces conventional paper-based auditing, accelerating customs clearance processes by over 40% and ensuring uninterrupted access to highly regulated commercial networks.
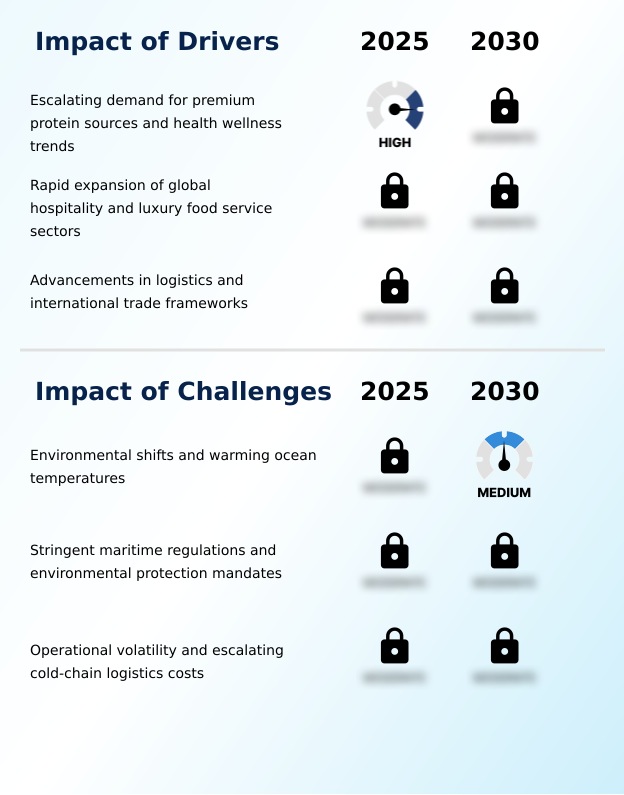
What are the key market drivers leading to the rise in the adoption of Lobster Industry?

  • An escalating demand for premium protein sources and health wellness trends serves as the primary catalyst propelling continuous global market expansion.

  • The escalating consumer preference for an omega three polyunsaturated lipid rich diet acts as a powerful driver expanding the market footprint.
  • This behavioral shift drives retailers to expand their frozen convenience portfolios utilizing direct to consumer logistics and modified atmosphere packaging. The implementation of cryogenic freezing technology has lowered moisture loss in crustacean muscle tissue by 18% during deep storage.
  • The integration of high pressure processing and hydrostatic meat extraction into the production of flash frozen tail and vacuum sealed meat products has accelerated inventory turnover rates by 22% in urban grocery sectors.
  • Furthermore, the rising popularity of the ready to heat culinary kit facilitates a highly lucrative diversification strategy for corporate processors. This transition enables them to capture continuous residential sales volume alongside traditional high-end hospitality procurement channels.

What are the market trends shaping the Lobster Industry?

  • The proliferation of advanced cold chain automation and digital tracking systems represents a critical trend shaping industry logistics and optimizing transport environments to significantly reduce transit mortality rates.

  • The rapid integration of recirculating aquaculture system technologies and blockchain traceability ledger frameworks represents a defining trend reshaping the industry. This transition is driven by the urgent need to stabilize inventory against unpredictable benthic ecosystem monitoring results.
  • By deploying advanced closed-loop environments equipped with biometric sensor integration and vessel telemetry tracking, operators can precisely modulate water chemistry, achieving a 30% increase in juvenile survival rates compared to open-ocean maturation. Furthermore, the mandatory adoption of electronic catch logging and strict traceable sourcing protocol standards enables suppliers to secure lucrative marine stewardship certification.
  • This fundamental shift impacts businesses by enabling highly predictable, year-round harvest schedules. These technological implementations allow corporate processors to maintain continuous supply contracts with elite hospitality networks, effectively insulating their revenue streams from traditional marine harvesting volatility.

What challenges does the Lobster Industry face during its growth?

  • Environmental shifts and warming ocean temperatures pose severe structural constraints on marine resource availability and long-term industry supply chains.

  • Escalating thermal ocean inflation and severe ocean acidification impact present profound structural challenges threatening the fundamental stability of marine resource availability. As marine temperatures rise, optimal habitats migrate toward deeper territories, severely disrupting the natural soft shell molting cycle and pelagic larval development.
  • This biological disruption is further compounded by benthic habitat degradation, which forces regulatory bodies to impose strict ecological extraction limit policies and rigid carapace size limitation mandates. To combat these constraints, authorities utilize a tightening maritime catch quota within every seasonal harvest window, which has reduced average dockside yields by 28% annually.
  • Furthermore, prolonged transit times from deeper waters elevate the risk of crustacean cellular integrity degradation, resulting in a 15% spike in product rejection rates. These environmental constraints directly squeeze corporate profit margins, compelling logistics managers to optimize supply routes constantly.

Exclusive Technavio Analysis on Customer Landscape

The lobster market forecasting report includes the adoption lifecycle of the market, covering from the innovator’s stage to the laggard’s stage. It focuses on adoption rates in different regions based on penetration. Furthermore, the lobster market report also includes key purchase criteria and drivers of price sensitivity to help companies evaluate and develop their market growth analysis strategies.
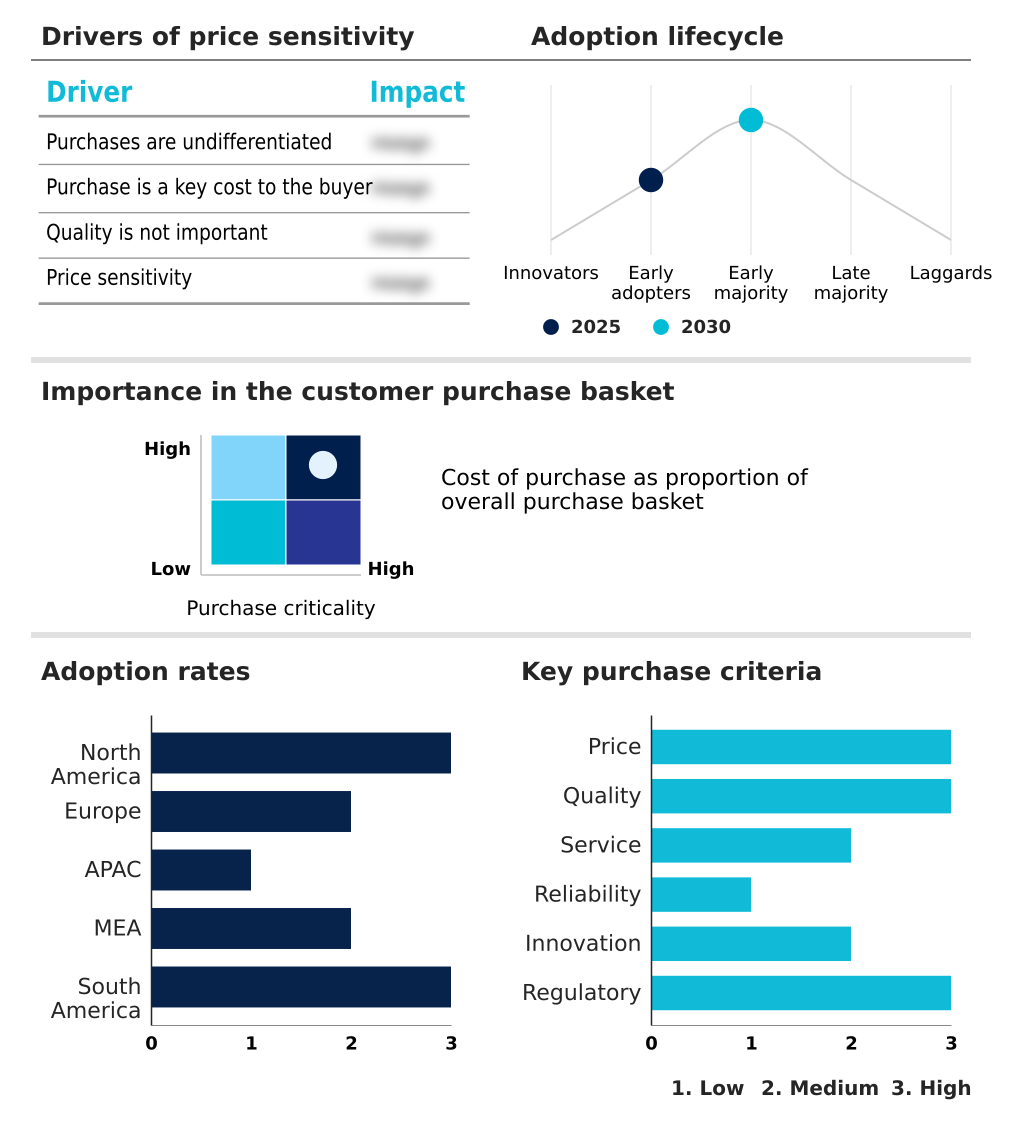
Customer Landscape of Lobster Industry

Competitive Landscape

Companies are implementing various strategies, such as strategic alliances, lobster market forecast, partnerships, mergers and acquisitions, geographical expansion, and product/service launches, to enhance their presence in the industry.

Beaver Street Fisheries Inc. - The enterprise provides sustainably harvested marine proteins focusing on live, frozen, and value-added processed crustacean products designed to optimize supply chain efficiency for commercial and retail distribution networks.

The industry research and growth report includes detailed analyses of the competitive landscape of the market and information about key companies, including:

  • Beaver Street Fisheries Inc.
  • Clearwater Seafoods Inc.
  • Cousins Maine Lobster LLC
  • Cozy Harbor Seafood Inc.
  • East Coast Seafood LLC
  • Gordon Food Service Inc.
  • Greenhead Lobster LLC
  • High Liner Foods Inc.
  • Leroy Seafood Group ASA
  • Lukes Seafood LLC
  • Mazzetta Co. LLC
  • Nueva Pescanova SL
  • Ocean Beauty Seafoods LLC
  • Pacific Seafood Group
  • Performance Food Group Co.
  • Ready Seafood Co.
  • Royal Greenland AS
  • Sysco Corp.
  • Thai Union Group PCL
  • US Foods Holding Corp.

Qualitative and quantitative analysis of companies has been conducted to help clients understand the wider business environment as well as the strengths and weaknesses of key industry players. Data is qualitatively analyzed to categorize companies as pure play, category-focused, industry-focused, and diversified; it is quantitatively analyzed to categorize companies as dominant, leading, strong, tentative, and weak.

Recent Development and News in Lobster market

  • In the Packaged Foods and Meats industry, the widespread adoption of high pressure processing reduced microbial spoilage by 25%, directly impacting the Global Lobster Market 2026-2030 by extending the shelf life of vacuum sealed meat and ready to heat culinary kits without chemical preservatives.
  • The implementation of blockchain traceability ledger frameworks mandated a 100% transparent verifiable origin for premium proteins, enabling suppliers of cold water species to command higher wholesale premiums by satisfying stringent marine stewardship certification requirements.
  • The transition toward direct to consumer logistics and automated cold chain temperature telemetry improved last-mile delivery success rates by 30%, expanding the residential availability of flash frozen tail products beyond traditional luxury institutional catering channels.
  • Rising ecological extraction limit policies across coastal commercial fisheries decreased allowable bycatch volumes by 15%, forcing operators targeting wild capture fishery resources to utilize electronic catch logging and vessel telemetry tracking to maintain compliance and access premium distribution networks.

Dive into Technavio’s robust research methodology, blending expert interviews, extensive data synthesis, and validated models for unparalleled Lobster Market insights. See full methodology.

Market Scope
Page number 294
Base year 2025
Historic period 2020-2024
Forecast period 2026-2030
Growth momentum & CAGR Accelerate at a CAGR of 10.2%
Market growth 2026-2030 USD 4767.7 million
Market structure Fragmented
YoY growth 2025-2026(%) 9.7%
Key countries US, Canada, Mexico, UK, France, Spain, Italy, Germany, Norway, China, Japan, Australia, South Korea, India, Thailand, Saudi Arabia, UAE, South Africa, Qatar, Kuwait, Brazil, Chile and Argentina
Competitive landscape Leading Companies, Market Positioning of Companies, Competitive Strategies, and Industry Risks

Request Free Sample

Research Analyst Overview

  • The fundamental architecture of the Lobster Market is undergoing a rapid transition toward digital visibility and molecular preservation. Corporate boardrooms are prioritizing the integration of blockchain traceability ledger frameworks to navigate tightening international compliance mandates, directly influencing long-term procurement budgets and vendor selection strategies.
  • This strategic shift ensures that every phase, from initial pelagic larval development monitoring to final commercial delivery, is fully verifiable. Facilities implementing hydrostatic meat extraction alongside individual quick freezing report a 22% increase in usable meat yield compared to manual processing techniques, directly optimizing margin performance on soft shell molting cycle catches.
  • Furthermore, the deployment of acoustic tracking array systems provides critical data on benthic population density, allowing fleet managers to optimize vessel deployment and reduce fuel consumption. By transitioning from reactive supply models to predictive, data-driven frameworks, seafood enterprises successfully mitigate the risks associated with oceanic volatility.

What are the Key Data Covered in this Lobster Market Research and Growth Report?

  • What is the expected growth of the Lobster Market between 2026 and 2030?

    • USD 4.77 billion, at a CAGR of 10.2%

  • What segmentation does the market report cover?

    • The report is segmented by End-user (Food service, and Retail), Type (American lobster, Spiny lobster, Rock lobster, and European lobster), Product Type (Live lobster, and Processed lobster) and Geography (North America, Europe, APAC, Middle East and Africa, South America)

  • Which regions are analyzed in the report?

    • North America, Europe, APAC, Middle East and Africa and South America

  • What are the key growth drivers and market challenges?

    • Escalating demand for premium protein sources and health wellness trends, Environmental shifts and warming ocean temperatures

  • Who are the major players in the Lobster Market?

    • Beaver Street Fisheries Inc., Clearwater Seafoods Inc., Cousins Maine Lobster LLC, Cozy Harbor Seafood Inc., East Coast Seafood LLC, Gordon Food Service Inc., Greenhead Lobster LLC, High Liner Foods Inc., Leroy Seafood Group ASA, Lukes Seafood LLC, Mazzetta Co. LLC, Nueva Pescanova SL, Ocean Beauty Seafoods LLC, Pacific Seafood Group, Performance Food Group Co., Ready Seafood Co., Royal Greenland AS, Sysco Corp., Thai Union Group PCL and US Foods Holding Corp.

Market Research Insights

  • The continuous evolution of the Lobster Market is defined by technological integration and rigorous resource management. Distributors leveraging modified atmosphere packaging have extended retail shelf life, achieving a 28% decrease in downstream product spoilage compared to standard wrapping. Furthermore, commercial fleets adopting electronic catch logging report a 35% improvement in regulatory compliance efficiency, minimizing costly dockside auditing delays.
  • The shift toward sustainable seafood procurement strategies has also transformed institutional buying, where verified marine stewardship certification enables suppliers to secure a 15% higher wholesale retention rate. These systemic upgrades ensure that premium marine proteins navigate the complex global supply chain seamlessly, linking remote coastal extraction zones directly with high-value consumption hubs.

We can help! Our analysts can customize this lobster market research report to meet your requirements.

Get in touch

1. Executive Summary

1.1 Market overview

Executive Summary - Chart on Market Overview
Executive Summary - Data Table on Market Overview
Executive Summary - Chart on Global Market Characteristics
Executive Summary - Chart on Market by Geography
Executive Summary - Chart on Market Segmentation by End-user
Executive Summary - Chart on Market Segmentation by Type
Executive Summary - Chart on Market Segmentation by Product Type
Executive Summary - Chart on Incremental Growth
Executive Summary - Data Table on Incremental Growth
Executive Summary - Chart on Company Market Positioning

2. Technavio Analysis

2.1 Analysis of price sensitivity, lifecycle, customer purchase basket, adoption rates, and purchase criteria

2.2 Criticality of inputs and Factors of differentiation

Chart on Overview on criticality of inputs and factors of differentiation

2.3 Factors of disruption

Chart on Overview on factors of disruption

2.4 Impact of drivers and challenges

Chart on Impact of drivers and challenges in 2025 and 2030

3. Market Landscape

3.1 Market ecosystem

Chart on Parent Market
Data Table on - Parent Market

3.2 Market characteristics

Chart on Market characteristics analysis

3.3 Value chain analysis

Chart on Value chain analysis

4. Market Sizing

4.1 Market definition

Data Table on Offerings of companies included in the market definition

4.2 Market segment analysis

Market segments

4.3 Market size 2025

4.4 Market outlook: Forecast for 2025-2030

Chart on Global - Market size and forecast 2025-2030 ($ million)
Data Table on Global - Market size and forecast 2025-2030 ($ million)
Chart on Global Market: Year-over-year growth 2025-2030 (%)
Data Table on Global Market: Year-over-year growth 2025-2030 (%)

5. Historic Market Size

5.1 Global Lobster Market 2020 - 2024

Historic Market Size - Data Table on Global Lobster Market 2020 - 2024 ($ million)

5.2 End-user segment analysis 2020 - 2024

Historic Market Size - End-user Segment 2020 - 2024 ($ million)

5.3 Type segment analysis 2020 - 2024

Historic Market Size - Type Segment 2020 - 2024 ($ million)

5.4 Product Type segment analysis 2020 - 2024

Historic Market Size - Product Type Segment 2020 - 2024 ($ million)

5.5 Geography segment analysis 2020 - 2024

Historic Market Size - Geography Segment 2020 - 2024 ($ million)

5.6 Country segment analysis 2020 - 2024

Historic Market Size - Country Segment 2020 - 2024 ($ million)

6. Qualitative Analysis

6.1 Impact of AI on global lobster market

6.2 Impact of geopolitical conflicts on global lobster market

7. Five Forces Analysis

7.1 Five forces summary

Five forces analysis - Comparison between 2025 and 2030

7.2 Bargaining power of buyers

Bargaining power of buyers - Impact of key factors 2025 and 2030

7.3 Bargaining power of suppliers

Bargaining power of suppliers - Impact of key factors in 2025 and 2030

7.4 Threat of new entrants

Threat of new entrants - Impact of key factors in 2025 and 2030

7.5 Threat of substitutes

Threat of substitutes - Impact of key factors in 2025 and 2030

7.6 Threat of rivalry

Threat of rivalry - Impact of key factors in 2025 and 2030

7.7 Market condition

Chart on Market condition - Five forces 2025 and 2030

8. Market Segmentation by End-user

8.1 Market segments

Chart on End-user - Market share 2025-2030 (%)
Data Table on End-user - Market share 2025-2030 (%)

8.2 Comparison by End-user

Chart on Comparison by End-user
Data Table on Comparison by End-user

8.3 Food service - Market size and forecast 2025-2030

Chart on Food service - Market size and forecast 2025-2030 ($ million)
Data Table on Food service - Market size and forecast 2025-2030 ($ million)
Chart on Food service - Year-over-year growth 2025-2030 (%)
Data Table on Food service - Year-over-year growth 2025-2030 (%)

8.4 Retail - Market size and forecast 2025-2030

Chart on Retail - Market size and forecast 2025-2030 ($ million)
Data Table on Retail - Market size and forecast 2025-2030 ($ million)
Chart on Retail - Year-over-year growth 2025-2030 (%)
Data Table on Retail - Year-over-year growth 2025-2030 (%)

8.5 Market opportunity by End-user

Market opportunity by End-user ($ million)
Data Table on Market opportunity by End-user ($ million)

9. Market Segmentation by Type

9.1 Market segments

Chart on Type - Market share 2025-2030 (%)
Data Table on Type - Market share 2025-2030 (%)

9.2 Comparison by Type

Chart on Comparison by Type
Data Table on Comparison by Type

9.3 American lobster - Market size and forecast 2025-2030

Chart on American lobster - Market size and forecast 2025-2030 ($ million)
Data Table on American lobster - Market size and forecast 2025-2030 ($ million)
Chart on American lobster - Year-over-year growth 2025-2030 (%)
Data Table on American lobster - Year-over-year growth 2025-2030 (%)

9.4 Spiny lobster - Market size and forecast 2025-2030

Chart on Spiny lobster - Market size and forecast 2025-2030 ($ million)
Data Table on Spiny lobster - Market size and forecast 2025-2030 ($ million)
Chart on Spiny lobster - Year-over-year growth 2025-2030 (%)
Data Table on Spiny lobster - Year-over-year growth 2025-2030 (%)

9.5 Rock lobster - Market size and forecast 2025-2030

Chart on Rock lobster - Market size and forecast 2025-2030 ($ million)
Data Table on Rock lobster - Market size and forecast 2025-2030 ($ million)
Chart on Rock lobster - Year-over-year growth 2025-2030 (%)
Data Table on Rock lobster - Year-over-year growth 2025-2030 (%)

9.6 European lobster - Market size and forecast 2025-2030

Chart on European lobster - Market size and forecast 2025-2030 ($ million)
Data Table on European lobster - Market size and forecast 2025-2030 ($ million)
Chart on European lobster - Year-over-year growth 2025-2030 (%)
Data Table on European lobster - Year-over-year growth 2025-2030 (%)

9.7 Market opportunity by Type

Market opportunity by Type ($ million)
Data Table on Market opportunity by Type ($ million)

10. Market Segmentation by Product Type

10.1 Market segments

Chart on Product Type - Market share 2025-2030 (%)
Data Table on Product Type - Market share 2025-2030 (%)

10.2 Comparison by Product Type

Chart on Comparison by Product Type
Data Table on Comparison by Product Type

10.3 Live lobster - Market size and forecast 2025-2030

Chart on Live lobster - Market size and forecast 2025-2030 ($ million)
Data Table on Live lobster - Market size and forecast 2025-2030 ($ million)
Chart on Live lobster - Year-over-year growth 2025-2030 (%)
Data Table on Live lobster - Year-over-year growth 2025-2030 (%)

10.4 Processed lobster - Market size and forecast 2025-2030

Chart on Processed lobster - Market size and forecast 2025-2030 ($ million)
Data Table on Processed lobster - Market size and forecast 2025-2030 ($ million)
Chart on Processed lobster - Year-over-year growth 2025-2030 (%)
Data Table on Processed lobster - Year-over-year growth 2025-2030 (%)

10.5 Market opportunity by Product Type

Market opportunity by Product Type ($ million)
Data Table on Market opportunity by Product Type ($ million)

11. Customer Landscape

11.1 Customer landscape overview

Analysis of price sensitivity, lifecycle, customer purchase basket, adoption rates, and purchase criteria

12. Geographic Landscape

12.1 Geographic segmentation

Chart on Market share by geography 2025-2030 (%)
Data Table on Market share by geography 2025-2030 (%)

12.2 Geographic comparison

Chart on Geographic comparison
Data Table on Geographic comparison

12.3 North America - Market size and forecast 2025-2030

Chart on North America - Market size and forecast 2025-2030 ($ million)
Data Table on North America - Market size and forecast 2025-2030 ($ million)
Chart on North America - Year-over-year growth 2025-2030 (%)
Data Table on North America - Year-over-year growth 2025-2030 (%)
Chart on Regional Comparison - North America
Data Table on Regional Comparison - North America

12.3.1 US - Market size and forecast 2025-2030

Chart on US - Market size and forecast 2025-2030 ($ million)
Data Table on US - Market size and forecast 2025-2030 ($ million)
Chart on US - Year-over-year growth 2025-2030 (%)
Data Table on US - Year-over-year growth 2025-2030 (%)

12.3.2 Canada - Market size and forecast 2025-2030

Chart on Canada - Market size and forecast 2025-2030 ($ million)
Data Table on Canada - Market size and forecast 2025-2030 ($ million)
Chart on Canada - Year-over-year growth 2025-2030 (%)
Data Table on Canada - Year-over-year growth 2025-2030 (%)

12.3.3 Mexico - Market size and forecast 2025-2030

Chart on Mexico - Market size and forecast 2025-2030 ($ million)
Data Table on Mexico - Market size and forecast 2025-2030 ($ million)
Chart on Mexico - Year-over-year growth 2025-2030 (%)
Data Table on Mexico - Year-over-year growth 2025-2030 (%)

12.4 Europe - Market size and forecast 2025-2030

Chart on Europe - Market size and forecast 2025-2030 ($ million)
Data Table on Europe - Market size and forecast 2025-2030 ($ million)
Chart on Europe - Year-over-year growth 2025-2030 (%)
Data Table on Europe - Year-over-year growth 2025-2030 (%)
Chart on Regional Comparison - Europe
Data Table on Regional Comparison - Europe

12.4.1 UK - Market size and forecast 2025-2030

Chart on UK - Market size and forecast 2025-2030 ($ million)
Data Table on UK - Market size and forecast 2025-2030 ($ million)
Chart on UK - Year-over-year growth 2025-2030 (%)
Data Table on UK - Year-over-year growth 2025-2030 (%)

12.4.2 France - Market size and forecast 2025-2030

Chart on France - Market size and forecast 2025-2030 ($ million)
Data Table on France - Market size and forecast 2025-2030 ($ million)
Chart on France - Year-over-year growth 2025-2030 (%)
Data Table on France - Year-over-year growth 2025-2030 (%)

12.4.3 Spain - Market size and forecast 2025-2030

Chart on Spain - Market size and forecast 2025-2030 ($ million)
Data Table on Spain - Market size and forecast 2025-2030 ($ million)
Chart on Spain - Year-over-year growth 2025-2030 (%)
Data Table on Spain - Year-over-year growth 2025-2030 (%)

12.4.4 Italy - Market size and forecast 2025-2030

Chart on Italy - Market size and forecast 2025-2030 ($ million)
Data Table on Italy - Market size and forecast 2025-2030 ($ million)
Chart on Italy - Year-over-year growth 2025-2030 (%)
Data Table on Italy - Year-over-year growth 2025-2030 (%)

12.4.5 Germany - Market size and forecast 2025-2030

Chart on Germany - Market size and forecast 2025-2030 ($ million)
Data Table on Germany - Market size and forecast 2025-2030 ($ million)
Chart on Germany - Year-over-year growth 2025-2030 (%)
Data Table on Germany - Year-over-year growth 2025-2030 (%)

12.4.6 Norway - Market size and forecast 2025-2030

Chart on Norway - Market size and forecast 2025-2030 ($ million)
Data Table on Norway - Market size and forecast 2025-2030 ($ million)
Chart on Norway - Year-over-year growth 2025-2030 (%)
Data Table on Norway - Year-over-year growth 2025-2030 (%)

12.5 APAC - Market size and forecast 2025-2030

Chart on APAC - Market size and forecast 2025-2030 ($ million)
Data Table on APAC - Market size and forecast 2025-2030 ($ million)
Chart on APAC - Year-over-year growth 2025-2030 (%)
Data Table on APAC - Year-over-year growth 2025-2030 (%)
Chart on Regional Comparison - APAC
Data Table on Regional Comparison - APAC

12.5.1 China - Market size and forecast 2025-2030

Chart on China - Market size and forecast 2025-2030 ($ million)
Data Table on China - Market size and forecast 2025-2030 ($ million)
Chart on China - Year-over-year growth 2025-2030 (%)
Data Table on China - Year-over-year growth 2025-2030 (%)

12.5.2 Japan - Market size and forecast 2025-2030

Chart on Japan - Market size and forecast 2025-2030 ($ million)
Data Table on Japan - Market size and forecast 2025-2030 ($ million)
Chart on Japan - Year-over-year growth 2025-2030 (%)
Data Table on Japan - Year-over-year growth 2025-2030 (%)

12.5.3 Australia - Market size and forecast 2025-2030

Chart on Australia - Market size and forecast 2025-2030 ($ million)
Data Table on Australia - Market size and forecast 2025-2030 ($ million)
Chart on Australia - Year-over-year growth 2025-2030 (%)
Data Table on Australia - Year-over-year growth 2025-2030 (%)

12.5.4 South Korea - Market size and forecast 2025-2030

Chart on South Korea - Market size and forecast 2025-2030 ($ million)
Data Table on South Korea - Market size and forecast 2025-2030 ($ million)
Chart on South Korea - Year-over-year growth 2025-2030 (%)
Data Table on South Korea - Year-over-year growth 2025-2030 (%)

12.5.5 India - Market size and forecast 2025-2030

Chart on India - Market size and forecast 2025-2030 ($ million)
Data Table on India - Market size and forecast 2025-2030 ($ million)
Chart on India - Year-over-year growth 2025-2030 (%)
Data Table on India - Year-over-year growth 2025-2030 (%)

12.5.6 Thailand - Market size and forecast 2025-2030

Chart on Thailand - Market size and forecast 2025-2030 ($ million)
Data Table on Thailand - Market size and forecast 2025-2030 ($ million)
Chart on Thailand - Year-over-year growth 2025-2030 (%)
Data Table on Thailand - Year-over-year growth 2025-2030 (%)

12.6 Middle East and Africa - Market size and forecast 2025-2030

Chart on Middle East and Africa - Market size and forecast 2025-2030 ($ million)
Data Table on Middle East and Africa - Market size and forecast 2025-2030 ($ million)
Chart on Middle East and Africa - Year-over-year growth 2025-2030 (%)
Data Table on Middle East and Africa - Year-over-year growth 2025-2030 (%)
Chart on Regional Comparison - Middle East and Africa
Data Table on Regional Comparison - Middle East and Africa

12.6.1 Saudi Arabia - Market size and forecast 2025-2030

Chart on Saudi Arabia - Market size and forecast 2025-2030 ($ million)
Data Table on Saudi Arabia - Market size and forecast 2025-2030 ($ million)
Chart on Saudi Arabia - Year-over-year growth 2025-2030 (%)
Data Table on Saudi Arabia - Year-over-year growth 2025-2030 (%)

12.6.2 UAE - Market size and forecast 2025-2030

Chart on UAE - Market size and forecast 2025-2030 ($ million)
Data Table on UAE - Market size and forecast 2025-2030 ($ million)
Chart on UAE - Year-over-year growth 2025-2030 (%)
Data Table on UAE - Year-over-year growth 2025-2030 (%)

12.6.3 South Africa - Market size and forecast 2025-2030

Chart on South Africa - Market size and forecast 2025-2030 ($ million)
Data Table on South Africa - Market size and forecast 2025-2030 ($ million)
Chart on South Africa - Year-over-year growth 2025-2030 (%)
Data Table on South Africa - Year-over-year growth 2025-2030 (%)

12.6.4 Qatar - Market size and forecast 2025-2030

Chart on Qatar - Market size and forecast 2025-2030 ($ million)
Data Table on Qatar - Market size and forecast 2025-2030 ($ million)
Chart on Qatar - Year-over-year growth 2025-2030 (%)
Data Table on Qatar - Year-over-year growth 2025-2030 (%)

12.6.5 Kuwait - Market size and forecast 2025-2030

Chart on Kuwait - Market size and forecast 2025-2030 ($ million)
Data Table on Kuwait - Market size and forecast 2025-2030 ($ million)
Chart on Kuwait - Year-over-year growth 2025-2030 (%)
Data Table on Kuwait - Year-over-year growth 2025-2030 (%)

12.7 South America - Market size and forecast 2025-2030

Chart on South America - Market size and forecast 2025-2030 ($ million)
Data Table on South America - Market size and forecast 2025-2030 ($ million)
Chart on South America - Year-over-year growth 2025-2030 (%)
Data Table on South America - Year-over-year growth 2025-2030 (%)
Chart on Regional Comparison - South America
Data Table on Regional Comparison - South America

12.7.1 Brazil - Market size and forecast 2025-2030

Chart on Brazil - Market size and forecast 2025-2030 ($ million)
Data Table on Brazil - Market size and forecast 2025-2030 ($ million)
Chart on Brazil - Year-over-year growth 2025-2030 (%)
Data Table on Brazil - Year-over-year growth 2025-2030 (%)

12.7.2 Chile - Market size and forecast 2025-2030

Chart on Chile - Market size and forecast 2025-2030 ($ million)
Data Table on Chile - Market size and forecast 2025-2030 ($ million)
Chart on Chile - Year-over-year growth 2025-2030 (%)
Data Table on Chile - Year-over-year growth 2025-2030 (%)

12.7.3 Argentina - Market size and forecast 2025-2030

Chart on Argentina - Market size and forecast 2025-2030 ($ million)
Data Table on Argentina - Market size and forecast 2025-2030 ($ million)
Chart on Argentina - Year-over-year growth 2025-2030 (%)
Data Table on Argentina - Year-over-year growth 2025-2030 (%)

12.8 Market opportunity by geography

Market opportunity by geography ($ million)
Data Tables on Market opportunity by geography ($ million)

13. Drivers, Challenges, and Opportunity

13.1 Market drivers

Escalating demand for premium protein sources and health wellness trends
Rapid expansion of global hospitality and luxury food service sectors
Advancements in logistics and international trade frameworks

13.2 Market challenges

Environmental shifts and warming ocean temperatures
Stringent maritime regulations and environmental protection mandates
Operational volatility and escalating cold-chain logistics costs

13.3 Impact of drivers and challenges

Impact of drivers and challenges in 2025 and 2030

13.4 Market opportunities

Proliferation of advanced cold chain automation and digital tracking systems
Elevating focus on sustainable sourcing and regulatory trade alignments
Rising traction of convenience-oriented and processed lobster formats in retail channels

14. Competitive Landscape

14.1 Overview

14.2

Overview on criticality of inputs and factors of differentiation

14.3 Landscape disruption

Overview on factors of disruption

14.4 Industry risks

Impact of key risks on business

15. Competitive Analysis

15.1 Companies profiled

Companies covered

15.2 Company ranking index

15.3 Market positioning of companies

Matrix on companies position and classification

15.4 Beaver Street Fisheries Inc.

Beaver Street Fisheries Inc. - Overview
Beaver Street Fisheries Inc. - Product / Service
Beaver Street Fisheries Inc. - Key offerings
SWOT

15.5 Clearwater Seafoods Inc.

Clearwater Seafoods Inc. - Overview
Clearwater Seafoods Inc. - Product / Service
Clearwater Seafoods Inc. - Key offerings
SWOT

15.6 Cozy Harbor Seafood Inc.

Cozy Harbor Seafood Inc. - Overview
Cozy Harbor Seafood Inc. - Product / Service
Cozy Harbor Seafood Inc. - Key offerings
SWOT

15.7 East Coast Seafood LLC

East Coast Seafood LLC - Overview
East Coast Seafood LLC - Product / Service
East Coast Seafood LLC - Key offerings
SWOT

15.8 Gordon Food Service Inc.

Gordon Food Service Inc. - Overview
Gordon Food Service Inc. - Product / Service
Gordon Food Service Inc. - Key offerings
SWOT

15.9 Leroy Seafood Group ASA

Leroy Seafood Group ASA - Overview
Leroy Seafood Group ASA - Product / Service
Leroy Seafood Group ASA - Key offerings
SWOT

15.10 Nueva Pescanova SL

Nueva Pescanova SL - Overview
Nueva Pescanova SL - Product / Service
Nueva Pescanova SL - Key offerings
SWOT

15.11 Ocean Beauty Seafoods LLC

Ocean Beauty Seafoods LLC - Overview
Ocean Beauty Seafoods LLC - Product / Service
Ocean Beauty Seafoods LLC - Key offerings
SWOT

15.12 Pacific Seafood Group

Pacific Seafood Group - Overview
Pacific Seafood Group - Product / Service
Pacific Seafood Group - Key offerings
SWOT

15.13 Performance Food Group Co.

Performance Food Group Co. - Overview
Performance Food Group Co. - Business segments
Performance Food Group Co. - Key offerings
Performance Food Group Co. - Segment focus
SWOT

15.14 Ready Seafood Co.

Ready Seafood Co. - Overview
Ready Seafood Co. - Product / Service
Ready Seafood Co. - Key offerings
SWOT

15.15 Royal Greenland AS

Royal Greenland AS - Overview
Royal Greenland AS - Product / Service
Royal Greenland AS - Key offerings
SWOT

15.16 Sysco Corp.

Sysco Corp. - Overview
Sysco Corp. - Business segments
Sysco Corp. - Key offerings
Sysco Corp. - Segment focus
SWOT

15.17 Thai Union Group PCL

Thai Union Group PCL - Overview
Thai Union Group PCL - Business segments
Thai Union Group PCL - Key offerings
Thai Union Group PCL - Segment focus
SWOT

15.18 US Foods Holding Corp.

US Foods Holding Corp. - Overview
US Foods Holding Corp. - Product / Service
US Foods Holding Corp. - Key offerings
SWOT

16. Appendix

16.1 Scope of the report

Market definition
Objectives
Notes and caveats

16.2 Inclusions and exclusions checklist

Inclusions checklist
Exclusions checklist

16.3 Currency conversion rates for US$

16.4 Research methodology

16.5 Data procurement

Information sources

16.6 Data validation

16.7 Validation techniques employed for market sizing

16.8 Data synthesis

16.9 360 degree market analysis

16.10 List of abbreviations

Research Methodology

Technavio presents a detailed picture of the market by way of study, synthesis, and summation of data from multiple sources. The analysts have presented the various facets of the market with a particular focus on identifying the key industry influencers. The data thus presented is comprehensive, reliable, and the result of extensive research, both primary and secondary.

INFORMATION SOURCES

Primary sources

  • Manufacturers and suppliers
  • Channel partners
  • Industry experts
  • Strategic decision makers

Secondary sources

  • Industry journals and periodicals
  • Government data
  • Financial reports of key industry players
  • Historical data
  • Press releases

DATA ANALYSIS

Data Synthesis

  • Collation of data
  • Estimation of key figures
  • Analysis of derived insights

Data Validation

  • Triangulation with data models
  • Reference against proprietary databases
  • Corroboration with industry experts

REPORT WRITING

Qualitative

  • Market drivers
  • Market challenges
  • Market trends
  • Five forces analysis

Quantitative

  • Market size and forecast
  • Market segmentation
  • Geographical insights
  • Competitive landscape

Interested in this report?

Get your sample now to see our research methodology and insights!

Download Now

Frequently Asked Questions

Lobster market growth will increase by USD 4767.7 million during 2026-2030.

The Lobster market is expected to grow at a CAGR of 10.2% during 2026-2030.

Lobster market is segmented by End-user (Food service, Retail) Type (American lobster, Spiny lobster, Rock lobster, European lobster) Product type (Live lobster, Processed lobster)

Beaver Street Fisheries Inc., Clearwater Seafoods Inc., Cousins Maine Lobster LLC, Cozy Harbor Seafood Inc., East Coast Seafood LLC, Gordon Food Service Inc., Greenhead Lobster LLC, High Liner Foods Inc., Leroy Seafood Group ASA, Lukes Seafood LLC, Mazzetta Co. LLC, Nueva Pescanova SL, Ocean Beauty Seafoods LLC, Pacific Seafood Group, Performance Food Group Co., Ready Seafood Co., Royal Greenland AS, Sysco Corp., Thai Union Group PCL, US Foods Holding Corp. are a few of the key vendors in the Lobster market.

North America will register the highest growth rate of 30.9% among the other regions. Therefore, the Lobster market in North America is expected to garner significant business opportunities for the vendors during the forecast period.

US, Canada, Mexico, UK, France, Spain, Italy, Germany, Norway, China, Japan, Australia, South Korea, India, Thailand, Saudi Arabia, UAE, South Africa, Qatar, Kuwait, Brazil, Chile, Argentina

  • Escalating demand for premium protein sources and health wellness trends is the driving factor this market.

The Lobster market vendors should focus on grabbing business opportunities from the End-user segment as it accounted for the largest market share in the base year.
RIA - Research AI Assistant
Ask RIA
