
Log Management Market Size 2025-2029
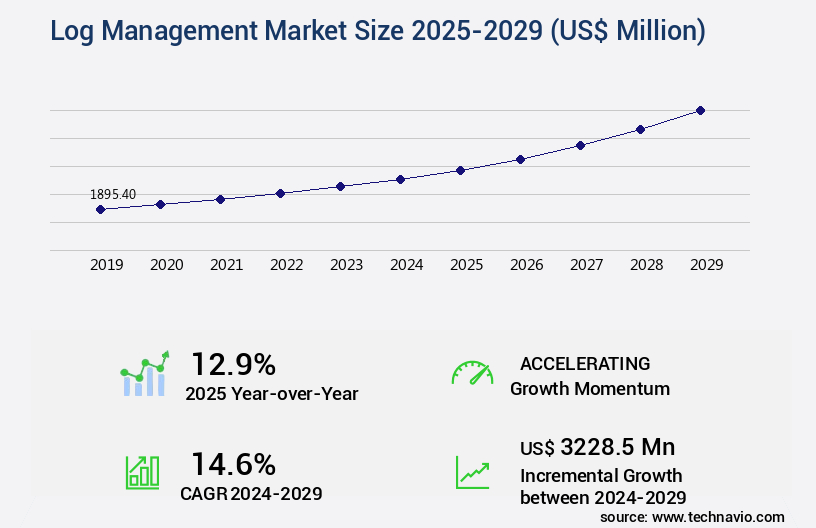
The log management market size is valued to increase USD 3.23 billion, at a CAGR of 14.6% from 2024 to 2029. Growing demand from IT sector will drive the log management market.
Major Market Trends & Insights
- APAC dominated the market and accounted for a 34% growth during the forecast period.
- By Component - Solution segment was valued at USD 1.25 billion in 2023
- By Deployment - On-premises segment accounted for the largest market revenue share in 2023
Market Size & Forecast
- Market Opportunities: USD 244.89 million
- Market Future Opportunities: USD 3228.50 million
- CAGR from 2024 to 2029 : 14.6%
Market Summary
- The market experiences continuous expansion, fueled by the increasing awareness of the significance of data security and compliance in the IT sector. Advanced technologies, such as artificial intelligence (AI) and machine learning (ML), are increasingly integrated into log management systems to enhance their capabilities, enabling real-time threat detection and automated response. However, the high deployment costs associated with these solutions may pose a challenge for smaller businesses.
- According to recent estimates, the market is projected to reach a value of USD 35.8 billion by 2025, underscoring its growing importance in the digital landscape. Despite the challenges, the market's future direction remains promising, with a focus on improving data security, ensuring regulatory compliance, and optimizing operational efficiency.
What will be the Size of the Log Management Market during the forecast period?
Get Key Insights on Market Forecast (PDF) Request Free Sample
How is the Log Management Market Segmented?
The log management industry research report provides comprehensive data (region-wise segment analysis), with forecasts and estimates in "USD million" for the period 2025-2029, as well as historical data from 2019-2023 for the following segments.
- Component
- Solution
- Services
- Deployment
- On-premises
- Cloud-based
- Consumer
- Large enterprises
- SMEs
- End-user
- IT and ITeS
- BFSI
- Education
- Healthcare
- Telecom
- Geography
- North America
- US
- Canada
- Europe
- France
- Germany
- UK
- APAC
- China
- India
- Japan
- South Korea
- South America
- Brazil
- Rest of World (ROW)
- North America
By Component Insights
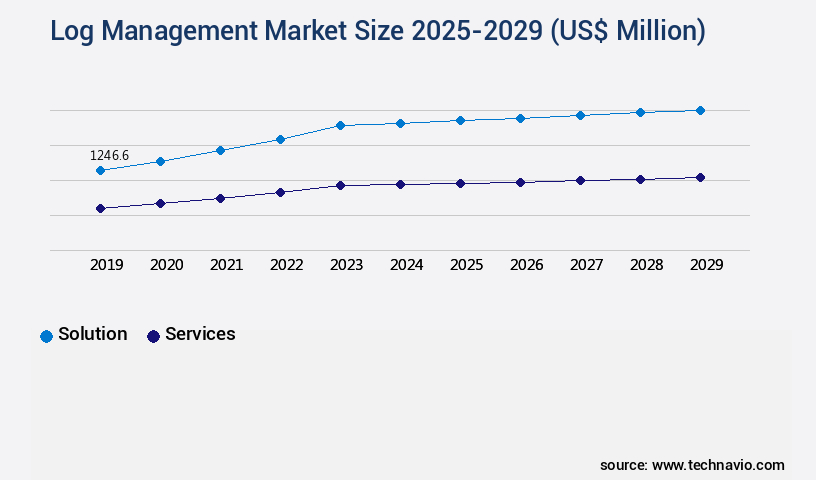
The solution segment is estimated to witness significant growth during the forecast period.
The market is a dynamic and expanding sector, with solutions and services at its core. According to recent market research, the solution segment is poised for significant growth, driven by the increasing demand for cost-effective productivity enhancements and robust security measures for Small and Medium Enterprises (SMEs). Log management systems play a crucial role in this context, handling various types of logs such as application performance monitoring logs, error log analysis, and security log monitoring. These systems facilitate log visualization, event correlation, and log shipping, enabling real-time log monitoring, log aggregation, and performance monitoring. Centralized logging, log volume reduction through techniques like data retention policies, log filtering, and data deduplication, are essential components of these systems.
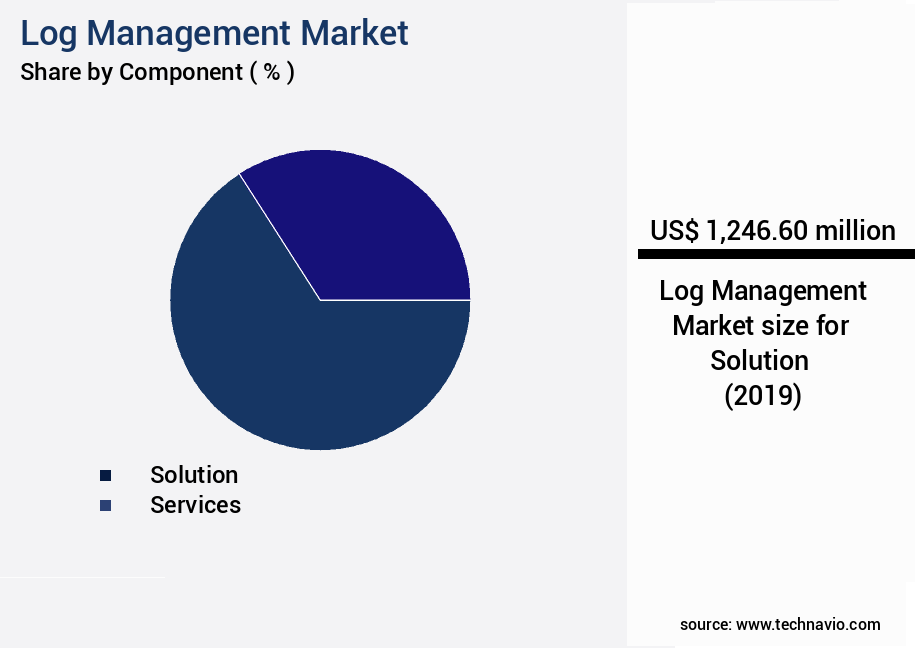
The Solution segment was valued at USD 1.25 billion in 2019 and showed a gradual increase during the forecast period.
Log data enrichment, log indexing, log normalization, log parsing, and compliance reporting further enhance their functionality. With features like log encryption, data anonymization, alerting and notifications, log analysis dashboards, and log forwarders, log management software offers comprehensive log management capabilities. The market's growth is also fueled by the need for audit log management, exception handling logs, network log management, and system log management.
Regional Analysis
APAC is estimated to contribute 34% to the growth of the global market during the forecast period. Technavio's analysts have elaborately explained the regional trends and drivers that shape the market during the forecast period.
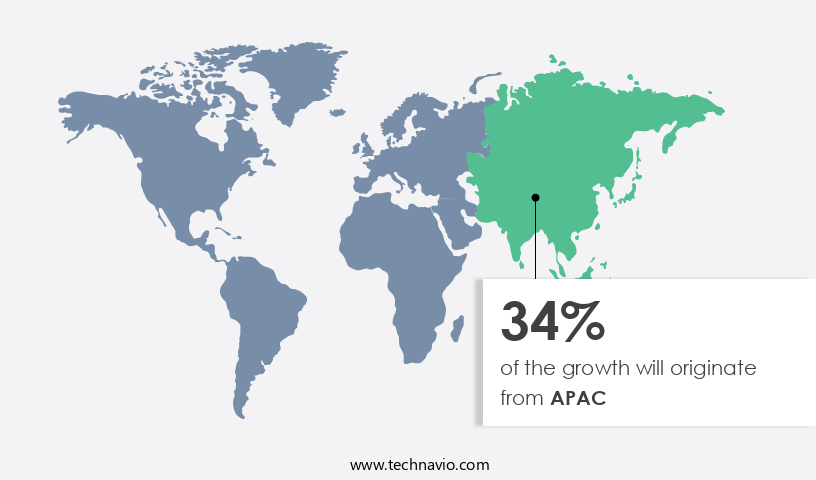
See How Log Management Market Demand is Rising in APAC Request Free Sample
The market experienced significant growth in 2024, with North America leading as the largest contributor by revenue. This region's dominance can be attributed to the increasing adoption of log management solutions by various industries, including IT and BFSI, in response to the rising number of insider attacks. Additionally, the enforcement of stringent government standards and regulations in North American countries, such as the US and Canada, due to the increasing frequency of hosted server attacks and cyberattacks, further boosts the market's expansion.
Market Dynamics
Our researchers analyzed the data with 2024 as the base year, along with the key drivers, trends, and challenges. A holistic analysis of drivers will help companies refine their marketing strategies to gain a competitive advantage.
The market is experiencing significant growth as businesses increasingly recognize the value of effective log retention strategies for mitigating risks and improving operational efficiency. Real-time log monitoring tools enable organizations to identify and respond to threats in real-time, while advanced log correlation techniques help uncover hidden patterns and anomalies that might indicate security breaches or system failures. To improve log parsing efficiency, organizations are turning to centralized log management architectures that consolidate log data from various sources into a single repository. Automated log analysis workflows and log data visualization best practices facilitate faster and more accurate threat detection using log analytics. Effective log data governance policies ensure compliance with regulatory requirements and help manage log data retention and disposal. Secure log management practices, such as implementing log encryption standards and configuring log rotation policies, are essential for protecting sensitive log data from unauthorized access. Compliance reporting using log data is also becoming increasingly important, as organizations face growing scrutiny from regulatory bodies and stakeholders. Log management system scalability and advanced log search functionalities are critical for managing large volumes of log data. Optimizing log storage costs through data compression and deduplication techniques is another key consideration. Streamlining log collection processes and enhancing log data security through performance tuning and effective log filtering techniques are also important for maximizing the value of log data. Overall, the market is poised for continued growth as organizations seek to leverage log data to gain insights, improve security, and optimize operations.
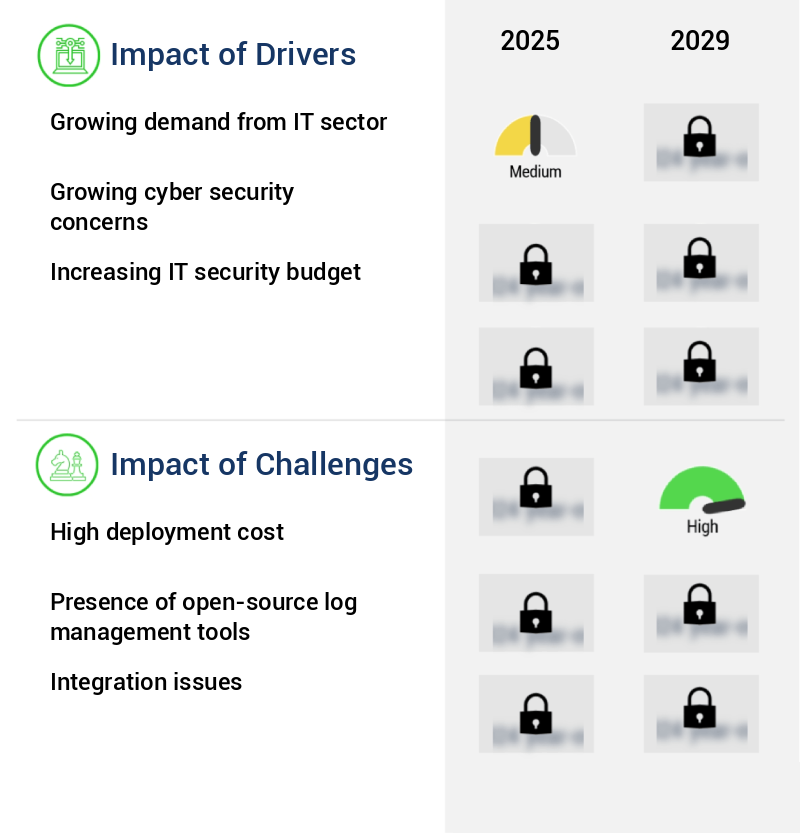
What are the key market drivers leading to the rise in the adoption of Log Management Industry?
- The IT sector's expanding demand serves as the primary catalyst for market growth.
- In today's digital landscape, IT professionals face the daunting task of managing and analyzing logs from an expansive tech environment due to the massive data generation. To streamline this process, they require advanced log management systems and tools that automate data collection, formatting, and analysis. Centralized log management solutions fortify organizations' security capabilities by connecting and storing data in a single location. This approach enables faster identification of anomalies and swifter responses, minimizing the critical window for hackers to move laterally within systems.
- According to recent studies, over 70% of organizations use centralized log management, while the market is projected to reach a value of over USD 14 billion by 2026, demonstrating its growing significance.
What are the market trends shaping the Log Management Industry?
- The integration of the latest technologies is a mandated trend in log management. This approach enhances log management systems with advanced capabilities.
- The market is experiencing significant growth due to the increasing volume of machine data generated by the proliferation of IT and IoT technologies. According to Logic Monitor, machine data is growing 50 times faster than traditional business data. This abundance of data presents an opportunity for businesses to utilize machine learning (ML) in log analysis, enabling the processing of larger datasets to develop more sophisticated algorithms. Log intelligence, or automated and AI-powered log analysis techniques, are gaining popularity for their ability to detect and identify patterns, thereby saving time and resources by reducing the need for manual log sifting.
What challenges does the Log Management Industry face during its growth?
- The high deployment costs represent a significant challenge that can hinder industry growth. In order to mitigate this issue, companies must carefully consider cost-effective strategies and solutions for implementing new technologies or processes.
- The market is undergoing significant evolution due to the increasing importance of data security and compliance in various sectors. The market's growth can be attributed to the rising number of organizations adopting log management solutions to ensure security, streamline operations, and meet regulatory requirements. According to recent estimates, the market is projected to reach a substantial size, with North America and Europe leading the growth. Log management solutions offer numerous benefits, including real-time analysis, enhanced security, and compliance with industry regulations. However, their deployment comes with considerable costs. An organization's total log management solution cost includes software licensing, system designing and customization, implementation, training, and maintenance.
- The need for IT staff recruitment and employee training adds to these expenses. Moreover, the maintenance of on-premises solutions necessitates in-house IT administration, leading to high implementation costs. Additionally, organizations must invest in developing the necessary knowledge, experience, and skills to effectively utilize the solution.
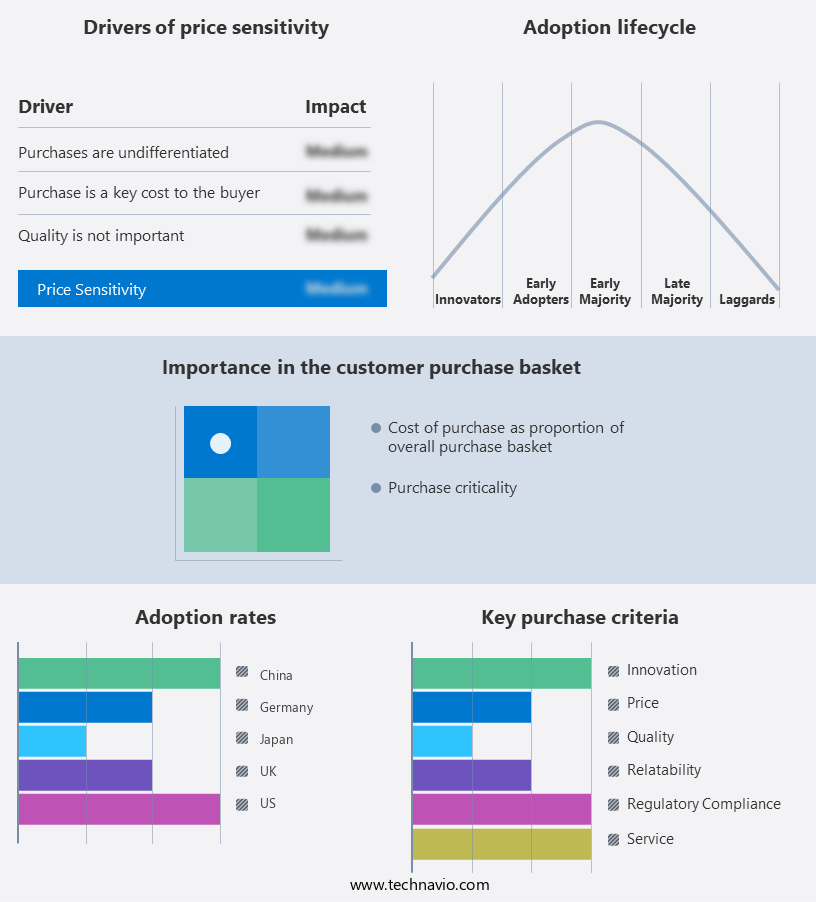
Exclusive Technavio Analysis on Customer Landscape
The log management market forecasting report includes the adoption lifecycle of the market, covering from the innovator's stage to the laggard's stage. It focuses on adoption rates in different regions based on penetration. Furthermore, the log management market report also includes key purchase criteria and drivers of price sensitivity to help companies evaluate and develop their market growth analysis strategies.
Customer Landscape of Log Management Industry
Competitive Landscape
Companies are implementing various strategies, such as strategic alliances, log management market forecast, partnerships, mergers and acquisitions, geographical expansion, and product/service launches, to enhance their presence in the industry.
Cisco Systems Inc. - This company specializes in log management solutions, with a notable offering being Datadog Log Management.
The industry research and growth report includes detailed analyses of the competitive landscape of the market and information about key companies, including:
- Cisco Systems Inc.
- Datadog Inc.
- Elasticsearch B.V.
- Graylog
- International Business Machines Corp.
- LogicMonitor Inc.
- LogRhythm Inc.
- Logshero Ltd.
- McAfee LLC
- New Relic Inc.
- Open Text Corp.
- Rapid7 Inc.
- Sematext Group Inc.
- SolarWinds Corp.
- Splunk Inc.
- Sumo Logic Inc.
- Veriato Inc.
Qualitative and quantitative analysis of companies has been conducted to help clients understand the wider business environment as well as the strengths and weaknesses of key industry players. Data is qualitatively analyzed to categorize companies as pure play, category-focused, industry-focused, and diversified; it is quantitatively analyzed to categorize companies as dominant, leading, strong, tentative, and weak.
Recent Development and News in Log Management Market
- In January 2024, IBM announced the launch of its new cloud-based log analysis solution, IBM Watson for Log Analysis, designed to help organizations gain real-time insights from their machine data (IBM Press Release). This solution uses AI and machine learning algorithms to identify and respond to security threats and performance issues.
- In March 2024, Splunk and Microsoft entered into a strategic partnership to integrate Splunk's log management and observability solutions with Microsoft's Azure platform (Microsoft News Center). This collaboration aimed to provide joint customers with a more seamless experience and improved security and operational efficiency.
- In May 2024, Sumo Logic raised USD 125 million in a Series F funding round, bringing its total funding to over USD 400 million (Sumo Logic Press Release). The company plans to use the funds to expand its global presence and invest in research and development.
- In January 2025, the European Union's General Data Protection Regulation (GDPR) was expanded to include log data in its definition of personal data (European Commission). This development placed additional pressure on organizations to ensure they had robust log management systems in place to comply with the new regulations.
Dive into Technavio's robust research methodology, blending expert interviews, extensive data synthesis, and validated models for unparalleled Log Management Market insights. See full methodology.
|
Market Scope |
|
|
Report Coverage |
Details |
|
Page number |
217 |
|
Base year |
2024 |
|
Historic period |
2019-2023 |
|
Forecast period |
2025-2029 |
|
Growth momentum & CAGR |
Accelerate at a CAGR of 14.6% |
|
Market growth 2025-2029 |
USD 3228.5 million |
|
Market structure |
Fragmented |
|
YoY growth 2024-2025(%) |
12.9 |
|
Key countries |
US, China, UK, Canada, Japan, Germany, India, South Korea, Brazil, and France |
|
Competitive landscape |
Leading Companies, Market Positioning of Companies, Competitive Strategies, and Industry Risks |
Research Analyst Overview
- The market continues to evolve, driven by the increasing volume and complexity of log data generated across various sectors. Structured logging and error log analysis are essential components of modern log management systems, enabling organizations to optimize log storage and improve application performance. For instance, a leading e-commerce company reduced its log data volume by 50% through log volume reduction and log filtering techniques, leading to significant cost savings. Log management systems facilitate security log monitoring, event correlation, and real-time log monitoring, ensuring organizations can detect and respond to potential threats in a timely manner.
- Centralized logging, log indexing, and log normalization enable efficient log analysis and compliance reporting. Log data enrichment and data anonymization are crucial for maintaining data security and privacy. Moreover, log shipping, log aggregation, and log forwarding enable seamless log data transfer and integration with various log management tools. Performance monitoring logs, network log management, and system log management offer valuable insights into system health and performance. Log parsing, log indexing, and log analysis dashboards enable quick and effective log data analysis. The market is expected to grow at a robust rate, with industry analysts projecting a 20% increase in log data generated annually.
- Organizations must invest in advanced log management solutions to effectively manage and analyze their log data, ensuring optimal system performance, enhanced security, and regulatory compliance.
What are the Key Data Covered in this Log Management Market Research and Growth Report?
-
What is the expected growth of the Log Management Market between 2025 and 2029?
-
USD 3.23 billion, at a CAGR of 14.6%
-
-
What segmentation does the market report cover?
-
The report is segmented by Component (Solution and Services), Deployment (On-premises and Cloud-based), Consumer (Large enterprises and SMEs), End-user (IT and ITeS, BFSI, Education, Healthcare, and Telecom), and Geography (North America, APAC, Europe, South America, and Middle East and Africa)
-
-
Which regions are analyzed in the report?
-
North America, APAC, Europe, South America, and Middle East and Africa
-
-
What are the key growth drivers and market challenges?
-
Growing demand from IT sector, High deployment cost
-
-
Who are the major players in the Log Management Market?
-
Cisco Systems Inc., Datadog Inc., Elasticsearch B.V., Graylog, International Business Machines Corp., LogicMonitor Inc., LogRhythm Inc., Logshero Ltd., McAfee LLC, New Relic Inc., Open Text Corp., Rapid7 Inc., Sematext Group Inc., SolarWinds Corp., Splunk Inc., Sumo Logic Inc., and Veriato Inc.
-
Market Research Insights
- The market for log management solutions continues to expand, driven by the increasing volume and complexity of system logs and the need for effective event monitoring, cost optimization, incident response, data security, performance tuning, and compliance audit. According to recent industry reports, the market is projected to grow by over 15% annually, fueled by the adoption of cloud log management and the integration of log analytics platforms into IT infrastructure. For instance, a large financial services organization reported a 20% reduction in incident response time after implementing a log management solution, enabling faster threat detection and root cause analysis.
- This outcome underscores the importance of log management in maintaining data integrity, ensuring capacity planning, and facilitating change management. Additionally, log management tools are essential for managing and analyzing various types of logs, including application logs, database logs, network devices logs, and clogs, among others. These tools provide log query language capabilities, log search functionality, and log archiving features, enabling organizations to optimize their IT operations and enhance their overall security posture.
We can help! Our analysts can customize this log management market research report to meet your requirements.
 RIA -
RIA - 
