Lubricant Anti Wear Agents Market Size 2024-2028
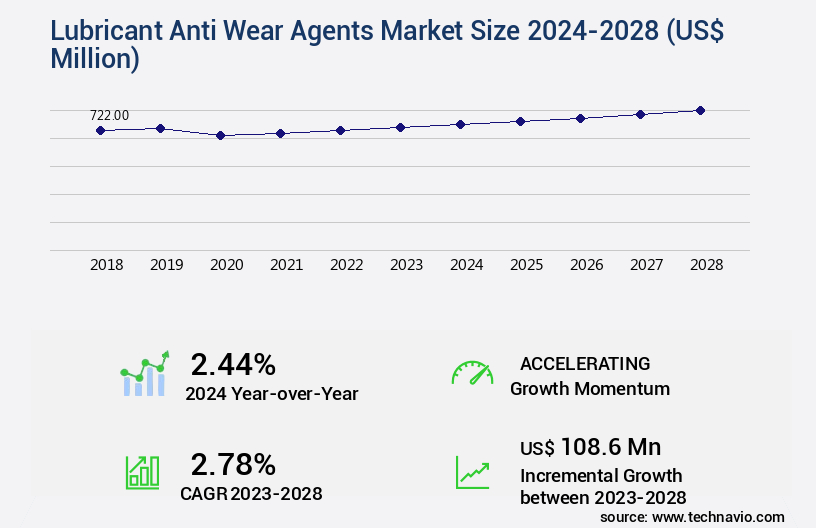
The lubricant anti wear agents market size is forecast to increase by USD 108.6 million, at a CAGR of 2.78% between 2023 and 2028.
Major Market Trends & Insights
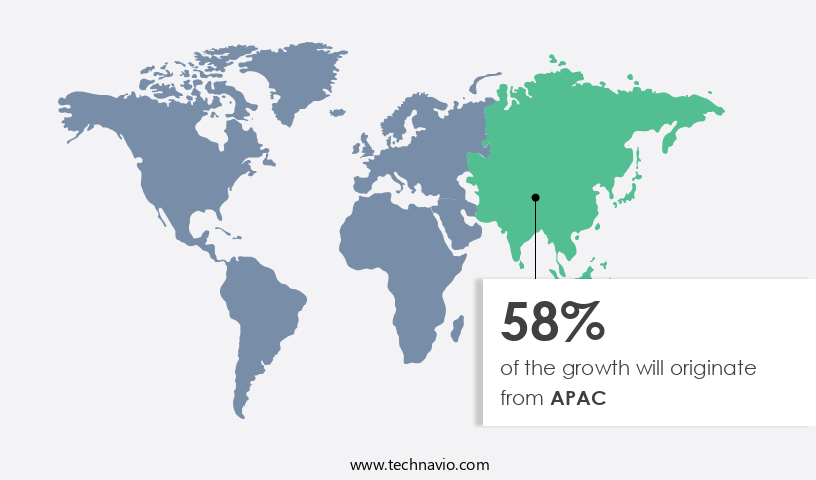
- APAC dominated the market and accounted for a 58% growth during the forecast period.
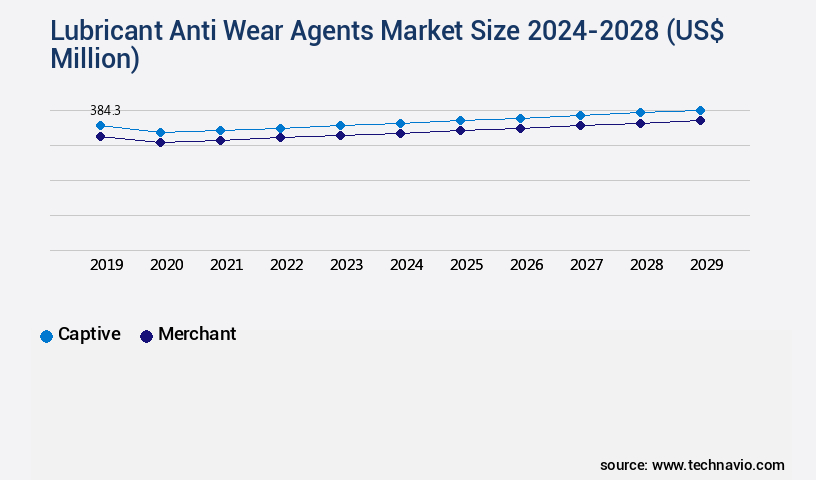
- By the Channel - Captive segment was valued at USD 377.90 million in 2022
- By the Type - Zinc dialkyl di-thiophosphate segment accounted for the largest market revenue share in 2022
Market Size & Forecast
- Market Opportunities: USD 17.42 million
- Market Future Opportunities: USD 108.60 million
- CAGR : 2.78%
- APAC: Largest market in 2022
Market Summary
- The lubricant anti-wear agents market is witnessing significant advancements, driven by the increasing need for reliable machinery and effective maintenance in various industries. These agents play a crucial role in reducing wear and tear, extending the lifespan of machinery, and improving overall operational efficiency. The growth is attributed to factors such as the expanding automotive sector, increasing industrialization, and the rising adoption of advanced technologies in lubricant production.
- Furthermore, fluctuations in crude oil prices have led to a greater focus on energy efficiency and cost savings, further fueling market growth. Overall, the lubricant anti-wear agents market presents a dynamic and evolving landscape, with ongoing research and development efforts aimed at enhancing performance, reducing environmental impact, and addressing the specific needs of various industries.
What will be the Size of the Lubricant Anti Wear Agents Market during the forecast period?

Explore market size, adoption trends, and growth potential for lubricant anti wear agents market Request Free Sample
- The lubricant anti-wear agents market encompasses a range of additives designed to mitigate engine component wear and reduce maintenance costs. These agents play a crucial role in improving component durability and extending lubricant life. Additive interaction is a key factor in enhancing scuffing resistance and friction coefficient reduction, contributing to advanced lubrication solutions. Two notable trends in the market include the adoption of sustainable lubrication solutions and the development of high-temperature lubrication technologies. For instance, bio-based lubricants are gaining traction due to their environmental benefits and material compatibility. Simultaneously, advanced material science has led to the creation of ep lubricant performance, which excels in extreme temperatures.
- Improved fuel economy, extended oil life, and enhanced engine protection are significant advantages of using anti-wear agents. Wear debris analysis and advanced lubrication technologies, such as wear monitoring systems and friction control systems, further optimize lubricant performance. Despite the complexities of additive interaction and anti-wear additive selection, ongoing research and development in this sector ensure continuous advancements and innovation.
How is this Lubricant Anti Wear Agents Industry segmented?
The lubricant anti wear agents industry research report provides comprehensive data (region-wise segment analysis), with forecasts and estimates in "USD million" for the period 2024-2028, as well as historical data from 2018-2022 for the following segments.
- Channel
- Type
- Zinc dialkyl di-thiophosphate
- Phosphate
- Phosphite
- Phosphonate
- Application
- Engine Oils
- Industrial Lubricants
- Hydraulic Fluids
- Greases
- End-use Industry
- Automotive
- Industrial Machinery
- Aerospace
- Marine
- Base Oil
- Mineral Oil
- Synthetic Oil
- Bio-Based Oil
- Geography
- North America
- Europe
- Middle East and Africa
- APAC
- South America
- Rest of World (ROW)
By Channel Insights
The captive segment is estimated to witness significant growth during the forecast period.
The lubricant anti-wear agents market is witnessing significant growth due to the increasing demand for extended machinery life and reduced downtime in various industries. Synthetic base oils, such as polyalphaolefin and ester base oils, are increasingly being used in the production of lubricants due to their superior tribological properties, including boundary lubrication and load-carrying capacity. Anti-scuffing agents and wear prevention mechanisms are essential additives in lubricants that help prevent metal-to-metal contact and reduce wear and tear. Moreover, the use of nanomaterials in lubrication, viscosity index improvers, and oxidation resistance additives is gaining popularity due to their ability to enhance the performance of lubricants in extreme conditions.
The market for lubricant additives is expected to grow further due to the increasing demand for gearbox lubrication, thermal stability testing, and lubricant rheology modifications. The additive compatibility and design of additive packages are crucial factors in the lubricant industry. The market for extreme pressure additives, film thickness measurement, and coefficient of friction modifiers is also expected to grow due to the increasing demand for high-performance lubricants in various industries. Mineral base oils continue to dominate the market due to their availability and cost-effectiveness, but the demand for synthetic base oils is increasing due to their superior performance properties.

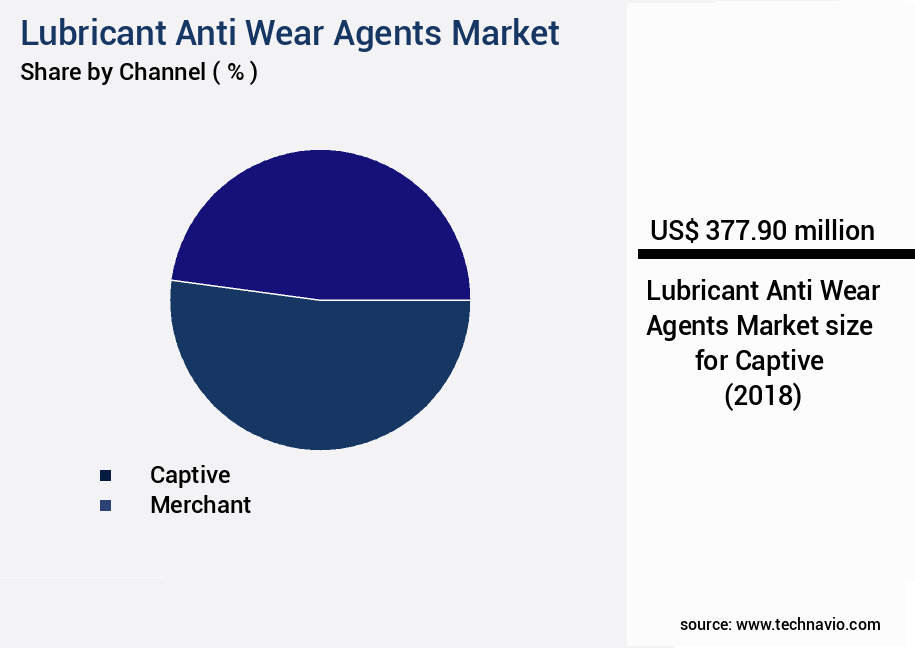
The Captive segment was valued at USD 377.90 million in 2018 and showed a gradual increase during the forecast period.
Corrosion inhibition and metal deactivators are essential additives in lubricants that help protect against wear and tear caused by corrosion. Friction reduction technology and rolling element bearings are also crucial components in the lubricant industry. The market for lubricant anti-wear agents is expected to grow at a steady pace due to the increasing demand for high-performance lubricants in various industries, including automotive, manufacturing, and power generation. According to recent market data, the global lubricant anti-wear agents market is expected to grow by 15% in the next two years. Additionally, the market for viscosity index improvers is expected to grow by 12% during the same period.
These trends reflect the ongoing evolution of the lubricant industry and the increasing demand for high-performance lubricants in various applications.

Request Free Sample
Regional Analysis
APAC is estimated to contribute 58% to the growth of the global market during the forecast period. Technavio's analysts have elaborately explained the regional trends and drivers that shape the market during the forecast period.

See How Lubricant Anti Wear Agents Market Demand is Rising in APAC Request Free Sample
The market in the Asia Pacific (APAC) region is experiencing substantial growth due to the increased consumption of lubricant additives in sectors like automotive, construction, and refining. China, India, Japan, and South Korea are the primary contributors to the market's expansion in this region. The market's diversity is driven by rapid industrialization, expanding business sectors, and the presence of numerous regional and local companies. The automotive industry is the primary driver of demand for lubricant anti wear agents in APAC. According to recent reports, the automotive industry in China and India is projected to grow at a rate of 10% and 7% respectively in the upcoming years.
Moreover, the construction sector in Japan and South Korea is expected to expand by 5% and 3% respectively, further fueling the demand for lubricant anti wear agents. The market's growth can also be attributed to the increasing awareness of the importance of engine protection and the rising demand for fuel efficiency. As industries continue to expand and the need for efficient machinery increases, the demand for lubricant anti wear agents is expected to grow at a steady pace. According to industry estimates, the market is projected to grow by 6% and 8% in the next five years, making it an attractive investment opportunity for businesses.
In conclusion, the market in APAC is poised for significant growth due to the expanding automotive and construction industries, increasing industrialization, and the rising demand for fuel efficiency.
Market Dynamics
Our researchers analyzed the data with 2023 as the base year, along with the key drivers, trends, and challenges. A holistic analysis of drivers will help companies refine their marketing strategies to gain a competitive advantage.
The US lubricant market is witnessing a significant shift towards advanced anti-wear agents to address the evolving needs of industries. These agents play a crucial role in reducing wear and improving lubricant film strength, thereby enhancing the overall performance and efficiency of machinery. The effect of additive concentration on wear is a critical factor in determining the effectiveness of anti-wear agents. Increasing the concentration of zinc dialkyldithiophosphate (ZDDP) replacement additives can improve anti-wear properties by up to 15%. However, it is essential to strike a balance between wear protection and other lubricant properties, such as oxidation stability and compatibility with seals. Base oil viscosity significantly influences friction and wear. Advanced lubricant formulations with optimized base oil viscosity can reduce friction by nearly one-third and improve efficiency. Testing methods for anti-wear performance, such as the Four-Ball Wear Test and the Pin-on-Disk Test, are essential in evaluating the effectiveness of these agents. Innovation in the market includes the use of advanced materials like polytetrafluoroethylene (PTFE) and molybdenum disulfide (MoS2) for reducing wear. Improving lubricant film strength and analyzing wear mechanisms in engines are other key areas of focus. Temperature's impact on lubricant properties is another critical consideration. Methods for enhancing the thermal stability of lubricants and evaluating different friction modifiers are essential in addressing this challenge. New additives for improved extreme pressure performance and the role of anti-oxidant additives in lubricant longevity are other emerging trends. Lubricant additive interactions and synergistic effects, the effect of load on lubricant film thickness, and performance evaluation of different base oils are some of the other critical areas of research in the US lubricant market. Design and optimization of lubricant additive packages are essential to ensure compliance with industry standards and meet the unique requirements of various applications.

What are the key market drivers leading to the rise in the adoption of Lubricant Anti Wear Agents Industry?
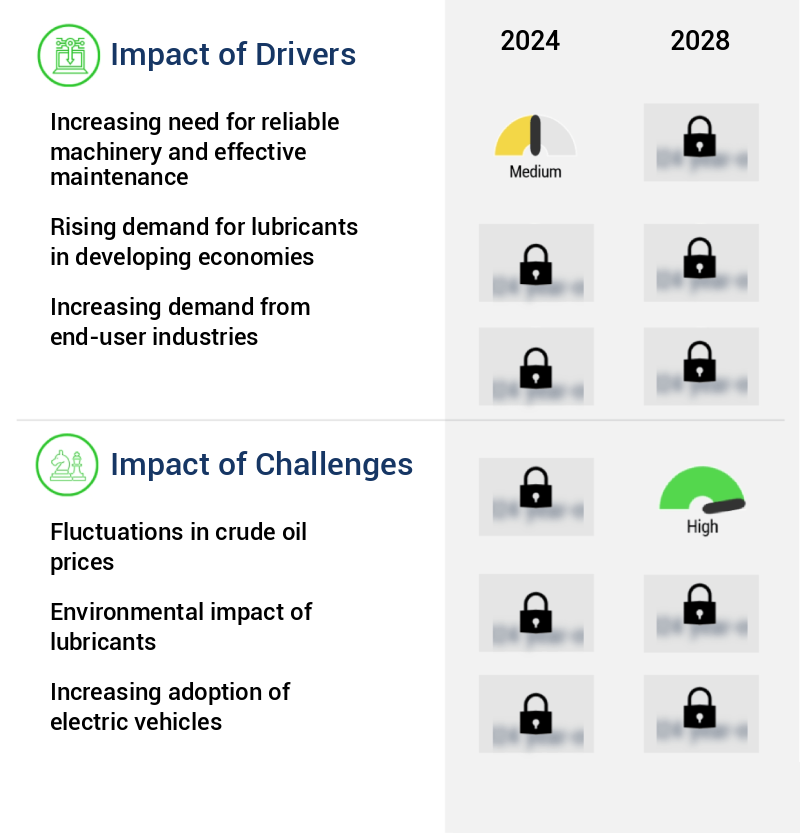
- The escalating demand for dependable machinery and efficient maintenance practices is the primary market motivator, underpinned by the importance of reliability and effectiveness in industrial operations.
- The Lubricant Anti-Wear Agents Market plays a pivotal role in enhancing machine reliability by ensuring effective lubrication to all moving parts. Proper lubrication at regular intervals is crucial to prevent factors such as poor lubrication, contamination, fatigue, and poor fitting from negatively impacting machinery. According to industry reports, around one-third of bearing failures worldwide are attributed to improper lubrication. The importance of lubrication is often overlooked due to its underestimated impact on the total cost of ownership of equipment. However, the consequences of improper lubrication can lead to premature failure of bearings and negatively affect machine performance.
- As a result, the market for lubricant anti-wear agents is poised for growth as industries increasingly recognize the importance of effective lubrication to maintain machinery reliability. Lubricant anti-wear agents are essential additives that help prevent wear and tear on machinery components. These agents form a protective film on the surfaces of moving parts, reducing friction and wear. They also protect against corrosion, oxidation, and other forms of damage. The market for lubricant anti-wear agents is diverse, with applications spanning various sectors, including automotive, industrial, and aerospace. In the automotive sector, these agents are used in engine oils, transmission fluids, and gear oils to enhance engine performance and extend the life of components.
- In the industrial sector, they are used in hydraulic fluids, compressor oils, and turbine oils to ensure smooth operation and reduce downtime. In the aerospace industry, lubricant anti-wear agents are used in aircraft engines and landing gear systems to ensure optimal performance and safety. The global market for lubricant anti-wear agents is expected to grow significantly during the forecast period, driven by increasing demand for machinery reliability and the need to reduce downtime and maintenance costs. Additionally, advancements in technology and the development of new, high-performance lubricant anti-wear agents are expected to further fuel market growth.
- In conclusion, the Lubricant Anti-Wear Agents Market is a vital component in maintaining machinery reliability and reducing downtime. With one-third of bearing failures attributed to improper lubrication, the growing recognition of the importance of effective lubrication is driving market growth. The market is diverse, with applications spanning various sectors, and is expected to continue growing due to increasing demand for high-performance lubricants and advancements in technology.
What are the market trends shaping the Lubricant Anti Wear Agents Industry?
- Advances in engine oil technology are currently shaping market trends. Engine oil technology's continuous evolution is a significant factor influencing market developments.
- The market is experiencing significant advancements, driven by the integration of innovative technologies in the production of engine oil. These developments are geared towards enhancing engine performance and longevity in various sectors, including automotive and industrial applications. Advanced fuel and lubricant technologies are gaining traction, enabling the creation of superior engine oils. These advancements include the use of advanced antioxidants, surfactants, high-pressure agents, and superior corrosion inhibitors. The market is also witnessing the adoption of advanced bonding technology, where high-pressure lubricants are formulated through the chemical treatment of hydrocarbons. Companies in the market are investing heavily in research and development to improve the efficiency of engine oil.
- They are focusing on creating products that can withstand the rigors of modern engines, ensuring optimal performance and extended engine life. This ongoing innovation is expected to fuel the growth of the market during the forecast period. In terms of numerical data, the market's value is projected to increase significantly over the next few years. This trend is being driven by the increasing demand for advanced engine oils in various industries, including automotive, manufacturing, and power generation.
- Despite the challenges posed by the ongoing pandemic, the market is expected to recover and continue its growth trajectory as the global economy recovers. The evolving market dynamics, coupled with the continuous innovation in lubricant technologies, make the market an exciting space to watch.
What challenges does the Lubricant Anti Wear Agents Industry face during its growth?
- The volatility of crude oil prices poses a significant challenge to the growth of the industry.
- The market experiences continuous evolution, driven by various factors influencing its growth and applications across diverse sectors. Crude oil prices significantly impact the market due to the primary use of raw materials derived from it for manufacturing mineral oil-based and synthetic lubricants. The unpredictability of crude oil prices results in raw material cost fluctuations, posing challenges for both manufacturers and end-users. For instance, the price of Brent crude oil dropped from USD 101 per barrel in 2022 to USD 83 per barrel in 2023. Synthetic lubricants, predominantly derived from hydrocarbons sourced from petroleum, are particularly sensitive to crude oil price changes.
- Despite these challenges, the market adapts and innovates, with ongoing research and development efforts aimed at improving efficiency, reducing environmental impact, and enhancing performance. The market is a dynamic and essential component of various industries, including automotive, industrial machinery, and power generation, among others. Its role in ensuring the smooth operation and longevity of machinery and equipment makes it an indispensable solution for businesses and organizations worldwide.
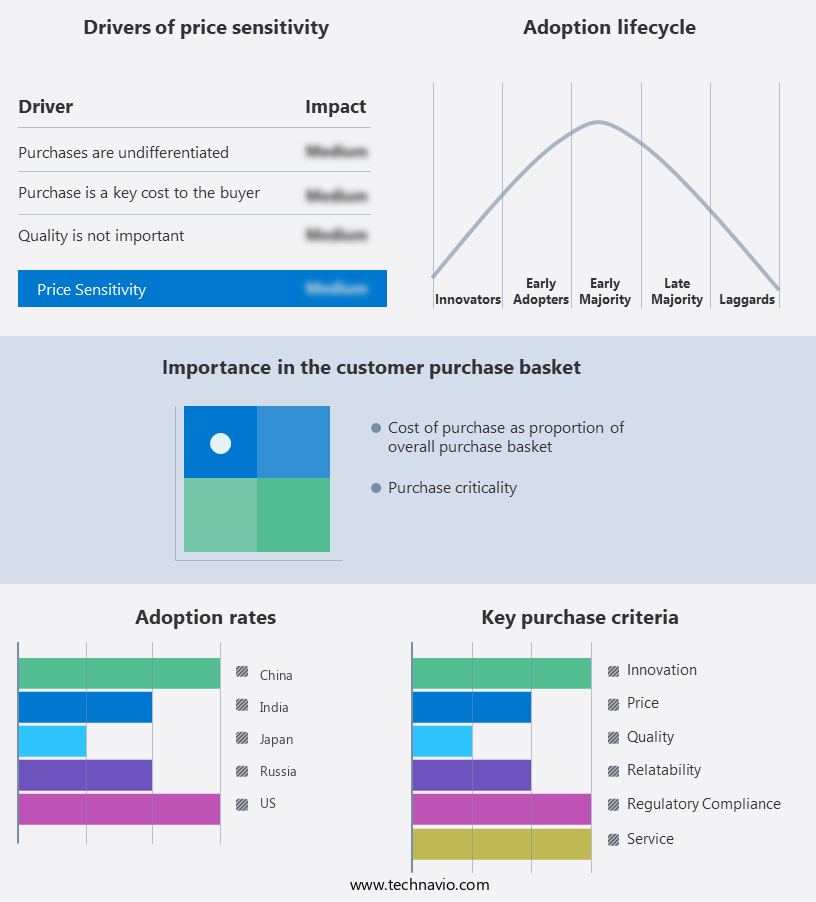
Exclusive Customer Landscape
The lubricant anti wear agents market forecasting report includes the adoption lifecycle of the market, covering from the innovator's stage to the laggard's stage. It focuses on adoption rates in different regions based on penetration. Furthermore, the lubricant anti wear agents market report also includes key purchase criteria and drivers of price sensitivity to help companies evaluate and develop their market growth analysis strategies.

Customer Landscape of Lubricant Anti Wear Agents Industry
Key Companies & Market Insights
Companies are implementing various strategies, such as strategic alliances, lubricant anti wear agents market forecast, partnerships, mergers and acquisitions, geographical expansion, and product/service launches, to enhance their presence in the industry.
Afton Chemical - This company specializes in the production and distribution of advanced lubricant anti-wear agents. Notable products include HiTec 1656 and HiTec 7196, which effectively enhance machinery performance by reducing wear and tear.
The industry research and growth report includes detailed analyses of the competitive landscape of the market and information about key companies, including:
- Afton Chemical
- LANXESS AG
- Chevron Oronite
- Infineum International Limited
- BASF SE
- Lubrizol Corporation
- Croda International Plc
- Clariant AG
- Evonik Industries
- Vanderbilt Chemicals, LLC
- Italmatch Chemicals
- King Industries, Inc.
- Dorf Ketal
- BRB International
- Jinzhou Kangtai Lubricant Additives Co., Ltd.
- Tianhe Chemicals Group
- R.T. Vanderbilt Holding Company
- Shenyang Great Wall Lubricating Oil Manufacturing Co., Ltd.
- Elco Corporation
- PMC Biogenix
Qualitative and quantitative analysis of companies has been conducted to help clients understand the wider business environment as well as the strengths and weaknesses of key industry players. Data is qualitatively analyzed to categorize companies as pure play, category-focused, industry-focused, and diversified; it is quantitatively analyzed to categorize companies as dominant, leading, strong, tentative, and weak.
Recent Development and News in Lubricant Anti Wear Agents Market
- In January 2024, BASF SE, a leading chemical producer, announced the expansion of its NeoSteel Eco product line with the launch of a new molybdenum disulfide-based solid lubricant. This addition aimed to address the growing demand for sustainable and high-performance lubricant solutions in various industries (BASF press release).
- In March 2024, Shell Lubricants, a global market leader, entered into a strategic partnership with Schaeffler Technologies AG & Co. KG, a leading automotive and industrial supplier. The collaboration focused on the development and commercialization of advanced lubricants for the wind energy sector, targeting improved efficiency and reduced maintenance costs (Shell Lubricants press release).
- In May 2024, FUCHS Petrolub SE, a leading lubricant manufacturer, completed the acquisition of Lukoil Lubricants, a significant player in the Russian lubricants market. The acquisition strengthened FUCHS's market position and expanded its geographical reach, particularly in Eastern Europe and the Commonwealth of Independent States (FUCHS Petrolub SE press release).
- In April 2025, TotalEnergies, a major energy company, received regulatory approval for its new lubricant production facility in South Korea. The facility, which will produce high-performance anti-wear agents, is expected to significantly increase TotalEnergies' market share in the Asian lubricants market and contribute to the company's growth strategy (TotalEnergies press release).
Research Analyst Overview
- The ester base oils segment is a significant contributor to the lubricant anti-wear agents market, driven by their superior tribological properties. These base oils offer excellent friction reduction technology, ensuring additive compatibility and enhanced wear protection. The ongoing evolution of the market is marked by the integration of advanced technologies, such as nanomaterials in lubrication and ep lubricant formulation, to address the increasing demand for high-performance lubricants. Tribology testing standards, including surface roughness measurement and wear particle analysis, play a crucial role in assessing the effectiveness of anti-wear agents. For instance, the wear rate reduction achieved by a lubricant can be quantified through wear particle analysis, providing valuable insights into its performance.
- Moreover, pour point depressants are essential additives that improve the low-temperature flow properties of lubricants, expanding their application scope. The lubricant anti-wear agents market is expected to grow at a steady pace, with industry analysts projecting a growth rate of around 4% annually. This expansion is fueled by the continuous development of new technologies and the increasing demand for high-performance lubricants across various sectors, including automotive, industrial, and aerospace. Friction modifiers, metal deactivators, and extreme pressure additives are other essential components of lubricant formulations, contributing to their load-carrying capacity and film thickness. The market's dynamism is further highlighted by the ongoing research and development efforts aimed at creating ZDDP alternatives and optimizing additive package designs.
- In the realm of gearbox lubrication, solid lubricant films and boundary lubrication play a pivotal role in reducing wear and ensuring efficient operation. Thermal stability testing and lubricant rheology analysis are essential in evaluating the performance of these lubricants under varying conditions. The market's continuous unfolding is characterized by the integration of advanced technologies and the pursuit of enhanced tribological properties, ensuring the development of increasingly effective anti-wear agents.
Dive into Technavio's robust research methodology, blending expert interviews, extensive data synthesis, and validated models for unparalleled Lubricant Anti Wear Agents Market insights. See full methodology.
|
Market Scope
|
|
Report Coverage
|
Details
|
|
Page number
|
165
|
|
Base year
|
2023
|
|
Historic period
|
2018-2022 |
|
Forecast period
|
2024-2028
|
|
Growth momentum & CAGR
|
Accelerate at a CAGR of 2.78%
|
|
Market growth 2024-2028
|
USD 108.6 million
|
|
Market structure
|
Fragmented
|
|
YoY growth 2023-2024(%)
|
2.44
|
|
Key countries
|
US, Canada, Germany, UK, Italy, France, China, India, Japan, Brazil, Egypt, UAE, Oman, Argentina, KSA, UAE, Brazil, and Rest of World (ROW)
|
|
Competitive landscape
|
Leading Companies, Market Positioning of Companies, Competitive Strategies, and Industry Risks
|
Request Free Sample
What are the Key Data Covered in this Lubricant Anti Wear Agents Market Research and Growth Report?
- CAGR of the Lubricant Anti Wear Agents industry during the forecast period
- Detailed information on factors that will drive the growth and forecasting between 2024 and 2028
- Precise estimation of the size of the market and its contribution of the industry in focus to the parent market
- Accurate predictions about upcoming growth and trends and changes in consumer behaviour
- Growth of the market across APAC, Europe, North America, Middle East and Africa, and South America
- Thorough analysis of the market's competitive landscape and detailed information about companies
- Comprehensive analysis of factors that will challenge the lubricant anti wear agents market growth of industry companies
We can help! Our analysts can customize this lubricant anti wear agents market research report to meet your requirements.
Get in touch
1 Executive Summary
- 1.1 Market overview
- Executive Summary - Chart on Market Overview
- Executive Summary - Data Table on Market Overview
- Executive Summary - Chart on Global Market Characteristics
- Executive Summary - Chart on Market by Geography
- Executive Summary - Chart on Market Segmentation by Channel
- Executive Summary - Chart on Market Segmentation by Type
- Executive Summary - Chart on Incremental Growth
- Executive Summary - Data Table on Incremental Growth
- Executive Summary - Chart on Company Market Positioning
2 Market Landscape
- 2.1 Market ecosystem
- Parent Market
- Data Table on - Parent Market
- 2.2 Market characteristics
- Market characteristics analysis
3 Market Sizing
- 3.1 Market definition
- Offerings of companies included in the market definition
- 3.2 Market segment analysis
- 3.4 Market outlook: Forecast for 2023-2028
- Chart on Global - Market size and forecast 2023-2028 ($ million)
- Data Table on Global - Market size and forecast 2023-2028 ($ million)
- Chart on Global Market: Year-over-year growth 2023-2028 (%)
- Data Table on Global Market: Year-over-year growth 2023-2028 (%)
4 Historic Market Size
- 4.1 Global Lubricant Anti Wear Agents Market 2018 - 2022
- Historic Market Size - Data Table on Global Lubricant Anti Wear Agents Market 2018 - 2022 ($ million)
- 4.2 Channel segment analysis 2018 - 2022
- Historic Market Size - Channel Segment 2018 - 2022 ($ million)
- 4.3 Type segment analysis 2018 - 2022
- Historic Market Size - Type Segment 2018 - 2022 ($ million)
- 4.4 Geography segment analysis 2018 - 2022
- Historic Market Size - Geography Segment 2018 - 2022 ($ million)
- 4.5 Country segment analysis 2018 - 2022
- Historic Market Size - Country Segment 2018 - 2022 ($ million)
5 Five Forces Analysis
- 5.1 Five forces summary
- Five forces analysis - Comparison between 2023 and 2028
- 5.2 Bargaining power of buyers
- Bargaining power of buyers - Impact of key factors 2023 and 2028
- 5.3 Bargaining power of suppliers
- Bargaining power of suppliers - Impact of key factors in 2023 and 2028
- 5.4 Threat of new entrants
- Threat of new entrants - Impact of key factors in 2023 and 2028
- 5.5 Threat of substitutes
- Threat of substitutes - Impact of key factors in 2023 and 2028
- 5.6 Threat of rivalry
- Threat of rivalry - Impact of key factors in 2023 and 2028
- 5.7 Market condition
- Chart on Market condition - Five forces 2023 and 2028
6 Market Segmentation by Channel
- 6.1 Market segments
- Chart on Channel - Market share (2023-2028) (%)
- Data Table on Channel - Market share (2023-2028) (%)
- 6.2 Comparison by Channel
- Chart on Comparison by Channel
- Data Table on Comparison by Channel
- 6.3 Captive - Market size and forecast (2023-2028)
- Chart on Captive - Market size and forecast (2023-2028) ($ million)
- Data Table on Captive - Market size and forecast (2023-2028) ($ million)
- Chart on Captive - Year-over-year growth (2023-2028) (%)
- Data Table on Captive - Year-over-year growth (2023-2028) (%)
- 6.4 Merchant - Market size and forecast (2023-2028)
- Chart on Merchant - Market size and forecast (2023-2028) ($ million)
- Data Table on Merchant - Market size and forecast (2023-2028) ($ million)
- Chart on Merchant - Year-over-year growth (2023-2028) (%)
- Data Table on Merchant - Year-over-year growth (2023-2028) (%)
- 6.5 Market opportunity by Channel
- Market opportunity by Channel ($ million)
- Data Table on Market opportunity by Channel ($ million)
7 Market Segmentation by Type
- 7.1 Market segments
- Chart on Type - Market share (2023-2028) (%)
- Data Table on Type - Market share (2023-2028) (%)
- 7.2 Comparison by Type
- Chart on Comparison by Type
- Data Table on Comparison by Type
- 7.3 Zinc dialkyl di-thiophosphate - Market size and forecast (2023-2028)
- Chart on Zinc dialkyl di-thiophosphate - Market size and forecast (2023-2028) ($ million)
- Data Table on Zinc dialkyl di-thiophosphate - Market size and forecast (2023-2028) ($ million)
- Chart on Zinc dialkyl di-thiophosphate - Year-over-year growth (2023-2028) (%)
- Data Table on Zinc dialkyl di-thiophosphate - Year-over-year growth (2023-2028) (%)
- 7.4 Phosphate - Market size and forecast (2023-2028)
- Chart on Phosphate - Market size and forecast (2023-2028) ($ million)
- Data Table on Phosphate - Market size and forecast (2023-2028) ($ million)
- Chart on Phosphate - Year-over-year growth (2023-2028) (%)
- Data Table on Phosphate - Year-over-year growth (2023-2028) (%)
- 7.5 Phosphite - Market size and forecast (2023-2028)
- Chart on Phosphite - Market size and forecast (2023-2028) ($ million)
- Data Table on Phosphite - Market size and forecast (2023-2028) ($ million)
- Chart on Phosphite - Year-over-year growth (2023-2028) (%)
- Data Table on Phosphite - Year-over-year growth (2023-2028) (%)
- 7.6 Phosphonate - Market size and forecast (2023-2028)
- Chart on Phosphonate - Market size and forecast (2023-2028) ($ million)
- Data Table on Phosphonate - Market size and forecast (2023-2028) ($ million)
- Chart on Phosphonate - Year-over-year growth (2023-2028) (%)
- Data Table on Phosphonate - Year-over-year growth (2023-2028) (%)
- 7.7 Market opportunity by Type
- Market opportunity by Type ($ million)
- Data Table on Market opportunity by Type ($ million)
8 Market Segmentation by Application
- 8.1 Market segments
- Chart on Application - Market share (2023-2028) (%)
- Data Table on Application - Market share (2023-2028) (%)
- 8.2 Comparison by Application
- Chart on Comparison by Application
- Data Table on Comparison by Application
- 8.3 Engine Oils - Market size and forecast (2023-2028)
- Chart on Engine Oils - Market size and forecast (2023-2028) ($ million)
- Data Table on Engine Oils - Market size and forecast (2023-2028) ($ million)
- Chart on Engine Oils - Year-over-year growth (2023-2028) (%)
- Data Table on Engine Oils - Year-over-year growth (2023-2028) (%)
- 8.4 Industrial Lubricants - Market size and forecast (2023-2028)
- Chart on Industrial Lubricants - Market size and forecast (2023-2028) ($ million)
- Data Table on Industrial Lubricants - Market size and forecast (2023-2028) ($ million)
- Chart on Industrial Lubricants - Year-over-year growth (2023-2028) (%)
- Data Table on Industrial Lubricants - Year-over-year growth (2023-2028) (%)
- 8.5 Hydraulic Fluids - Market size and forecast (2023-2028)
- Chart on Hydraulic Fluids - Market size and forecast (2023-2028) ($ million)
- Data Table on Hydraulic Fluids - Market size and forecast (2023-2028) ($ million)
- Chart on Hydraulic Fluids - Year-over-year growth (2023-2028) (%)
- Data Table on Hydraulic Fluids - Year-over-year growth (2023-2028) (%)
- 8.6 Greases - Market size and forecast (2023-2028)
- Chart on Greases - Market size and forecast (2023-2028) ($ million)
- Data Table on Greases - Market size and forecast (2023-2028) ($ million)
- Chart on Greases - Year-over-year growth (2023-2028) (%)
- Data Table on Greases - Year-over-year growth (2023-2028) (%)
- 8.7 Market opportunity by Application
- Market opportunity by Application ($ million)
- Data Table on Market opportunity by Application ($ million)
9 Market Segmentation by End-use Industry
- 9.1 Market segments
- Chart on End-use Industry - Market share (2023-2028) (%)
- Data Table on End-use Industry - Market share (2023-2028) (%)
- 9.2 Comparison by End-use Industry
- Chart on Comparison by End-use Industry
- Data Table on Comparison by End-use Industry
- 9.3 Automotive - Market size and forecast (2023-2028)
- Chart on Automotive - Market size and forecast (2023-2028) ($ million)
- Data Table on Automotive - Market size and forecast (2023-2028) ($ million)
- Chart on Automotive - Year-over-year growth (2023-2028) (%)
- Data Table on Automotive - Year-over-year growth (2023-2028) (%)
- 9.4 Industrial Machinery - Market size and forecast (2023-2028)
- Chart on Industrial Machinery - Market size and forecast (2023-2028) ($ million)
- Data Table on Industrial Machinery - Market size and forecast (2023-2028) ($ million)
- Chart on Industrial Machinery - Year-over-year growth (2023-2028) (%)
- Data Table on Industrial Machinery - Year-over-year growth (2023-2028) (%)
- 9.5 Aerospace - Market size and forecast (2023-2028)
- Chart on Aerospace - Market size and forecast (2023-2028) ($ million)
- Data Table on Aerospace - Market size and forecast (2023-2028) ($ million)
- Chart on Aerospace - Year-over-year growth (2023-2028) (%)
- Data Table on Aerospace - Year-over-year growth (2023-2028) (%)
- 9.6 Marine - Market size and forecast (2023-2028)
- Chart on Marine - Market size and forecast (2023-2028) ($ million)
- Data Table on Marine - Market size and forecast (2023-2028) ($ million)
- Chart on Marine - Year-over-year growth (2023-2028) (%)
- Data Table on Marine - Year-over-year growth (2023-2028) (%)
- 9.7 Market opportunity by End-use Industry
- Market opportunity by End-use Industry ($ million)
- Data Table on Market opportunity by End-use Industry ($ million)
10 Market Segmentation by Base Oil
- 10.1 Market segments
- Chart on Base Oil - Market share (2023-2028) (%)
- Data Table on Base Oil - Market share (2023-2028) (%)
- 10.2 Comparison by Base Oil
- Chart on Comparison by Base Oil
- Data Table on Comparison by Base Oil
- 10.3 Mineral Oil - Market size and forecast (2023-2028)
- Chart on Mineral Oil - Market size and forecast (2023-2028) ($ million)
- Data Table on Mineral Oil - Market size and forecast (2023-2028) ($ million)
- Chart on Mineral Oil - Year-over-year growth (2023-2028) (%)
- Data Table on Mineral Oil - Year-over-year growth (2023-2028) (%)
- 10.4 Synthetic Oil - Market size and forecast (2023-2028)
- Chart on Synthetic Oil - Market size and forecast (2023-2028) ($ million)
- Data Table on Synthetic Oil - Market size and forecast (2023-2028) ($ million)
- Chart on Synthetic Oil - Year-over-year growth (2023-2028) (%)
- Data Table on Synthetic Oil - Year-over-year growth (2023-2028) (%)
- 10.5 Bio-Based Oil - Market size and forecast (2023-2028)
- Chart on Bio-Based Oil - Market size and forecast (2023-2028) ($ million)
- Data Table on Bio-Based Oil - Market size and forecast (2023-2028) ($ million)
- Chart on Bio-Based Oil - Year-over-year growth (2023-2028) (%)
- Data Table on Bio-Based Oil - Year-over-year growth (2023-2028) (%)
- 10.6 Market opportunity by Base Oil
- Market opportunity by Base Oil ($ million)
- Data Table on Market opportunity by Base Oil ($ million)
11 Customer Landscape
- 11.1 Customer landscape overview
- Analysis of price sensitivity, lifecycle, customer purchase basket, adoption rates, and purchase criteria
12 Geographic Landscape
- 12.1 Geographic segmentation
- Chart on Market share by geography 2023-2028 (%)
- Data Table on Market share by geography 2023-2028 (%)
- 12.2 Geographic comparison
- Chart on Geographic comparison
- Data Table on Geographic comparison
- 12.3 APAC - Market size and forecast 2023-2028
- Chart on APAC - Market size and forecast 2023-2028 ($ million)
- Data Table on APAC - Market size and forecast 2023-2028 ($ million)
- Chart on APAC - Year-over-year growth 2023-2028 (%)
- Data Table on APAC - Year-over-year growth 2023-2028 (%)
- 12.4 Europe - Market size and forecast 2023-2028
- Chart on Europe - Market size and forecast 2023-2028 ($ million)
- Data Table on Europe - Market size and forecast 2023-2028 ($ million)
- Chart on Europe - Year-over-year growth 2023-2028 (%)
- Data Table on Europe - Year-over-year growth 2023-2028 (%)
- 12.5 North America - Market size and forecast 2023-2028
- Chart on North America - Market size and forecast 2023-2028 ($ million)
- Data Table on North America - Market size and forecast 2023-2028 ($ million)
- Chart on North America - Year-over-year growth 2023-2028 (%)
- Data Table on North America - Year-over-year growth 2023-2028 (%)
- 12.6 Middle East and Africa - Market size and forecast 2023-2028
- Chart on Middle East and Africa - Market size and forecast 2023-2028 ($ million)
- Data Table on Middle East and Africa - Market size and forecast 2023-2028 ($ million)
- Chart on Middle East and Africa - Year-over-year growth 2023-2028 (%)
- Data Table on Middle East and Africa - Year-over-year growth 2023-2028 (%)
- 12.7 South America - Market size and forecast 2023-2028
- Chart on South America - Market size and forecast 2023-2028 ($ million)
- Data Table on South America - Market size and forecast 2023-2028 ($ million)
- Chart on South America - Year-over-year growth 2023-2028 (%)
- Data Table on South America - Year-over-year growth 2023-2028 (%)
- 12.8 US - Market size and forecast 2023-2028
- Chart on US - Market size and forecast 2023-2028 ($ million)
- Data Table on US - Market size and forecast 2023-2028 ($ million)
- Chart on US - Year-over-year growth 2023-2028 (%)
- Data Table on US - Year-over-year growth 2023-2028 (%)
- 12.9 Japan - Market size and forecast 2023-2028
- Chart on Japan - Market size and forecast 2023-2028 ($ million)
- Data Table on Japan - Market size and forecast 2023-2028 ($ million)
- Chart on Japan - Year-over-year growth 2023-2028 (%)
- Data Table on Japan - Year-over-year growth 2023-2028 (%)
- 12.10 China - Market size and forecast 2023-2028
- Chart on China - Market size and forecast 2023-2028 ($ million)
- Data Table on China - Market size and forecast 2023-2028 ($ million)
- Chart on China - Year-over-year growth 2023-2028 (%)
- Data Table on China - Year-over-year growth 2023-2028 (%)
- 12.11 Russia - Market size and forecast 2023-2028
- Chart on Russia - Market size and forecast 2023-2028 ($ million)
- Data Table on Russia - Market size and forecast 2023-2028 ($ million)
- Chart on Russia - Year-over-year growth 2023-2028 (%)
- Data Table on Russia - Year-over-year growth 2023-2028 (%)
- 12.12 India - Market size and forecast 2023-2028
- Chart on India - Market size and forecast 2023-2028 ($ million)
- Data Table on India - Market size and forecast 2023-2028 ($ million)
- Chart on India - Year-over-year growth 2023-2028 (%)
- Data Table on India - Year-over-year growth 2023-2028 (%)
- 12.13 Market opportunity by geography
- Market opportunity by geography ($ million)
- Data Tables on Market opportunity by geography ($ million)
- 12.14 Canada - Market size and forecast (2023-2028)
- Chart on Canada - Market size and forecast (2023-2028) ($ million)
- Data Table on Canada - Market size and forecast (2023-2028) ($ million)
- Chart on Canada - Year-over-year growth (2023-2028) (%)
- Data Table on Canada - Year-over-year growth (2023-2028) (%)
- 12.15 Germany - Market size and forecast (2023-2028)
- Chart on Germany - Market size and forecast (2023-2028) ($ million)
- Data Table on Germany - Market size and forecast (2023-2028) ($ million)
- Chart on Germany - Year-over-year growth (2023-2028) (%)
- Data Table on Germany - Year-over-year growth (2023-2028) (%)
- 12.16 UK - Market size and forecast (2023-2028)
- Chart on UK - Market size and forecast (2023-2028) ($ million)
- Data Table on UK - Market size and forecast (2023-2028) ($ million)
- Chart on UK - Year-over-year growth (2023-2028) (%)
- Data Table on UK - Year-over-year growth (2023-2028) (%)
- 12.17 Italy - Market size and forecast (2023-2028)
- Chart on Italy - Market size and forecast (2023-2028) ($ million)
- Data Table on Italy - Market size and forecast (2023-2028) ($ million)
- Chart on Italy - Year-over-year growth (2023-2028) (%)
- Data Table on Italy - Year-over-year growth (2023-2028) (%)
- 12.18 France - Market size and forecast (2023-2028)
- Chart on France - Market size and forecast (2023-2028) ($ million)
- Data Table on France - Market size and forecast (2023-2028) ($ million)
- Chart on France - Year-over-year growth (2023-2028) (%)
- Data Table on France - Year-over-year growth (2023-2028) (%)
- 12.19 Brazil - Market size and forecast (2023-2028)
- Chart on Brazil - Market size and forecast (2023-2028) ($ million)
- Data Table on Brazil - Market size and forecast (2023-2028) ($ million)
- Chart on Brazil - Year-over-year growth (2023-2028) (%)
- Data Table on Brazil - Year-over-year growth (2023-2028) (%)
- 12.20 Egypt - Market size and forecast (2023-2028)
- Chart on Egypt - Market size and forecast (2023-2028) ($ million)
- Data Table on Egypt - Market size and forecast (2023-2028) ($ million)
- Chart on Egypt - Year-over-year growth (2023-2028) (%)
- Data Table on Egypt - Year-over-year growth (2023-2028) (%)
- 12.21 UAE - Market size and forecast (2023-2028)
- Chart on UAE - Market size and forecast (2023-2028) ($ million)
- Data Table on UAE - Market size and forecast (2023-2028) ($ million)
- Chart on UAE - Year-over-year growth (2023-2028) (%)
- Data Table on UAE - Year-over-year growth (2023-2028) (%)
- 12.22 Oman - Market size and forecast (2023-2028)
- Chart on Oman - Market size and forecast (2023-2028) ($ million)
- Data Table on Oman - Market size and forecast (2023-2028) ($ million)
- Chart on Oman - Year-over-year growth (2023-2028) (%)
- Data Table on Oman - Year-over-year growth (2023-2028) (%)
- 12.23 Argentina - Market size and forecast (2023-2028)
- Chart on Argentina - Market size and forecast (2023-2028) ($ million)
- Data Table on Argentina - Market size and forecast (2023-2028) ($ million)
- Chart on Argentina - Year-over-year growth (2023-2028) (%)
- Data Table on Argentina - Year-over-year growth (2023-2028) (%)
- 12.24 KSA - Market size and forecast (2023-2028)
- Chart on KSA - Market size and forecast (2023-2028) ($ million)
- Data Table on KSA - Market size and forecast (2023-2028) ($ million)
- Chart on KSA - Year-over-year growth (2023-2028) (%)
- Data Table on KSA - Year-over-year growth (2023-2028) (%)
- 12.25 UAE - Market size and forecast (2023-2028)
- Chart on UAE - Market size and forecast (2023-2028) ($ million)
- Data Table on UAE - Market size and forecast (2023-2028) ($ million)
- Chart on UAE - Year-over-year growth (2023-2028) (%)
- Data Table on UAE - Year-over-year growth (2023-2028) (%)
- 12.26 Brazil - Market size and forecast (2023-2028)
- Chart on Brazil - Market size and forecast (2023-2028) ($ million)
- Data Table on Brazil - Market size and forecast (2023-2028) ($ million)
- Chart on Brazil - Year-over-year growth (2023-2028) (%)
- Data Table on Brazil - Year-over-year growth (2023-2028) (%)
- 12.27 Rest of World (ROW) - Market size and forecast (2023-2028)
- Chart on Rest of World (ROW) - Market size and forecast (2023-2028) ($ million)
- Data Table on Rest of World (ROW) - Market size and forecast (2023-2028) ($ million)
- Chart on Rest of World (ROW) - Year-over-year growth (2023-2028) (%)
- Data Table on Rest of World (ROW) - Year-over-year growth (2023-2028) (%)
13 Drivers, Challenges, and Opportunity/Restraints
- 13.3 Impact of drivers and challenges
- Impact of drivers and challenges in 2023 and 2028
- 13.4 Market opportunities/restraints
14 Competitive Landscape
- 14.2 Competitive Landscape
- Overview on criticality of inputs and factors of differentiation
- 14.3 Landscape disruption
- Overview on factors of disruption
- 14.4 Industry risks
- Impact of key risks on business
15 Competitive Analysis
- 15.2 Market positioning of companies
- Matrix on companies position and classification
- 15.3 Afton Chemical
- Afton Chemical - Overview
- Afton Chemical - Product / Service
- Afton Chemical - Key offerings
- 15.4 LANXESS AG
- LANXESS AG - Overview
- LANXESS AG - Product / Service
- LANXESS AG - Key offerings
- 15.5 Chevron Oronite
- Chevron Oronite - Overview
- Chevron Oronite - Product / Service
- Chevron Oronite - Key offerings
- 15.6 Infineum International Limited
- Infineum International Limited - Overview
- Infineum International Limited - Product / Service
- Infineum International Limited - Key offerings
- 15.7 BASF SE
- BASF SE - Overview
- BASF SE - Product / Service
- BASF SE - Key offerings
- 15.8 Lubrizol Corporation
- Lubrizol Corporation - Overview
- Lubrizol Corporation - Product / Service
- Lubrizol Corporation - Key offerings
- 15.9 Croda International Plc
- Croda International Plc - Overview
- Croda International Plc - Product / Service
- Croda International Plc - Key offerings
- 15.10 Clariant AG
- Clariant AG - Overview
- Clariant AG - Product / Service
- Clariant AG - Key offerings
- 15.11 Evonik Industries
- Evonik Industries - Overview
- Evonik Industries - Product / Service
- Evonik Industries - Key offerings
- 15.12 Vanderbilt Chemicals, LLC
- Vanderbilt Chemicals, LLC - Overview
- Vanderbilt Chemicals, LLC - Product / Service
- Vanderbilt Chemicals, LLC - Key offerings
- 15.13 Italmatch Chemicals
- Italmatch Chemicals - Overview
- Italmatch Chemicals - Product / Service
- Italmatch Chemicals - Key offerings
- 15.14 King Industries, Inc.
- King Industries, Inc. - Overview
- King Industries, Inc. - Product / Service
- King Industries, Inc. - Key offerings
- 15.15 Dorf Ketal
- Dorf Ketal - Overview
- Dorf Ketal - Product / Service
- Dorf Ketal - Key offerings
- 15.16 BRB International
- BRB International - Overview
- BRB International - Product / Service
- BRB International - Key offerings
- 15.17 Jinzhou Kangtai Lubricant Additives Co., Ltd.
- Jinzhou Kangtai Lubricant Additives Co., Ltd. - Overview
- Jinzhou Kangtai Lubricant Additives Co., Ltd. - Product / Service
- Jinzhou Kangtai Lubricant Additives Co., Ltd. - Key offerings
- 15.18 Tianhe Chemicals Group
- Tianhe Chemicals Group - Overview
- Tianhe Chemicals Group - Product / Service
- Tianhe Chemicals Group - Key offerings
- 15.19 R.T. Vanderbilt Holding Company
- R.T. Vanderbilt Holding Company - Overview
- R.T. Vanderbilt Holding Company - Product / Service
- R.T. Vanderbilt Holding Company - Key offerings
- 15.20 Shenyang Great Wall Lubricating Oil Manufacturing Co., Ltd.
- Shenyang Great Wall Lubricating Oil Manufacturing Co., Ltd. - Overview
- Shenyang Great Wall Lubricating Oil Manufacturing Co., Ltd. - Product / Service
- Shenyang Great Wall Lubricating Oil Manufacturing Co., Ltd. - Key offerings
- 15.21 Elco Corporation
- Elco Corporation - Overview
- Elco Corporation - Product / Service
- Elco Corporation - Key offerings
- 15.22 PMC Biogenix
- PMC Biogenix - Overview
- PMC Biogenix - Product / Service
- PMC Biogenix - Key offerings
- 15.23 Afton Group
- Afton Group - Overview
- Afton Group - Product / Service
- Afton Group - Key offerings
- 15.24 AMSOIL Inc.
- AMSOIL Inc. - Overview
- AMSOIL Inc. - Product / Service
- AMSOIL Inc. - Key offerings
- 15.25 ASL CamGuard
- ASL CamGuard - Overview
- ASL CamGuard - Product / Service
- ASL CamGuard - Key offerings
- 15.26 BASF SE
- BASF SE - Overview
- BASF SE - Product / Service
- BASF SE - Key offerings
- 15.27 BRB International BV
- BRB International BV - Overview
- BRB International BV - Product / Service
- BRB International BV - Key offerings
- 15.28 Chevron Corp.
- Chevron Corp. - Overview
- Chevron Corp. - Product / Service
- Chevron Corp. - Key offerings
- 15.29 Clariant International Ltd.
- Clariant International Ltd. - Overview
- Clariant International Ltd. - Product / Service
- Clariant International Ltd. - Key offerings
- 15.30 Croda International Plc
- Croda International Plc - Overview
- Croda International Plc - Product / Service
- Croda International Plc - Key offerings
- 15.31 DOG Chemical Products Ltd. and Co. Kg
- DOG Chemical Products Ltd. and Co. Kg - Overview
- DOG Chemical Products Ltd. and Co. Kg - Product / Service
- DOG Chemical Products Ltd. and Co. Kg - Key offerings
- 15.32 Dorf Ketal Chemicals I Pvt. Ltd.
- Dorf Ketal Chemicals I Pvt. Ltd. - Overview
- Dorf Ketal Chemicals I Pvt. Ltd. - Product / Service
- Dorf Ketal Chemicals I Pvt. Ltd. - Key offerings
- 15.33 Dover Chemical Corp.
- Dover Chemical Corp. - Overview
- Dover Chemical Corp. - Product / Service
- Dover Chemical Corp. - Key offerings
- 15.34 Eni SpA
- Eni SpA - Overview
- Eni SpA - Product / Service
- Eni SpA - Key offerings
- 15.35 Evonik Industries AG
- Evonik Industries AG - Overview
- Evonik Industries AG - Product / Service
- Evonik Industries AG - Key offerings
- 15.36 Exxon Mobil Corp.
- Exxon Mobil Corp. - Overview
- Exxon Mobil Corp. - Product / Service
- Exxon Mobil Corp. - Key offerings
- 15.37 Infineum International Ltd.
- Infineum International Ltd. - Overview
- Infineum International Ltd. - Product / Service
- Infineum International Ltd. - Key offerings
- 15.38 Italmatch Chemicals Spa
- Italmatch Chemicals Spa - Overview
- Italmatch Chemicals Spa - Product / Service
- Italmatch Chemicals Spa - Key offerings
- 15.39 Lanxess AG
- Lanxess AG - Overview
- Lanxess AG - Product / Service
- Lanxess AG - Key offerings
- 15.40 Solvay SA
- Solvay SA - Overview
- Solvay SA - Product / Service
- Solvay SA - Key offerings
- 15.41 The Lubrizol Corp.
- The Lubrizol Corp. - Overview
- The Lubrizol Corp. - Product / Service
- The Lubrizol Corp. - Key offerings
- 15.42 Wuxi Southern Petroleum Additives Co. Ltd.
- Wuxi Southern Petroleum Additives Co. Ltd. - Overview
- Wuxi Southern Petroleum Additives Co. Ltd. - Product / Service
- Wuxi Southern Petroleum Additives Co. Ltd. - Key offerings
16 Appendix
- 16.2 Inclusions and exclusions checklist
- Inclusions checklist
- Exclusions checklist
- 16.3 Currency conversion rates for US$
- Currency conversion rates for US$
- 16.4 Research methodology
- 16.7 Validation techniques employed for market sizing
- Validation techniques employed for market sizing
- 16.9 360 degree market analysis
- 360 degree market analysis
- 16.10 List of abbreviations