
Bio-Lubricants Market Size 2025-2029
The bio-lubricants market size is forecast to increase by USD 2.55 billion at a CAGR of 13.4% between 2024 and 2029.
- The market is experiencing significant growth due to the increasing demand for industrial biodegradable lubricants in manufacturing and transportation sectors. The market for bio lubricants includes a wide range of products such as bio-greases, hydraulic fluids, metalworking fluids, chainsaw oils, industrial gear oils, and high flash point bio-lubricants. These eco-friendly lubricants offer several advantages, including energy efficiency and reduced environmental impact. The EU eco-label certification is driving the adoption of bio-lubricants, as more companies seek to meet sustainability goals. Motor oil nanotechnology and high-performance lubricants are also gaining popularity for their ability to enhance engine performance and extend oil life. However, challenges such as limited temperature and oxidation stability remain, which must be addressed through product innovations to ensure the continued growth of the market. This market analysis report provides a comprehensive study of the market trends, growth factors, and challenges shaping the future of the industrial lubricants market.
What will be Bio-Lubricants Market Size During the Forecast Period?

- The global lubricants market is witnessing significant growth, driven by the increasing demand for sustainable and eco-friendly solutions. Among the various types of lubricants, bio-lubricants are gaining popularity due to their environmental benefits. These lubricants are derived from renewable raw materials such as plant oils, animal fats, and vegetable oils.
- Bio-lubricants are a viable alternative to traditional mineral oil-based lubricants and synthetic lubricants. The use of bio-lubricants in industrial applications and transportation sectors is on the rise due to their biodegradability and lower environmental impact. Biodegradability is a critical factor as it reduces the risk of environmental contamination.
How is this market segmented and which is the largest segment?
The market research report provides comprehensive data (region-wise segment analysis), with forecasts and estimates in "USD billion" for the period 2025-2029, as well as historical data from 2019-2023 for the following segments.
- Source
- Vegetable oil
- Animal oil
- Application
- Automotive
- Industrial
- Geography
- North America
- Canada
- US
- Europe
- Germany
- UK
- France
- Italy
- APAC
- China
- India
- Japan
- South America
- Middle East and Africa
- North America
By Source Insights
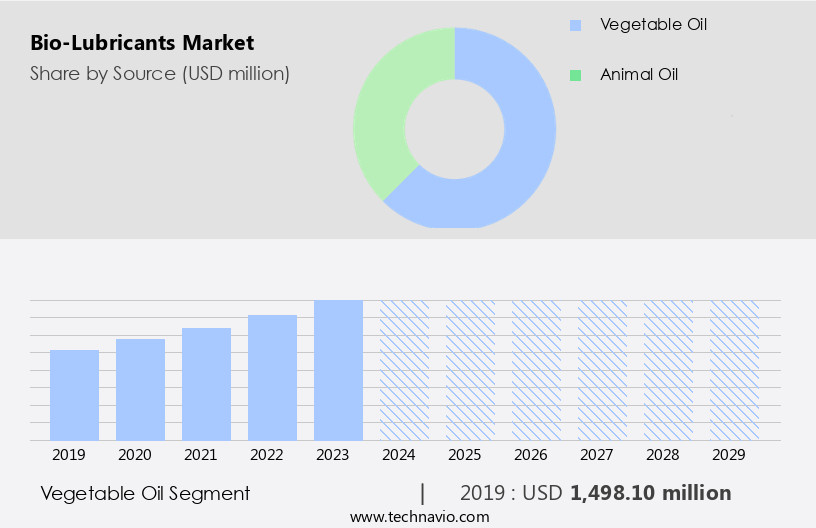
- The vegetable oil segment is estimated to witness significant growth during the forecast period.
The bio-lubricants market encompasses various segments based on source, with vegetable oils holding a substantial share due to their renewable origin and ecological advantages. Bio-lubricants derived from vegetable oils and esters are favored for their biodegradability and reduced toxicity, making them a more sustainable choice compared to conventional mineral oil-based lubricants. Vegetable oils, in their unrefined state, have long been employed as lubricants and offer numerous advantages for industrial and machinery applications. One notable benefit of vegetable oils is their exceptional lubricity, which frequently surpasses that of mineral oils. This superior lubricity contributes to improved machine performance by minimizing friction and wear, which is essential for machinery durability and productivity. In the realm of hydraulic fluids, metalworking fluids, chainsaw oils, and gear oils, bio-lubricants derived from vegetable oils exhibit excellent oxidative, thermal, and hydrolytic stability, ensuring optimal performance and longevity.
Get a glance at the market report of share of various segments Request Free Sample
The vegetable oil segment was valued at USD 1.5 billion in 2019 and showed a gradual increase during the forecast period.
Regional Analysis
- North America is estimated to contribute 41% to the growth of the global market during the forecast period.
Technavio's analysts have elaborately explained the regional trends and drivers that shape the market during the forecast period.

For more insights on the market share of various regions Request Free Sample
The North American market plays a pivotal role in the global bio-lubricants industry, fueled by strict environmental regulations and a heightened emphasis on sustainability. In keeping with this trend, Chevron Corporation, an American multinational energy corporation, unveiled a new synthetic grease in November 2022. This eco-friendly product, designed for use in the United States, complies with the 2013 Vessel General Permit regulations for environmentally acceptable lubricants. With superior flow characteristics, this biodegradable grease caters to various industries, underscoring North America's dedication to sustainable solutions. Furthering this commitment, Kraton Corporation, a prominent producer of specialty polymers and biobased products, introduced SYLVASOLV in February 2024.
Market Dynamics
Our researchers analyzed the data with 2024 as the base year, along with the key drivers, trends, and challenges. A holistic analysis of drivers will help companies refine their marketing strategies to gain a competitive advantage.
What are the key market drivers leading to the rise in adoption of Bio-Lubricants Market ?
Rise in sales of commercial vehicles is the key driver of the market.
- The market is witnessing notable expansion, fueled by the growing demand for commercial vehicles. In 2023, commercial vehicle registrations in the country experienced a substantial increase of around 14%, with the total number of registrations estimated between 1.55 to 1.65 million units. This growth can be attributed to the expanding rental and leasing industry. Although the figures for 2023 fell short of the pre-pandemic levels of 2019 by approximately 197,000 units, they represent a significant step towards recovery.
- In addition, India's commercial vehicle market has demonstrated remarkable growth. In Q2 2024, sales of commercial vehicles experienced a increase due to strong replacement demand and ongoing government infrastructure projects. Renewable raw materials, such as plant oils, animal fats, and vegetable oil lubricants, are increasingly being used to produce biodegradable bio-based lubricants. These eco-friendly alternatives are gaining popularity due to their ability to reduce environmental contamination. As the demand for sustainable solutions continues to rise, the market is poised for continued growth.
What are the market trends shaping the Bio-Lubricants Market?
Product innovations is the upcoming trend in the market.
- The market is experiencing notable expansion due to the increasing demand for eco-friendly and high-performance lubricants. One recent innovation in this sector is Savsol Lubricants' launch of Savsol Ester 5 in April 2024. This industrial biodegradable lubricant is specifically designed for high-performance applications in industries such as transportation manufacturing. It is particularly advantageous for sectors like automotive and railway, where efficiency and minimal maintenance are essential.
- Moreover, Savsol Ester 5 boasts superior performance characteristics, including reduced engine deposits and friction, leading to improved energy efficiency and overall mileage. This makes it an ideal choice for applications in electric vehicles (EVs) and high-speed railway coaches. Moreover, the introduction of Savsol Ester 5 contributes to the trend of import substitution in the lubricant market. This eco-labeled lubricant aligns with the growing emphasis on sustainability and energy efficiency in various industries.
What challenges does Bio-Lubricants Market face during the growth?
Limited temperature and oxidation stability is a key challenge affecting the market growth.
- The market is experiencing growth due to the increasing demand for eco-friendly solutions in various industries, particularly in the construction sector for green buildings. Rapidly biodegradable lubricants derived from carbon sources are gaining popularity due to their lubricating properties and minimal environmental impact. However, the market faces challenges in terms of biodegradability losses and cost-effectiveness. Bio-lubricants, derived from renewable resources, offer a sustainable alternative to conventional lubricants. However, their use is limited by their temperature and oxidation stability. The low heating value of bio-oils results in lower flame temperatures, making them less efficient for combustion purposes. Moreover, the high water content and presence of organic acids in bio-oils can adversely affect equipment performance and increase maintenance costs.
- Despite these challenges, the market for bio-lubricants is expected to grow as the demand for sustainable solutions continues to rise. Cost-effective solutions and advancements in technology are being explored to address the stability issues. In the automotive industry, bio-lubricants are being used to reduce carbon emissions and improve fuel efficiency. As the world moves towards a more sustainable future, the market for bio-lubricants is poised for significant growth.
Exclusive Customer Landscape
The market forecasting report includes the adoption lifecycle of the market, covering from the innovator's stage to the laggard's stage. It focuses on adoption rates in different regions based on penetration. Furthermore, the market report also includes key purchase criteria and drivers of price sensitivity to help companies evaluate and develop their market growth analysis strategies.

Customer Landscape
Key Companies & Market Insights
Companies are implementing various strategies, such as strategic alliances, market forecast , partnerships, mergers and acquisitions, geographical expansion, and product/service launches, to enhance their presence in the market.
The market research and growth report includes detailed analyses of the competitive landscape of the market and information about key companies, including:
- Axel Christiernsson International AB
- Biosynthetic Technologies
- BP Plc
- Cargill Inc.
- Carl Bechem GmbH
- Cortec Corp.
- Emery Oleochemicals Group
- Environmental Lubricants Manufacturing Inc.
- Exxon Mobil Corp.
- FUCHS SE
- IGOL
- Kluber Lubrication Munchen SE and Co. KG
- LanoPro Production AS
- Magna International Pte Ltd.
- Novvi LLC
- Polnox Corp.
- Repsol SA
- RCS Bio Solutions
- Shell plc
- TotalEnergies SE
Qualitative and quantitative analysis of companies has been conducted to help clients understand the wider business environment as well as the strengths and weaknesses of key market players. Data is qualitatively analyzed to categorize companies as pure play, category-focused, industry-focused, and diversified; it is quantitatively analyzed to categorize companies as dominant, leading, strong, tentative, and weak.
Research Analyst Overview
The bio-based lubricants market is witnessing significant growth due to the increasing demand for eco-friendly and sustainable alternatives to traditional petroleum-based lubricants. Bio-based motor oils, also known as bio lubricants, are gaining popularity as they offer similar lubricating properties as mineral-based oils but are derived from renewable raw materials such as plant oils and animal fats. These raw materials are rapidly biodegradable and help reduce environmental contamination. Bio lubricants are used in various applications including automotive, industrial, and transportation manufacturing. They are also used in the production of energy efficiency lubricants and motor oil nanotechnology. The use of bio-based lubricants in green buildings is also on the rise due to their lower emissions and carbon from bio-sources.
In addition, the biodegradability of bio lubricants is a key factor driving their adoption. However, the cost-effectiveness of bio lubricants compared to synthetic lubricants and mineral oil lubricants is a challenge that needs to be addressed. These products offer consistent viscosity and excellent oxidative, thermal, and hydrolytic stability. The EU eco-label and various certifications have played a crucial role in promoting the adoption of bio lubricants. The market is expected to grow further as there is a increasing demand for high-performance lubricants with lower emissions and improved carbon emissions reduction. Bio-based alternatives to traditional engine oils, transmission fluids, and process oils are also gaining popularity due to their environmental benefits.
| Bio-Lubricants Market Scope | |
|
Report Coverage |
Details |
|
Page number |
204 |
|
Base year |
2024 |
|
Historic period |
2019-2023 |
|
Forecast period |
2025-2029 |
|
Growth momentum & CAGR |
Accelerate at a CAGR of 13.4% |
|
Market growth 2025-2029 |
USD 2.55 billion |
|
Market structure |
Fragmented |
|
YoY growth 2024-2025(%) |
12.0 |
|
Key countries |
US, China, UK, Germany, Canada, Japan, India, Russia, France, and Italy |
|
Competitive landscape |
Leading Companies, Market Positioning of Companies, Competitive Strategies, and Industry Risks |
What are the Key Data Covered in this Market Research and Growth Report?
- CAGR of the market during the forecast period
- Detailed information on factors that will drive the market growth and forecasting between 2025 and 2029
- Precise estimation of the size of the market and its contribution of the market in focus to the parent market
- Accurate predictions about upcoming market growth and trends and changes in consumer behaviour
- Growth of the market across North America, Europe, APAC, South America, and Middle East and Africa
- Thorough analysis of the market's competitive landscape and detailed information about companies
- Comprehensive analysis of factors that will challenge the growth of market companies
We can help! Our analysts can customize this market research report to meet your requirements. Get in touch
 RIA -
RIA - 
