Lunch Bags Market Size 2025-2029
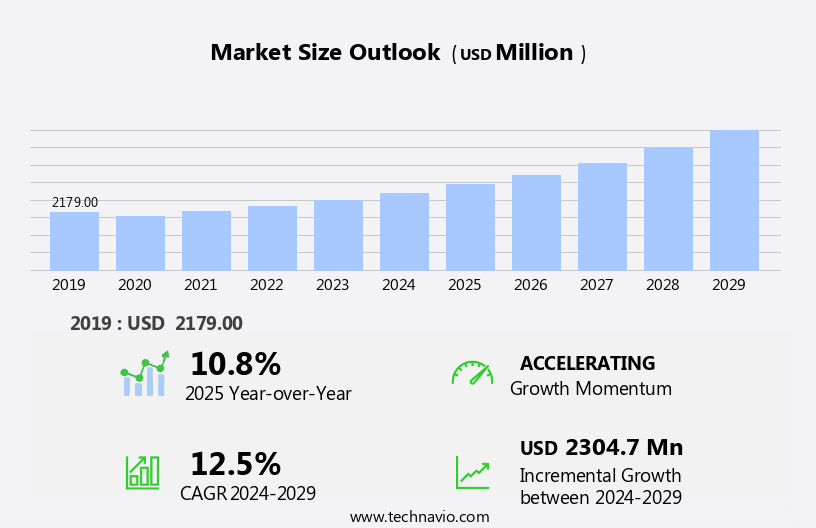
The lunch bags market size is forecast to increase by USD 2.3 billion, at a CAGR of 12.5% between 2024 and 2029.
- The market is witnessing significant growth due to the increasing preference for home-cooked meals and the rising number of health concerns associated with convenience foods. The shift towards healthier eating habits is driving the demand for lunch bags as consumers seek convenient and portable solutions to carry their homemade meals. Additionally, the rise in disposable income and changing lifestyle trends have led to an increase in the adoption of lunch bags, particularly among working professionals and students. However, the market faces challenges in the form of intense competition from disposable packaging and plastic bags, which are often cheaper alternatives.
- Moreover, environmental concerns and regulations against single-use plastics pose a significant threat to the market's growth. To capitalize on the opportunities presented by the growing health-conscious consumer base, market players must focus on offering eco-friendly and insulated lunch bags that cater to the evolving consumer preferences. Additionally, collaborations with health and wellness brands and influencers can help increase brand visibility and market share.
What will be the Size of the Lunch Bags Market during the forecast period?
Explore in-depth regional segment analysis with market size data - historical 2019-2023 and forecasts 2025-2029 - in the full report.
Request Free Sample
The market continues to evolve, with dynamic market trends shaping its growth across various sectors. Food safety and hygiene features remain paramount, driving the demand for lunch bags with advanced leak-proof mechanisms and PVC-free materials. The ongoing shift towards sustainable practices has led to the emergence of tote lunch bags made from recycled materials and insulated bags crafted from eco-friendly packaging materials. Soft-sized lunch bags, including neoprene and backpack designs, cater to the needs of active consumers. Manufacturing processes are continually refined to optimize price points while maintaining temperature retention capabilities and ensuring product longevity.
Innovations in design aesthetics, such as embroidery techniques and customizable designs, attract brand loyalty among consumers. Travel lunch bags, work lunch bags, and picnic lunch bags cater to diverse lifestyles, with various size dimensions and handle straps accommodating different weight capacities. E-commerce sales continue to surge, enabling consumers to access a wide range of lunch bag options, including microwave-safe, freezer-safe, and insulated bags. Retail channels expand their offerings, incorporating various price points, cooling elements like ice packs and gel packs, and insulation ratings. Market players explore new materials, such as EVA and BPA-free materials, to cater to evolving consumer preferences and regulatory requirements.
Consumer reviews play a crucial role in shaping market trends, with preferences shifting towards bags with zip closures, waterproof features, and easy cleaning instructions. The lunch bag market's continuous dynamism reflects the ongoing quest for functional, sustainable, and aesthetically pleasing solutions that cater to diverse consumer needs and lifestyles.
How is this Lunch Bags Industry segmented?
The lunch bags industry research report provides comprehensive data (region-wise segment analysis), with forecasts and estimates in "USD million" for the period 2025-2029, as well as historical data from 2019-2023 for the following segments.
- Distribution Channel
- Offline
- Online
- Geography
- North America
- US
- Canada
- Europe
- France
- Germany
- Italy
- UK
- APAC
- Australia
- China
- India
- Japan
- Rest of World (ROW)
- North America
By Distribution Channel Insights
The offline segment is estimated to witness significant growth during the forecast period.
Reusable lunch bags have gained significant traction in the US market, with various entities contributing to their growth. The supply chain management of these bags involves manufacturing processes using sustainable materials like recycled plastics and natural fabrics, such as cotton and nylon. Size dimensions and design aesthetics cater to diverse consumer preferences, with options including soft-sided and hard-sided bags, backpacks, totes, and insulated bags. Velcro closures and zippers ensure secure seals, while microwave-safe and leak-proof features enhance convenience. Printing techniques enable customizable designs for brand loyalty and promotional purposes. Sustainability is a key trend, with eco-friendly materials and manufacturing processes gaining popularity.
Temperature retention is crucial for insulated bags, with cooling elements like ice packs and gel packs ensuring food safety and hygiene. Price points vary, with options for budget-friendly disposable bags and higher-end, long-lasting bags. E-commerce sales have surged, with online retailers like Amazon and Target offering a wide range of lunch bags. Manufacturers like Eva, DELSEY, and The North Face have established brand presence through exclusive online stores and partnerships with major retailers. Consumers increasingly prefer the convenience of shopping from home, contributing to the decline in offline sales from specialty stores, hypermarkets, and department stores. Design elements like handle straps, shoulder straps, and weight capacity cater to various consumer needs.
Brand loyalty is strong, with consumers often preferring specific brands for their lunch bags. Material composition, thermal insulation, and cleaning instructions are essential considerations for consumers. The market continues to evolve, with new trends like freezer-safe and BPA-free lunch bags emerging.
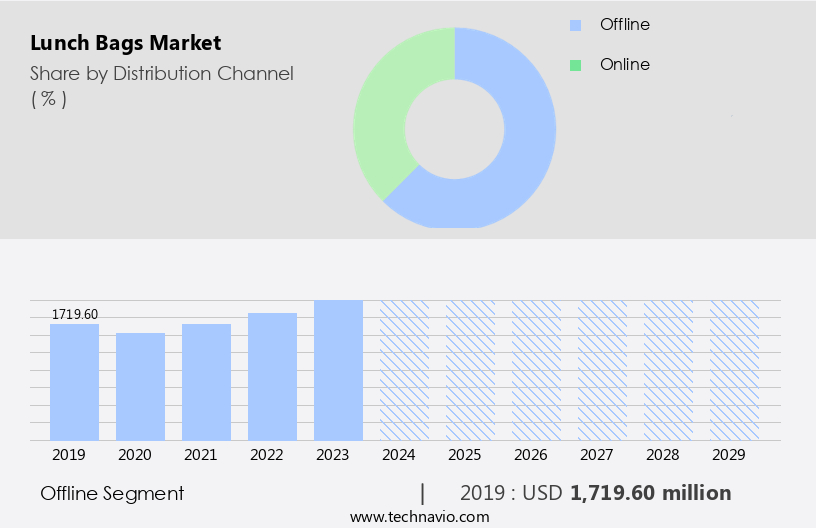
The Offline segment was valued at USD 1.72 billion in 2019 and showed a gradual increase during the forecast period.
Regional Analysis
APAC is estimated to contribute 42% to the growth of the global market during the forecast period. Technavio's analysts have elaborately explained the regional trends and drivers that shape the market during the forecast period.
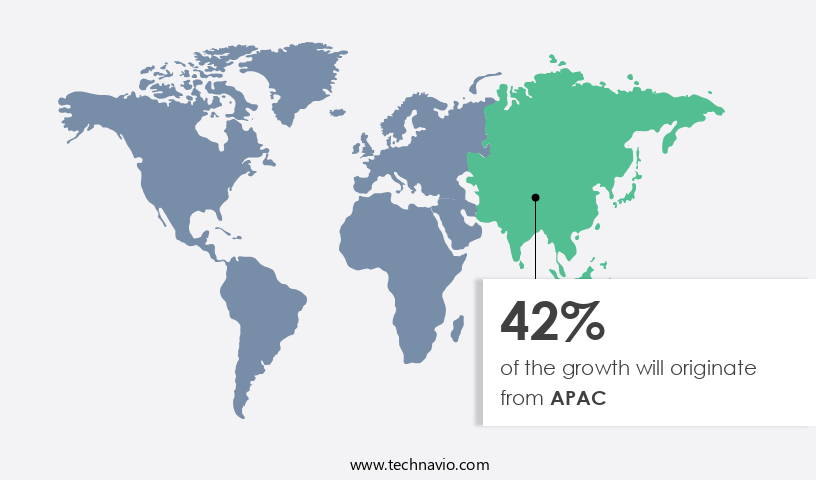
The market encompasses various product offerings, including reusable lunch bags, soft- and hard-sided options, and disposable bags. APAC holds the largest market share, fueled by population density, rising disposable income, and health consciousness. Key regions in APAC, such as China, India, and Japan, significantly contribute to the market's growth. Soft-sided lunch bags, often made from sustainable materials like recycled plastics or cotton, are popular due to their lightweight design and affordability. Velcro closures and zippers ensure secure seals, while printing techniques allow for customizable designs. Some lunch bags are microwave-safe, insulated, or even freezer-safe, catering to diverse consumer needs.
Manufacturing processes prioritize food safety and hygiene features, with PVC-free, leak-proof materials and easy-to-clean surfaces. Size dimensions vary from compact totes for work lunches to larger bags for picnics or family outings. Price points range from budget-friendly options to premium, high-performance bags. E-commerce sales are on the rise, enabling easy access to a wide selection of lunch bags. Promotional lunch bags are also popular, especially for brand loyalty programs and corporate gifting. Innovations include temperature retention features, insulation ratings, and cooling elements, such as ice packs and gel packs. Design aesthetics play a significant role in consumer preferences, with trends leaning towards minimalist, eco-friendly, and functional designs.
Material compositions include neoprene, nylon, and polyester, while various closing mechanisms, such as buckle closures and handle straps, cater to different user preferences and weight capacities. Retail channels, both online and offline, offer a vast array of lunch bags, catering to diverse consumer segments, from kids and adults to schools and offices. Brands prioritize product lifespan, ensuring their offerings remain relevant and in-demand. Ultimately, the market continues to evolve, driven by consumer preferences, technological advancements, and sustainability concerns.
Market Dynamics
Our researchers analyzed the data with 2024 as the base year, along with the key drivers, trends, and challenges. A holistic analysis of drivers will help companies refine their marketing strategies to gain a competitive advantage.
What are the key market drivers leading to the rise in the adoption of Lunch Bags Industry?
- The increasing demand for home-cooked meals is the primary factor fueling market growth.
- The demand for convenience in meal options, driven by the increasing number of individuals with busy work schedules, is fueling the growth of the global convenience food market. This trend is more indicative of the expansion in the food service sector than actual consumer spending on food service outlets. Two primary factors contributing to this trend are the escalating costs of restaurant meals and the surge in the popularity of grocery e-commerce. Additionally, the increasing population of health-conscious consumers is another significant growth factor. These consumers prefer home-cooked meals due to their high nutritional value, freshness, and hygiene. As a result, the market for polyester lunch bags, which cater to the convenience of carrying home-cooked meals, is experiencing steady growth.
What are the market trends shaping the Lunch Bags Industry?
- Convenience foods are increasingly linked to various health concerns, making this a significant trend in the market. The rising number of health issues associated with these foods is a growing concern for consumers and health professionals alike.
- The shift towards healthier eating habits is driving the demand for reusable lunch bags in the supply chain management of food industries. With an increasing awareness of the health risks associated with convenience foods, consumers are turning to home-cooked meals. Reusable lunch bags offer a sustainable solution for transporting food, reducing the need for disposable plastic bags. These lunch bags come in various size dimensions and designs, including velcro closures, soft-sided, and hard-sided options. Some are even microwave-safe, making them ideal for heating up meals at work. Manufacturing processes for these bags often involve sustainable materials like recycled plastics and natural fabrics.
- Design aesthetics range from simple and functional to stylish and trendy, catering to diverse consumer preferences. Backpack lunch bags are a popular choice for those who want to carry more items, while outdoor lunch bags are ideal for picnics and hikes. The product lifespan of reusable lunch bags is significantly longer than disposable bags, making them a cost-effective and eco-friendly option. The manufacturing processes for these bags prioritize minimizing waste and reducing carbon emissions, contributing to their overall sustainability. As consumers become more conscious of their environmental impact, the demand for reusable lunch bags is expected to continue growing.
What challenges does the Lunch Bags Industry face during its growth?
- The industry's growth is being significantly impacted by the concurrent trends of increasing disposable income and shifting consumer lifestyles.
- The global market for lunch bags has experienced significant growth due to the increasing disposable income of consumers worldwide. According to recent research, disposable personal income (DPI) in the US increased by 0.9% or USD 191.6 billion in February 2025 compared to January 2025. This trend is not unique to the US; household disposable income has risen in all developed and developing countries since 2023. Factors such as the increase in dual household income, per capita income, and employment rate have contributed to this growth. As consumers' disposable income rises, their eating habits are changing. Lunch bags have become a popular choice for consumers seeking to maintain food safety and hygiene during their daily meals.
- These bags come in various types, including tote, travel, neoprene, and picnic lunch bags. Features such as leak-proof, PVC-free, and temperature retention capabilities are essential for consumers. Additionally, zip closures, ice packs, and e-commerce sales have further boosted the market's growth. Packaging materials used in lunch bags, such as neoprene and insulated materials, ensure temperature retention, keeping food fresh for extended periods. Consumers also prefer lunch bags with hygiene features, such as zip closures, to maintain the freshness and safety of their food. The market for lunch bags is expected to continue growing, with innovations in embroidery techniques and leak-proof technology further enhancing their appeal.
Exclusive Customer Landscape
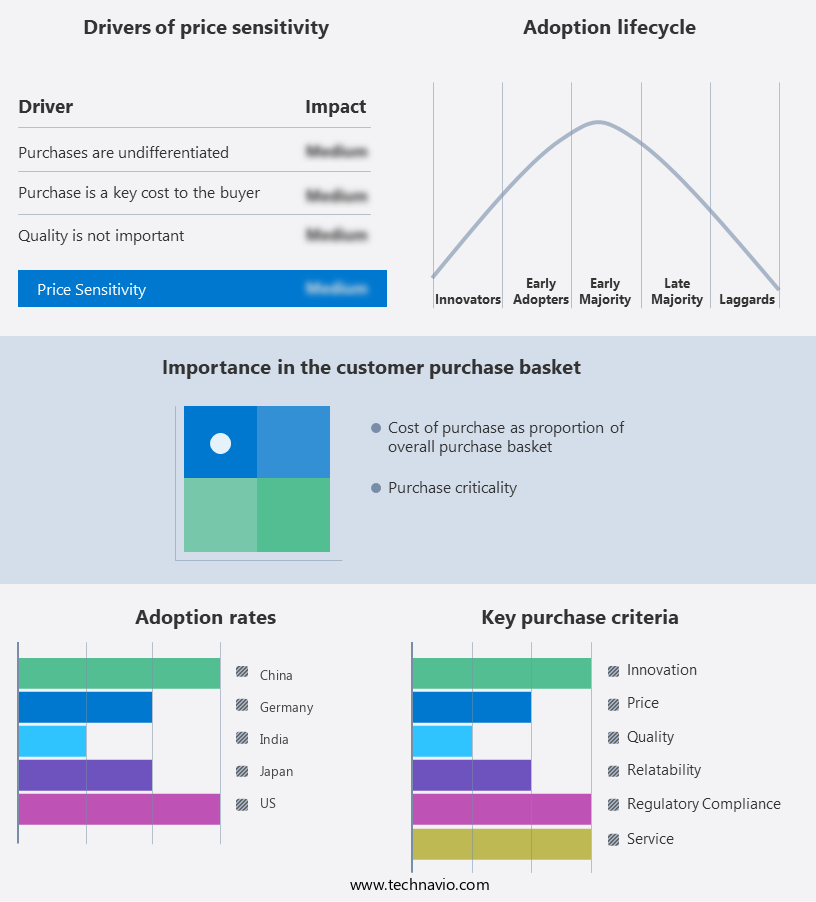
The lunch bags market forecasting report includes the adoption lifecycle of the market, covering from the innovator's stage to the laggard's stage. It focuses on adoption rates in different regions based on penetration. Furthermore, the lunch bags market report also includes key purchase criteria and drivers of price sensitivity to help companies evaluate and develop their market growth analysis strategies.
Customer Landscape
Key Companies & Market Insights
Companies are implementing various strategies, such as strategic alliances, lunch bags market forecast, partnerships, mergers and acquisitions, geographical expansion, and product/service launches, to enhance their presence in the industry.
ASON BAGS - This innovative company specializes in versatile lunch bags, featuring designs that combine a backpack, tote, waistpack, crossbody, duffel, drawstring, cooler, and shopper styles. Each bag caters to diverse needs, enhancing convenience and functionality for consumers.
The industry research and growth report includes detailed analyses of the competitive landscape of the market and information about key companies, including:
- ASON BAGS
- Bentgo
- Carters Inc.
- Columbia Sportswear Co.
- DELSEY
- Farberware
- Fit and Fresh Inc.
- Igloo Products Corp.
- JuJuBe
- Kuber Mart Industries Pvt. Ltd.
- LEGO System AS
- Nordic By Nature
- PackIt LLC
- Raveena Bags
- Rubbermaid
- SANRIO CO. LTD.
- The North Face
- Thermos LLC
- Topgolf Callaway Brands Corp.
- Wildkin
Qualitative and quantitative analysis of companies has been conducted to help clients understand the wider business environment as well as the strengths and weaknesses of key industry players. Data is qualitatively analyzed to categorize companies as pure play, category-focused, industry-focused, and diversified; it is quantitatively analyzed to categorize companies as dominant, leading, strong, tentative, and weak.
Recent Development and News in Lunch Bags Market
- In January 2024, food packaging company, Tupperware Brands Corporation, announced the launch of its new line of reusable lunch bags, named "Tupperware LunchMate," designed with insulation technology to keep food fresh for longer hours (Tupperware Press Release, 2024).
- In March 2024, Danish packaging solutions provider, Vestas Special Plast A/S, and American food packaging company, Dart Container Corporation, joined forces to develop innovative, eco-friendly lunch bags using plant-based materials (Vestas Special Plast Press Release, 2024).
- In May 2024, Zara Home, the home and living brand of Inditex, entered the market with its new collection, featuring stylish and functional designs, further expanding the market's reach into the fashion industry (Inditex Corporate Communication, 2024).
- In April 2025, the European Union passed the Single Use Plastics Directive, banning single-use plastic products, including plastic bags, from the EU market by 2026, significantly boosting the demand for reusable lunch bags (European Parliament Press Release, 2025).
Research Analyst Overview
- In the dynamic market, custom logo printing continues to be a key differentiator for brands seeking to cater to diverse consumer needs. The competitive landscape analysis reveals a crowded marketplace, with players focusing on material sourcing and production efficiency to gain an edge. Trend analysis indicates a shift towards design trends that prioritize sustainability and functionality. Consumer behavior is driving the demand for high-quality lunch bags with robust safety standards and efficient distribution networks. Product innovation, such as retail display solutions and lunch bag accessories, is also a significant trend. Wholesale distribution channels and price optimization strategies are essential for ensuring inventory management and customer service excellence.
- Warranty claims and product recalls necessitate stringent quality control measures. Brand positioning and marketing campaigns are crucial for standing out in the market, with online marketing strategies increasingly popular. Sustainable practices and logistics optimization are also becoming key considerations for companies seeking to minimize their environmental impact and streamline operations.
Dive into Technavio's robust research methodology, blending expert interviews, extensive data synthesis, and validated models for unparalleled Lunch Bags Market insights. See full methodology.
|
Market Scope |
|
|
Report Coverage |
Details |
|
Page number |
179 |
|
Base year |
2024 |
|
Historic period |
2019-2023 |
|
Forecast period |
2025-2029 |
|
Growth momentum & CAGR |
Accelerate at a CAGR of 12.5% |
|
Market growth 2025-2029 |
USD 2304.7 million |
|
Market structure |
Fragmented |
|
YoY growth 2024-2025(%) |
10.8 |
|
Key countries |
US, China, Canada, Japan, India, Germany, France, Australia, UK, and Italy |
|
Competitive landscape |
Leading Companies, Market Positioning of Companies, Competitive Strategies, and Industry Risks |
What are the Key Data Covered in this Lunch Bags Market Research and Growth Report?
- CAGR of the Lunch Bags industry during the forecast period
- Detailed information on factors that will drive the growth and forecasting between 2025 and 2029
- Precise estimation of the size of the market and its contribution of the industry in focus to the parent market
- Accurate predictions about upcoming growth and trends and changes in consumer behaviour
- Growth of the market across APAC, Europe, North America, South America, and Middle East and Africa
- Thorough analysis of the market's competitive landscape and detailed information about companies
- Comprehensive analysis of factors that will challenge the lunch bags market growth of industry companies
We can help! Our analysts can customize this lunch bags market research report to meet your requirements.
 RIA -
RIA - 
