Machine Learning (ML) Platforms Market Analysis, Size, and Forecast 2025-2029: North America (US, Canada, and Mexico), APAC (China, Japan, and India), Europe (Germany, UK, and France), Middle East and Africa (Saudi Arabia, UAE, and South Africa), South America (Brazil, Argentina, and Colombia), and Rest of World (ROW)

Machine Learning (ML) Platforms Market Analysis, Size, and Forecast 2025-2029:
North America (US, Canada, and Mexico), APAC (China, Japan, and India), Europe (Germany, UK, and France), Middle East and Africa (Saudi Arabia, UAE, and South Africa), South America (Brazil, Argentina, and Colombia), and Rest of World (ROW)

Published: Dec 2025 315 Pages SKU: IRTNTR81089

Market Overview at a Glance

$37.86 B
Market Opportunity
25.1%
CAGR 2024 - 2029
32.5%
North America Growth
$8.97 B
Cloud-based segment 2023

Machine Learning (ML) Platforms Market Size 2025-2029

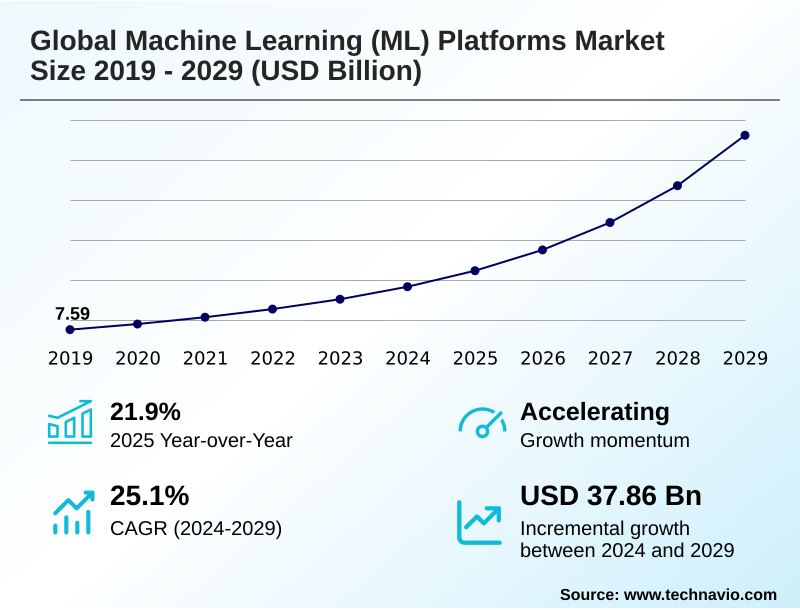
The machine learning (ml) platforms market size is valued to increase by USD 37.86 billion, at a CAGR of 25.1% from 2024 to 2029. Escalating volume and complexity of data will drive the machine learning (ml) platforms market.

Major Market Trends & Insights

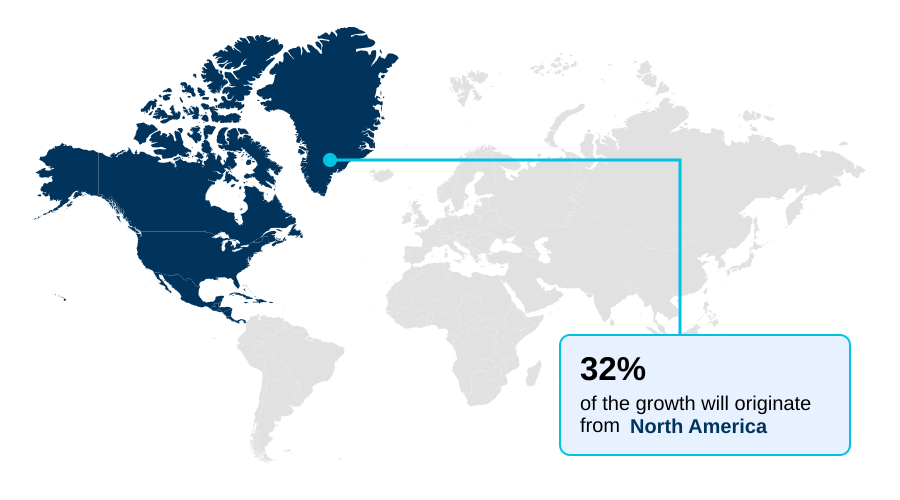
  • North America dominated the market and accounted for a 32.5% growth during the forecast period.
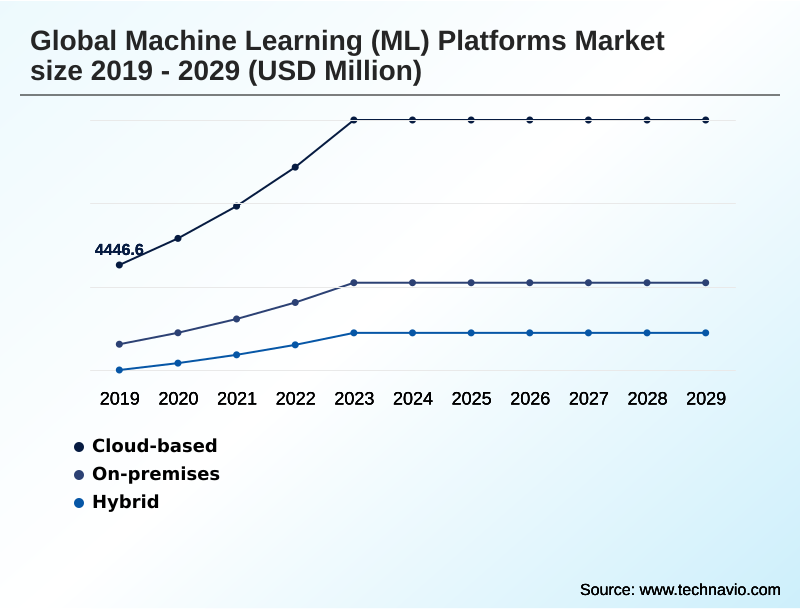
  • By Deployment - Cloud-based segment was valued at USD 8.97 billion in 2023
  • By Application - Predictive analytics segment accounted for the largest market revenue share in 2023

Market Size & Forecast

  • Market Opportunities: USD 48.59 billion
  • Market Future Opportunities: USD 37.86 billion
  • CAGR from 2024 to 2029 : 25.1%

Market Summary

  • The machine learning (ML) platforms market is expanding as organizations prioritize data-driven decision-making. A primary driver is the explosion of big data, which necessitates sophisticated tools to extract actionable insights. These platforms provide the infrastructure for the end-to-end ml lifecycle, from data preprocessing and feature engineering to model deployment and monitoring.
  • A key trend is the integration of generative and predictive ai, enabling applications capable of creating novel content and forecasting future outcomes. In manufacturing, for instance, a company can implement machine learning for predictive maintenance by analyzing sensor data to anticipate equipment failures, reducing downtime and operational costs.
  • However, the market's progress is moderated by challenges such as the persistent scarcity of skilled data scientists and engineers. Furthermore, concerns regarding data governance and the need for responsible ai frameworks that ensure fairness and model explainability are becoming central to enterprise adoption strategies, shaping platform development to include robust tools for compliance and ethical oversight.
  • The shift towards MLOps is also critical, as it operationalizes AI at scale, ensuring models remain accurate and reliable in production environments.

What will be the Size of the Machine Learning (ML) Platforms Market during the forecast period?

Get Key Insights on Market Forecast (PDF) Request Free Sample

How is the Machine Learning (ML) Platforms Market Segmented?

The machine learning (ml) platforms industry research report provides comprehensive data (region-wise segment analysis), with forecasts and estimates in "USD million" for the period 2025-2029, as well as historical data from 2019-2023 for the following segments.

  • Deployment
    • Cloud-based
    • On-premises
    • Hybrid
  • Application
    • Predictive analytics
    • Computer vision
    • Natural language processing
    • Recommendation systems
    • Others
  • End-user
    • BFSI
    • Healthcare and life science
    • Retail and e-commerce
    • Manufacturing
    • Others
  • Geography
    • North America
      • US
      • Canada
      • Mexico
    • APAC
      • China
      • Japan
      • India
    • Europe
      • Germany
      • UK
      • France
    • Middle East and Africa
      • Saudi Arabia
      • UAE
      • South Africa
    • South America
      • Brazil
      • Argentina
      • Colombia
    • Rest of World (ROW)

By Deployment Insights

The cloud-based segment is estimated to witness significant growth during the forecast period.

The cloud-based deployment model is the cornerstone of the machine learning platforms market, offering organizations unmatched scalability and flexibility. This model provides pay-as-you-go access to vast computational resources, including GPU acceleration and tensor processing units, essential for complex model training.

It democratizes AI, enabling businesses to leverage automated machine learning and no-code model building tools without prohibitive upfront investment in physical hardware.

Cloud platforms deliver a fully managed, end-to-end ml lifecycle, integrating seamlessly with other data and analytics services to create a cohesive workflow.

By abstracting infrastructure complexities, these cloud-native solutions allow teams to focus on innovation, with some platforms improving model deployment efficiency by over 40%.

The approach provides a scalable ml infrastructure that supports everything from initial data exploration to production-level serverless computing.

Request Free Sample

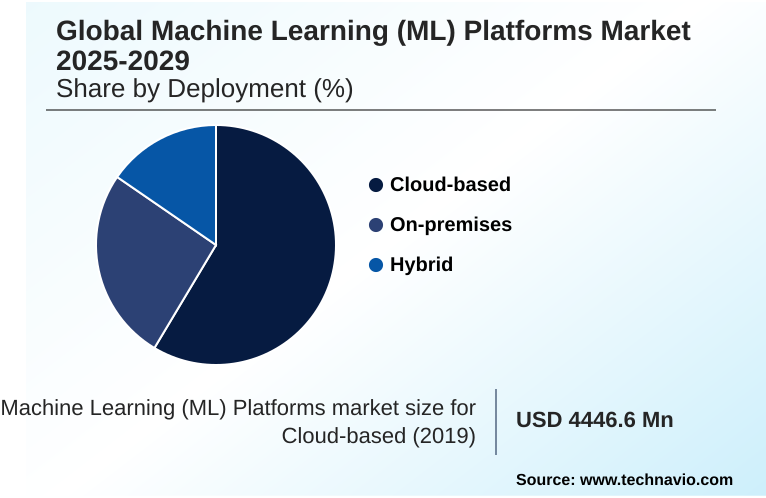
The Cloud-based segment was valued at USD 8.97 billion in 2023 and showed a gradual increase during the forecast period.

Request Free Sample

Regional Analysis

North America is estimated to contribute 32.5% to the growth of the global market during the forecast period.Technavio’s analysts have elaborately explained the regional trends and drivers that shape the market during the forecast period.

See How Machine Learning (ML) Platforms Market Demand is Rising in North America Request Free Sample

The geographic landscape of the machine learning platforms market is led by North America, which accounts for over 32% of the incremental growth, driven by its mature technology ecosystem and high adoption rates.

The region's leadership is anchored in its widespread use of computer vision for industrial automation and recommendation systems in e-commerce.

Following this, APAC is the fastest-growing region, with countries like China and India leveraging large language models and other foundational models for digital services at an unprecedented scale.

Europe's market is distinguished by a strong focus on industrial applications and regulatory leadership in responsible AI. Key applications gaining traction globally include natural language processing for customer service and reinforcement learning for autonomous systems.

Platforms are also enhancing capabilities like data annotation and streamlined model deployment to support these diverse use cases.

Market Dynamics

Our researchers analyzed the data with 2024 as the base year, along with the key drivers, trends, and challenges. A holistic analysis of drivers will help companies refine their marketing strategies to gain a competitive advantage.

  • Strategically navigating the machine learning platforms market requires a deep understanding of both opportunities and operational costs. A primary consideration is the total cost of training large models, which can be substantial. Effective management involves not only building and deploying ml models but also managing the entire model lifecycle to ensure long-term value.
  • For industrial firms, implementing machine learning for predictive maintenance can yield significant ROI, often reducing unplanned downtime by more than half compared to traditional methods. Similarly, in finance, leveraging AI for algorithmic trading and automating fraud detection processes are now standard practices for maintaining a competitive edge.
  • The ability to fine-tune models on proprietary data is a key differentiator, allowing businesses to create unique solutions. For consumer-facing applications, building intelligent chatbot applications and providing real-time model serving capabilities are essential for user engagement. In specialized sectors, AI for medical image analysis and optimizing semiconductor fabrication processes demonstrate the technology's deep impact.
  • Broader applications like ML for supply chain optimization and AI for public utility management showcase its versatility. Success hinges on ensuring data quality and consistency, integrating models into existing workflows, and monitoring model performance in production while detecting and mitigating model bias.
  • Adherence to compliance with data privacy regulations is non-negotiable, and platforms that focus on reducing model deployment time while automating complex creative analytical tasks provide a distinct advantage.

What are the key market drivers leading to the rise in the adoption of Machine Learning (ML) Platforms Industry?

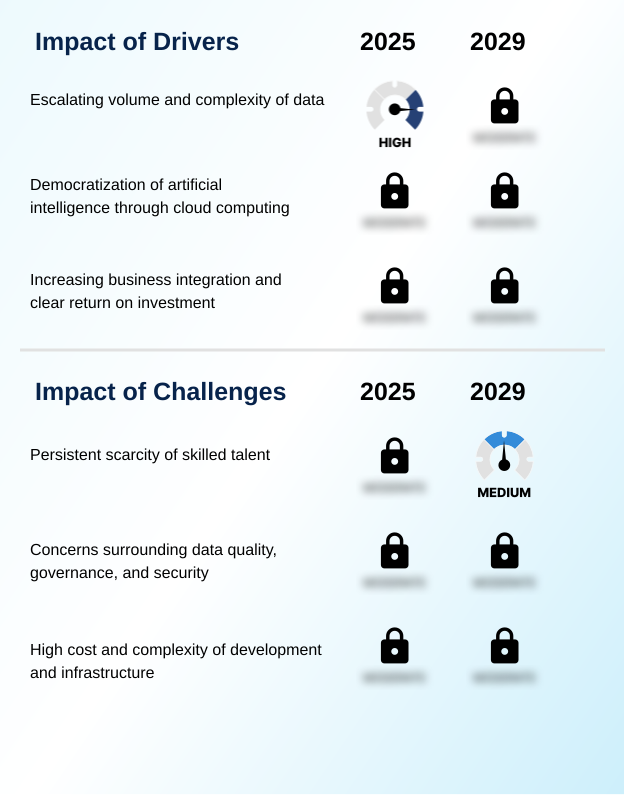
  • The escalating volume and complexity of data across industries is a primary driver for the adoption of machine learning platforms.

  • The primary driver for the machine learning platforms market is the imperative to transform vast data reservoirs into strategic assets.
  • Organizations are leveraging these platforms for advanced predictive analytics, which can improve forecasting accuracy by over 25% compared to traditional methods. The process begins with rigorous data preprocessing and feature engineering, which are streamlined by modern data science workflows.
  • The integration of deep learning models enables solutions that were previously unattainable. Furthermore, the availability of open-source data science tools and enterprise AI suites lowers the barrier to entry, while AI-driven iPaaS solutions simplify complex integrations.
  • By utilizing techniques such as hyperparameter tuning within generative and predictive AI frameworks, businesses can optimize model performance, turning raw data into a decisive competitive advantage across various industries.

What are the market trends shaping the Machine Learning (ML) Platforms Industry?

  • The mainstream adoption of MLOps is emerging as a critical market trend, focusing on standardizing and automating the machine learning lifecycle for production environments.

  • The machine learning platforms market is increasingly shaped by the mainstream adoption of MLOps. This trend focuses on bringing discipline to the full lifecycle ml, from development to the production environment. By implementing MLOps, organizations can achieve a 30% reduction in the time it takes to move models from research to live applications.
  • A core component is continuous monitoring, which is crucial for detecting model drift and ensuring sustained performance. This systematic approach, supported by robust model monitoring and model versioning tools, helps maintain model accuracy over time.
  • Consequently, businesses are prioritizing platforms that offer integrated automated pipelines and facilitate custom model development, ensuring that AI initiatives are not only innovative but also reliable and scalable within their operational frameworks.

What challenges does the Machine Learning (ML) Platforms Industry face during its growth?

  • A persistent scarcity of skilled talent presents a key challenge, potentially constraining the industry's growth trajectory.

  • A significant challenge facing the machine learning platforms market is the complexity surrounding data governance and the growing demand for responsible AI. Navigating the landscape of compliance with data privacy regulations requires platforms with strong AI governance and observability features. For high-stakes applications, model auditability is non-negotiable, and platforms must offer clear model explainability to build trust.
  • Organizations are investing in secure, scalable generative AI that can be fine-tuned while protecting sensitive information, with some firms seeing a 20% improvement in risk mitigation through better governance. The use of a model gateway for controlled access to various foundational models is becoming a standard security practice.
  • Furthermore, the technical difficulty of detecting and mitigating model bias and applying advanced techniques like collaborative filtering without introducing fairness issues remains a critical hurdle for widespread, ethical AI adoption.

Exclusive Technavio Analysis on Customer Landscape

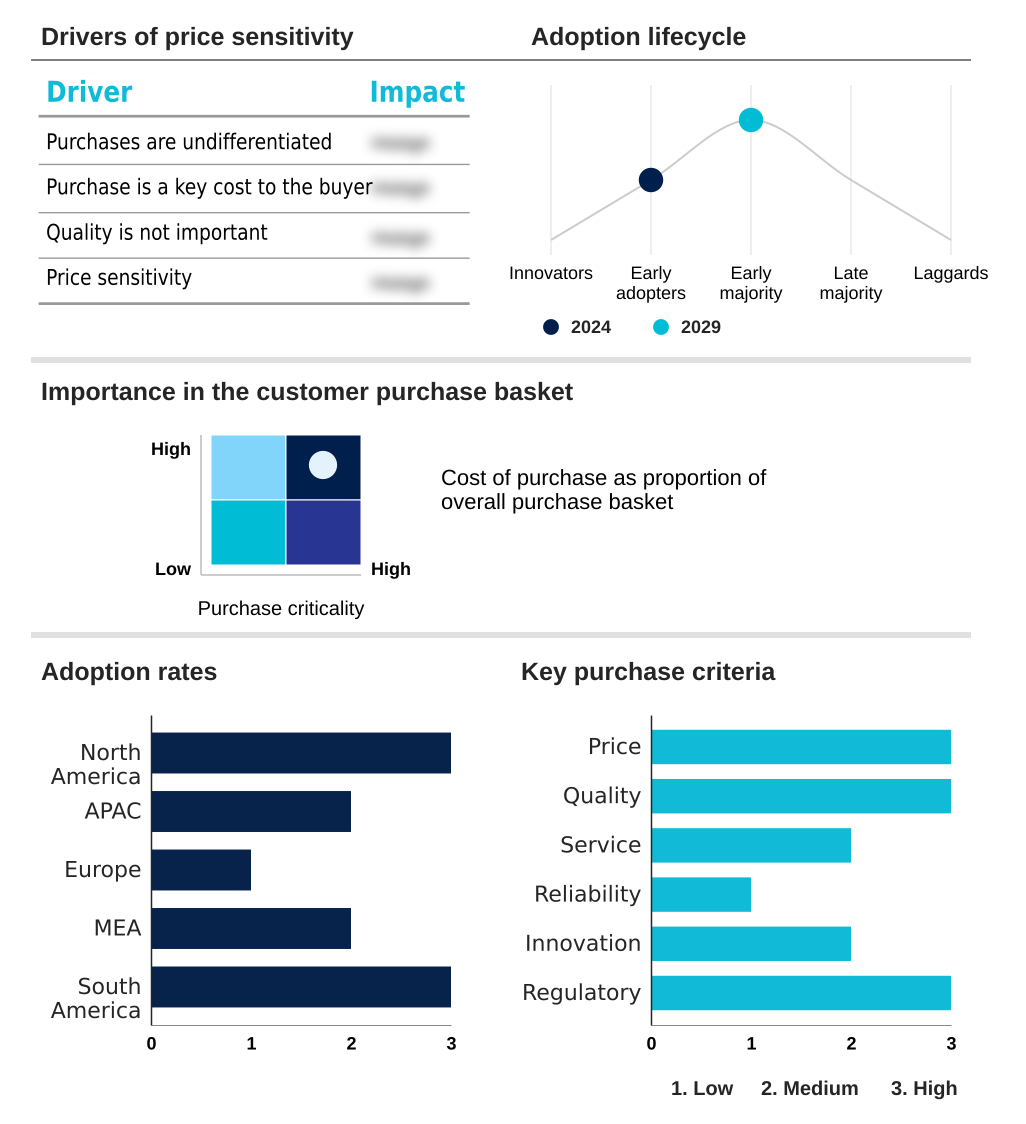
The machine learning (ml) platforms market forecasting report includes the adoption lifecycle of the market, covering from the innovator’s stage to the laggard’s stage. It focuses on adoption rates in different regions based on penetration. Furthermore, the machine learning (ml) platforms market report also includes key purchase criteria and drivers of price sensitivity to help companies evaluate and develop their market growth analysis strategies.

Customer Landscape of Machine Learning (ML) Platforms Industry

Competitive Landscape

Companies are implementing various strategies, such as strategic alliances, machine learning (ml) platforms market forecast, partnerships, mergers and acquisitions, geographical expansion, and product/service launches, to enhance their presence in the industry.

Altair Engineering Inc. - Offerings include integrated platforms that streamline the complete machine learning lifecycle, from data preparation and model development to deployment, monitoring, and governance in enterprise environments.

The industry research and growth report includes detailed analyses of the competitive landscape of the market and information about key companies, including:

  • Altair Engineering Inc.
  • Alteryx Inc.
  • Amazon Web Services Inc.
  • Anaconda Inc.
  • Baidu Inc.
  • Databricks Inc.
  • DataRobot Inc.
  • Google LLC
  • H2O.ai Inc.
  • Hugging Face
  • Intel Corp.
  • IBM Corp.
  • KNIME AG
  • Microsoft Corp.
  • NVIDIA Corp.
  • Oracle Corp.
  • SAP SE
  • SAS Institute Inc.
  • The MathWorks Inc.
  • TIBCO Software Inc.

Qualitative and quantitative analysis of companies has been conducted to help clients understand the wider business environment as well as the strengths and weaknesses of key industry players. Data is qualitatively analyzed to categorize companies as pure play, category-focused, industry-focused, and diversified; it is quantitatively analyzed to categorize companies as dominant, leading, strong, tentative, and weak.

Recent Development and News in Machine learning (ml) platforms market

  • In August, 2024, Google LLC announced the general availability of its advanced multimodal model, Gemini Pro, directly within its Vertex AI platform, allowing developers to leverage state-of-the-art generative AI capabilities within a managed, scalable environment.
  • In November, 2024, Amazon Web Services Inc. announced the general availability of Amazon Bedrock, a fully managed service that provides businesses with access to a range of high-performing foundation models from leading AI companies through a single API.
  • In January, 2025, Snowflake Inc. announced the general availability of Snowflake Cortex, a fully managed service providing businesses with access to large language models and advanced AI capabilities directly within the Snowflake Data Cloud.
  • In May, 2025, The Council of the European Union granted its final approval to the landmark Artificial Intelligence Act, imposing stringent requirements on AI systems based on their risk level, mandating rigorous data governance, transparency, and human oversight.

Dive into Technavio’s robust research methodology, blending expert interviews, extensive data synthesis, and validated models for unparalleled Machine Learning (ML) Platforms Market insights. See full methodology.

Market Scope
Page number 315
Base year 2024
Historic period 2019-2023
Forecast period 2025-2029
Growth momentum & CAGR Accelerate at a CAGR of 25.1%
Market growth 2025-2029 USD 37859.3 million
Market structure Fragmented
YoY growth 2024-2025(%) 21.9%
Key countries US, Canada, Mexico, China, Japan, India, South Korea, Australia, Indonesia, Germany, UK, France, Italy, Spain, The Netherlands, Saudi Arabia, UAE, South Africa, Israel, Turkey, Brazil, Argentina and Colombia
Competitive landscape Leading Companies, Market Positioning of Companies, Competitive Strategies, and Industry Risks

Request Free Sample

Research Analyst Overview

  • The machine learning platforms market is defined by the enterprise-wide push to operationalize AI, moving beyond experimentation to scalable production. This shift necessitates comprehensive tools that manage everything from initial data preprocessing and feature engineering to final model deployment and versioning.
  • Key technologies like AutoML, deep learning models, and reinforcement learning are becoming standard, while the rise of large language models and other foundational models is creating new application frontiers. For boardroom consideration, the adoption of responsible AI principles is paramount, as robust data governance and model explainability are now critical for regulatory compliance and maintaining customer trust.
  • For example, platforms offering clear model auditability can reduce compliance-related risks by over 50%. The discipline of MLOps is central to this evolution, with its focus on automated pipelines and continuous monitoring to combat model drift.
  • Success depends on leveraging cloud-native solutions that provide access to GPU acceleration and tensor processing units, enabling efficient development of predictive analytics, natural language processing, computer vision, and recommendation systems using techniques like collaborative filtering.

What are the Key Data Covered in this Machine Learning (ML) Platforms Market Research and Growth Report?

  • What is the expected growth of the Machine Learning (ML) Platforms Market between 2025 and 2029?

    • USD 37.86 billion, at a CAGR of 25.1%

  • What segmentation does the market report cover?

    • The report is segmented by Deployment (Cloud-based, On-premises, and Hybrid), Application (Predictive analytics, Computer vision, Natural language processing, Recommendation systems, and Others), End-user (BFSI, Healthcare and life science, Retail and e-commerce, Manufacturing, and Others) and Geography (North America, APAC, Europe, Middle East and Africa, South America)

  • Which regions are analyzed in the report?

    • North America, APAC, Europe, Middle East and Africa and South America

  • What are the key growth drivers and market challenges?

    • Escalating volume and complexity of data, Persistent scarcity of skilled talent

  • Who are the major players in the Machine Learning (ML) Platforms Market?

    • Altair Engineering Inc., Alteryx Inc., Amazon Web Services Inc., Anaconda Inc., Baidu Inc., Databricks Inc., DataRobot Inc., Google LLC, H2O.ai Inc., Hugging Face, Intel Corp., IBM Corp., KNIME AG, Microsoft Corp., NVIDIA Corp., Oracle Corp., SAP SE, SAS Institute Inc., The MathWorks Inc. and TIBCO Software Inc.

Market Research Insights

  • The market is shaped by the strategic integration of AI into core business functions, where a focus on the end-to-end ml lifecycle is paramount. Platforms offering no-code model building capabilities have seen adoption rates increase by over 25% among non-technical users.
  • The push for scalable ml infrastructure is evident, with organizations achieving up to a 40% reduction in deployment times by leveraging automated machine learning. Furthermore, as enterprises adopt enterprise integration and analytics, the ability to connect disparate data sources becomes critical, with successful projects showing a 20% improvement in decision-making accuracy.
  • The demand for cloud-native solutions continues to grow, driven by the need for flexible, pay-as-you-go access to powerful computational resources like GPU acceleration and specialized tensor processing units, which are essential for advanced AI development.

We can help! Our analysts can customize this machine learning (ml) platforms market research report to meet your requirements.

Get in touch

1. Executive Summary

1.1 Market overview

Executive Summary - Chart on Market Overview
Executive Summary - Data Table on Market Overview
Executive Summary - Chart on Global Market Characteristics
Executive Summary - Chart on Market by Geography
Executive Summary - Chart on Market Segmentation by Deployment
Executive Summary - Chart on Market Segmentation by Application
Executive Summary - Chart on Market Segmentation by End-user
Executive Summary - Chart on Incremental Growth
Executive Summary - Data Table on Incremental Growth
Executive Summary - Chart on Company Market Positioning

2. Technavio Analysis

2.1 Analysis of price sensitivity, lifecycle, customer purchase basket, adoption rates, and purchase criteria

2.2 Criticality of inputs and Factors of differentiation

Chart on Overview on criticality of inputs and factors of differentiation

2.3 Factors of disruption

Chart on Overview on factors of disruption

2.4 Impact of drivers and challenges

Chart on Impact of drivers and challenges in 2024 and 2029

3. Market Landscape

3.1 Market ecosystem

Chart on Parent Market
Data Table on - Parent Market

3.2 Market characteristics

Chart on Market characteristics analysis

3.3 Value chain analysis

Chart on Value chain analysis

4. Market Sizing

4.1 Market definition

Data Table on Offerings of companies included in the market definition

4.2 Market segment analysis

Market segments

4.3 Market size 2024

4.4 Market outlook: Forecast for 2024-2029

Chart on Global - Market size and forecast 2024-2029 ($ million)
Data Table on Global - Market size and forecast 2024-2029 ($ million)
Chart on Global Market: Year-over-year growth 2024-2029 (%)
Data Table on Global Market: Year-over-year growth 2024-2029 (%)

5. Historic Market Size

5.1 Global Machine Learning (ML) Platforms Market 2019 - 2023

Historic Market Size - Data Table on Global Machine Learning (ML) Platforms Market 2019 - 2023 ($ million)

5.2 Deployment segment analysis 2019 - 2023

Historic Market Size - Deployment Segment 2019 - 2023 ($ million)

5.3 Application segment analysis 2019 - 2023

Historic Market Size - Application Segment 2019 - 2023 ($ million)

5.4 End-user segment analysis 2019 - 2023

Historic Market Size - End-user Segment 2019 - 2023 ($ million)

5.5 Geography segment analysis 2019 - 2023

Historic Market Size - Geography Segment 2019 - 2023 ($ million)

5.6 Country segment analysis 2019 - 2023

Historic Market Size - Country Segment 2019 - 2023 ($ million)

6. Five Forces Analysis

6.1 Five forces summary

Five forces analysis - Comparison between 2024 and 2029

6.2 Bargaining power of buyers

Bargaining power of buyers - Impact of key factors 2024 and 2029

6.3 Bargaining power of suppliers

Bargaining power of suppliers - Impact of key factors in 2024 and 2029

6.4 Threat of new entrants

Threat of new entrants - Impact of key factors in 2024 and 2029

6.5 Threat of substitutes

Threat of substitutes - Impact of key factors in 2024 and 2029

6.6 Threat of rivalry

Threat of rivalry - Impact of key factors in 2024 and 2029

6.7 Market condition

Chart on Market condition - Five forces 2024 and 2029

7. Market Segmentation by Deployment

7.1 Market segments

Chart on Deployment - Market share 2024-2029 (%)
Data Table on Deployment - Market share 2024-2029 (%)

7.2 Comparison by Deployment

Chart on Comparison by Deployment
Data Table on Comparison by Deployment

7.3 Cloud-based - Market size and forecast 2024-2029

Chart on Cloud-based - Market size and forecast 2024-2029 ($ million)
Data Table on Cloud-based - Market size and forecast 2024-2029 ($ million)
Chart on Cloud-based - Year-over-year growth 2024-2029 (%)
Data Table on Cloud-based - Year-over-year growth 2024-2029 (%)

7.4 On-premises - Market size and forecast 2024-2029

Chart on On-premises - Market size and forecast 2024-2029 ($ million)
Data Table on On-premises - Market size and forecast 2024-2029 ($ million)
Chart on On-premises - Year-over-year growth 2024-2029 (%)
Data Table on On-premises - Year-over-year growth 2024-2029 (%)

7.5 Hybrid - Market size and forecast 2024-2029

Chart on Hybrid - Market size and forecast 2024-2029 ($ million)
Data Table on Hybrid - Market size and forecast 2024-2029 ($ million)
Chart on Hybrid - Year-over-year growth 2024-2029 (%)
Data Table on Hybrid - Year-over-year growth 2024-2029 (%)

7.6 Market opportunity by Deployment

Market opportunity by Deployment ($ million)
Data Table on Market opportunity by Deployment ($ million)

8. Market Segmentation by Application

8.1 Market segments

Chart on Application - Market share 2024-2029 (%)
Data Table on Application - Market share 2024-2029 (%)

8.2 Comparison by Application

Chart on Comparison by Application
Data Table on Comparison by Application

8.3 Predictive analytics - Market size and forecast 2024-2029

Chart on Predictive analytics - Market size and forecast 2024-2029 ($ million)
Data Table on Predictive analytics - Market size and forecast 2024-2029 ($ million)
Chart on Predictive analytics - Year-over-year growth 2024-2029 (%)
Data Table on Predictive analytics - Year-over-year growth 2024-2029 (%)

8.4 Computer vision - Market size and forecast 2024-2029

Chart on Computer vision - Market size and forecast 2024-2029 ($ million)
Data Table on Computer vision - Market size and forecast 2024-2029 ($ million)
Chart on Computer vision - Year-over-year growth 2024-2029 (%)
Data Table on Computer vision - Year-over-year growth 2024-2029 (%)

8.5 Natural language processing - Market size and forecast 2024-2029

Chart on Natural language processing - Market size and forecast 2024-2029 ($ million)
Data Table on Natural language processing - Market size and forecast 2024-2029 ($ million)
Chart on Natural language processing - Year-over-year growth 2024-2029 (%)
Data Table on Natural language processing - Year-over-year growth 2024-2029 (%)

8.6 Recommendation systems - Market size and forecast 2024-2029

Chart on Recommendation systems - Market size and forecast 2024-2029 ($ million)
Data Table on Recommendation systems - Market size and forecast 2024-2029 ($ million)
Chart on Recommendation systems - Year-over-year growth 2024-2029 (%)
Data Table on Recommendation systems - Year-over-year growth 2024-2029 (%)

8.7 Others - Market size and forecast 2024-2029

Chart on Others - Market size and forecast 2024-2029 ($ million)
Data Table on Others - Market size and forecast 2024-2029 ($ million)
Chart on Others - Year-over-year growth 2024-2029 (%)
Data Table on Others - Year-over-year growth 2024-2029 (%)

8.8 Market opportunity by Application

Market opportunity by Application ($ million)
Data Table on Market opportunity by Application ($ million)

9. Market Segmentation by End-user

9.1 Market segments

Chart on End-user - Market share 2024-2029 (%)
Data Table on End-user - Market share 2024-2029 (%)

9.2 Comparison by End-user

Chart on Comparison by End-user
Data Table on Comparison by End-user

9.3 BFSI - Market size and forecast 2024-2029

Chart on BFSI - Market size and forecast 2024-2029 ($ million)
Data Table on BFSI - Market size and forecast 2024-2029 ($ million)
Chart on BFSI - Year-over-year growth 2024-2029 (%)
Data Table on BFSI - Year-over-year growth 2024-2029 (%)

9.4 Healthcare and life science - Market size and forecast 2024-2029

Chart on Healthcare and life science - Market size and forecast 2024-2029 ($ million)
Data Table on Healthcare and life science - Market size and forecast 2024-2029 ($ million)
Chart on Healthcare and life science - Year-over-year growth 2024-2029 (%)
Data Table on Healthcare and life science - Year-over-year growth 2024-2029 (%)

9.5 Retail and e-commerce - Market size and forecast 2024-2029

Chart on Retail and e-commerce - Market size and forecast 2024-2029 ($ million)
Data Table on Retail and e-commerce - Market size and forecast 2024-2029 ($ million)
Chart on Retail and e-commerce - Year-over-year growth 2024-2029 (%)
Data Table on Retail and e-commerce - Year-over-year growth 2024-2029 (%)

9.6 Manufacturing - Market size and forecast 2024-2029

Chart on Manufacturing - Market size and forecast 2024-2029 ($ million)
Data Table on Manufacturing - Market size and forecast 2024-2029 ($ million)
Chart on Manufacturing - Year-over-year growth 2024-2029 (%)
Data Table on Manufacturing - Year-over-year growth 2024-2029 (%)

9.7 Others - Market size and forecast 2024-2029

Chart on Others - Market size and forecast 2024-2029 ($ million)
Data Table on Others - Market size and forecast 2024-2029 ($ million)
Chart on Others - Year-over-year growth 2024-2029 (%)
Data Table on Others - Year-over-year growth 2024-2029 (%)

9.8 Market opportunity by End-user

Market opportunity by End-user ($ million)
Data Table on Market opportunity by End-user ($ million)

10. Customer Landscape

10.1 Customer landscape overview

Analysis of price sensitivity, lifecycle, customer purchase basket, adoption rates, and purchase criteria

11. Geographic Landscape

11.1 Geographic segmentation

Chart on Market share by geography 2024-2029 (%)
Data Table on Market share by geography 2024-2029 (%)

11.2 Geographic comparison

Chart on Geographic comparison
Data Table on Geographic comparison

11.3 North America - Market size and forecast 2024-2029

Chart on North America - Market size and forecast 2024-2029 ($ million)
Data Table on North America - Market size and forecast 2024-2029 ($ million)
Chart on North America - Year-over-year growth 2024-2029 (%)
Data Table on North America - Year-over-year growth 2024-2029 (%)
Chart on Regional Comparison - North America
Data Table on Regional Comparison - North America

11.3.1 US - Market size and forecast 2024-2029

Chart on US - Market size and forecast 2024-2029 ($ million)
Data Table on US - Market size and forecast 2024-2029 ($ million)
Chart on US - Year-over-year growth 2024-2029 (%)
Data Table on US - Year-over-year growth 2024-2029 (%)

11.3.2 Canada - Market size and forecast 2024-2029

Chart on Canada - Market size and forecast 2024-2029 ($ million)
Data Table on Canada - Market size and forecast 2024-2029 ($ million)
Chart on Canada - Year-over-year growth 2024-2029 (%)
Data Table on Canada - Year-over-year growth 2024-2029 (%)

11.3.3 Mexico - Market size and forecast 2024-2029

Chart on Mexico - Market size and forecast 2024-2029 ($ million)
Data Table on Mexico - Market size and forecast 2024-2029 ($ million)
Chart on Mexico - Year-over-year growth 2024-2029 (%)
Data Table on Mexico - Year-over-year growth 2024-2029 (%)

11.4 APAC - Market size and forecast 2024-2029

Chart on APAC - Market size and forecast 2024-2029 ($ million)
Data Table on APAC - Market size and forecast 2024-2029 ($ million)
Chart on APAC - Year-over-year growth 2024-2029 (%)
Data Table on APAC - Year-over-year growth 2024-2029 (%)
Chart on Regional Comparison - APAC
Data Table on Regional Comparison - APAC

11.4.1 China - Market size and forecast 2024-2029

Chart on China - Market size and forecast 2024-2029 ($ million)
Data Table on China - Market size and forecast 2024-2029 ($ million)
Chart on China - Year-over-year growth 2024-2029 (%)
Data Table on China - Year-over-year growth 2024-2029 (%)

11.4.2 Japan - Market size and forecast 2024-2029

Chart on Japan - Market size and forecast 2024-2029 ($ million)
Data Table on Japan - Market size and forecast 2024-2029 ($ million)
Chart on Japan - Year-over-year growth 2024-2029 (%)
Data Table on Japan - Year-over-year growth 2024-2029 (%)

11.4.3 India - Market size and forecast 2024-2029

Chart on India - Market size and forecast 2024-2029 ($ million)
Data Table on India - Market size and forecast 2024-2029 ($ million)
Chart on India - Year-over-year growth 2024-2029 (%)
Data Table on India - Year-over-year growth 2024-2029 (%)

11.4.4 South Korea - Market size and forecast 2024-2029

Chart on South Korea - Market size and forecast 2024-2029 ($ million)
Data Table on South Korea - Market size and forecast 2024-2029 ($ million)
Chart on South Korea - Year-over-year growth 2024-2029 (%)
Data Table on South Korea - Year-over-year growth 2024-2029 (%)

11.4.5 Australia - Market size and forecast 2024-2029

Chart on Australia - Market size and forecast 2024-2029 ($ million)
Data Table on Australia - Market size and forecast 2024-2029 ($ million)
Chart on Australia - Year-over-year growth 2024-2029 (%)
Data Table on Australia - Year-over-year growth 2024-2029 (%)

11.4.6 Indonesia - Market size and forecast 2024-2029

Chart on Indonesia - Market size and forecast 2024-2029 ($ million)
Data Table on Indonesia - Market size and forecast 2024-2029 ($ million)
Chart on Indonesia - Year-over-year growth 2024-2029 (%)
Data Table on Indonesia - Year-over-year growth 2024-2029 (%)

11.5 Europe - Market size and forecast 2024-2029

Chart on Europe - Market size and forecast 2024-2029 ($ million)
Data Table on Europe - Market size and forecast 2024-2029 ($ million)
Chart on Europe - Year-over-year growth 2024-2029 (%)
Data Table on Europe - Year-over-year growth 2024-2029 (%)
Chart on Regional Comparison - Europe
Data Table on Regional Comparison - Europe

11.5.1 Germany - Market size and forecast 2024-2029

Chart on Germany - Market size and forecast 2024-2029 ($ million)
Data Table on Germany - Market size and forecast 2024-2029 ($ million)
Chart on Germany - Year-over-year growth 2024-2029 (%)
Data Table on Germany - Year-over-year growth 2024-2029 (%)

11.5.2 UK - Market size and forecast 2024-2029

Chart on UK - Market size and forecast 2024-2029 ($ million)
Data Table on UK - Market size and forecast 2024-2029 ($ million)
Chart on UK - Year-over-year growth 2024-2029 (%)
Data Table on UK - Year-over-year growth 2024-2029 (%)

11.5.3 France - Market size and forecast 2024-2029

Chart on France - Market size and forecast 2024-2029 ($ million)
Data Table on France - Market size and forecast 2024-2029 ($ million)
Chart on France - Year-over-year growth 2024-2029 (%)
Data Table on France - Year-over-year growth 2024-2029 (%)

11.5.4 Italy - Market size and forecast 2024-2029

Chart on Italy - Market size and forecast 2024-2029 ($ million)
Data Table on Italy - Market size and forecast 2024-2029 ($ million)
Chart on Italy - Year-over-year growth 2024-2029 (%)
Data Table on Italy - Year-over-year growth 2024-2029 (%)

11.5.5 Spain - Market size and forecast 2024-2029

Chart on Spain - Market size and forecast 2024-2029 ($ million)
Data Table on Spain - Market size and forecast 2024-2029 ($ million)
Chart on Spain - Year-over-year growth 2024-2029 (%)
Data Table on Spain - Year-over-year growth 2024-2029 (%)

11.5.6 The Netherlands - Market size and forecast 2024-2029

Chart on The Netherlands - Market size and forecast 2024-2029 ($ million)
Data Table on The Netherlands - Market size and forecast 2024-2029 ($ million)
Chart on The Netherlands - Year-over-year growth 2024-2029 (%)
Data Table on The Netherlands - Year-over-year growth 2024-2029 (%)

11.6 Middle East and Africa - Market size and forecast 2024-2029

Chart on Middle East and Africa - Market size and forecast 2024-2029 ($ million)
Data Table on Middle East and Africa - Market size and forecast 2024-2029 ($ million)
Chart on Middle East and Africa - Year-over-year growth 2024-2029 (%)
Data Table on Middle East and Africa - Year-over-year growth 2024-2029 (%)
Chart on Regional Comparison - Middle East and Africa
Data Table on Regional Comparison - Middle East and Africa

11.6.1 Saudi Arabia - Market size and forecast 2024-2029

Chart on Saudi Arabia - Market size and forecast 2024-2029 ($ million)
Data Table on Saudi Arabia - Market size and forecast 2024-2029 ($ million)
Chart on Saudi Arabia - Year-over-year growth 2024-2029 (%)
Data Table on Saudi Arabia - Year-over-year growth 2024-2029 (%)

11.6.2 UAE - Market size and forecast 2024-2029

Chart on UAE - Market size and forecast 2024-2029 ($ million)
Data Table on UAE - Market size and forecast 2024-2029 ($ million)
Chart on UAE - Year-over-year growth 2024-2029 (%)
Data Table on UAE - Year-over-year growth 2024-2029 (%)

11.6.3 South Africa - Market size and forecast 2024-2029

Chart on South Africa - Market size and forecast 2024-2029 ($ million)
Data Table on South Africa - Market size and forecast 2024-2029 ($ million)
Chart on South Africa - Year-over-year growth 2024-2029 (%)
Data Table on South Africa - Year-over-year growth 2024-2029 (%)

11.6.4 Israel - Market size and forecast 2024-2029

Chart on Israel - Market size and forecast 2024-2029 ($ million)
Data Table on Israel - Market size and forecast 2024-2029 ($ million)
Chart on Israel - Year-over-year growth 2024-2029 (%)
Data Table on Israel - Year-over-year growth 2024-2029 (%)

11.6.5 Turkey - Market size and forecast 2024-2029

Chart on Turkey - Market size and forecast 2024-2029 ($ million)
Data Table on Turkey - Market size and forecast 2024-2029 ($ million)
Chart on Turkey - Year-over-year growth 2024-2029 (%)
Data Table on Turkey - Year-over-year growth 2024-2029 (%)

11.7 South America - Market size and forecast 2024-2029

Chart on South America - Market size and forecast 2024-2029 ($ million)
Data Table on South America - Market size and forecast 2024-2029 ($ million)
Chart on South America - Year-over-year growth 2024-2029 (%)
Data Table on South America - Year-over-year growth 2024-2029 (%)
Chart on Regional Comparison - South America
Data Table on Regional Comparison - South America

11.7.1 Brazil - Market size and forecast 2024-2029

Chart on Brazil - Market size and forecast 2024-2029 ($ million)
Data Table on Brazil - Market size and forecast 2024-2029 ($ million)
Chart on Brazil - Year-over-year growth 2024-2029 (%)
Data Table on Brazil - Year-over-year growth 2024-2029 (%)

11.7.2 Argentina - Market size and forecast 2024-2029

Chart on Argentina - Market size and forecast 2024-2029 ($ million)
Data Table on Argentina - Market size and forecast 2024-2029 ($ million)
Chart on Argentina - Year-over-year growth 2024-2029 (%)
Data Table on Argentina - Year-over-year growth 2024-2029 (%)

11.7.3 Colombia - Market size and forecast 2024-2029

Chart on Colombia - Market size and forecast 2024-2029 ($ million)
Data Table on Colombia - Market size and forecast 2024-2029 ($ million)
Chart on Colombia - Year-over-year growth 2024-2029 (%)
Data Table on Colombia - Year-over-year growth 2024-2029 (%)

11.8 Market opportunity by geography

Market opportunity by geography ($ million)
Data Tables on Market opportunity by geography ($ million)

12. Drivers, Challenges, and Opportunity

12.1 Market drivers

Escalating volume and complexity of data
Democratization of artificial intelligence through cloud computing
Increasing business integration and clear return on investment

12.2 Market challenges

Persistent scarcity of skilled talent
Concerns surrounding data quality, governance, and security
High cost and complexity of development and infrastructure

12.3 Impact of drivers and challenges

Impact of drivers and challenges in 2024 and 2029

12.4 Market opportunities

Mainstream adoption of MLOps
Integration of generative AI and large language models
Increasing focus on responsible AI and explainability

13. Competitive Landscape

13.1 Overview

13.2

Overview on criticality of inputs and factors of differentiation

13.3 Landscape disruption

Overview on factors of disruption

13.4 Industry risks

Impact of key risks on business

14. Competitive Analysis

14.1 Companies profiled

Companies covered

14.2 Company ranking index

14.3 Market positioning of companies

Matrix on companies position and classification

14.4 Altair Engineering Inc.

Altair Engineering Inc. - Overview
Altair Engineering Inc. - Business segments
Altair Engineering Inc. - Key news
Altair Engineering Inc. - Key offerings
Altair Engineering Inc. - Segment focus
SWOT

14.5 Alteryx Inc.

Alteryx Inc. - Overview
Alteryx Inc. - Product / Service
Alteryx Inc. - Key news
Alteryx Inc. - Key offerings
SWOT

14.6 Amazon Web Services Inc.

Amazon Web Services Inc. - Overview
Amazon Web Services Inc. - Product / Service
Amazon Web Services Inc. - Key news
Amazon Web Services Inc. - Key offerings
SWOT

14.7 Baidu Inc.

Baidu Inc. - Overview
Baidu Inc. - Business segments
Baidu Inc. - Key offerings
Baidu Inc. - Segment focus
SWOT

14.8 Databricks Inc.

Databricks Inc. - Overview
Databricks Inc. - Product / Service
Databricks Inc. - Key offerings
SWOT

14.9 DataRobot Inc.

DataRobot Inc. - Overview
DataRobot Inc. - Product / Service
DataRobot Inc. - Key offerings
SWOT

14.10 Google LLC

Google LLC - Overview
Google LLC - Product / Service
Google LLC - Key offerings
SWOT

14.11 H2O.ai Inc.

H2O.ai Inc. - Overview
H2O.ai Inc. - Product / Service
H2O.ai Inc. - Key offerings
SWOT

14.12 Intel Corp.

Intel Corp. - Overview
Intel Corp. - Business segments
Intel Corp. - Key news
Intel Corp. - Key offerings
Intel Corp. - Segment focus
SWOT

14.13 IBM Corp.

IBM Corp. - Overview
IBM Corp. - Business segments
IBM Corp. - Key news
IBM Corp. - Key offerings
IBM Corp. - Segment focus
SWOT

14.14 KNIME AG

KNIME AG - Overview
KNIME AG - Product / Service
KNIME AG - Key offerings
SWOT

14.15 Microsoft Corp.

Microsoft Corp. - Overview
Microsoft Corp. - Business segments
Microsoft Corp. - Key news
Microsoft Corp. - Key offerings
Microsoft Corp. - Segment focus
SWOT

14.16 NVIDIA Corp.

NVIDIA Corp. - Overview
NVIDIA Corp. - Business segments
NVIDIA Corp. - Key news
NVIDIA Corp. - Key offerings
NVIDIA Corp. - Segment focus
SWOT

14.17 SAS Institute Inc.

SAS Institute Inc. - Overview
SAS Institute Inc. - Product / Service
SAS Institute Inc. - Key news
SAS Institute Inc. - Key offerings
SWOT

14.18 TIBCO Software Inc.

TIBCO Software Inc. - Overview
TIBCO Software Inc. - Product / Service
TIBCO Software Inc. - Key offerings
SWOT

15. Appendix

15.1 Scope of the report

Market definition
Objectives
Notes and caveats

15.2 Inclusions and exclusions checklist

Inclusions checklist
Exclusions checklist

15.3 Currency conversion rates for US$

15.4 Research methodology

15.5 Data procurement

Information sources

15.6 Data validation

15.7 Validation techniques employed for market sizing

15.8 Data synthesis

15.9 360 degree market analysis

15.10 List of abbreviations

Research Methodology

Technavio presents a detailed picture of the market by way of study, synthesis, and summation of data from multiple sources. The analysts have presented the various facets of the market with a particular focus on identifying the key industry influencers. The data thus presented is comprehensive, reliable, and the result of extensive research, both primary and secondary.

INFORMATION SOURCES

Primary sources

  • Manufacturers and suppliers
  • Channel partners
  • Industry experts
  • Strategic decision makers

Secondary sources

  • Industry journals and periodicals
  • Government data
  • Financial reports of key industry players
  • Historical data
  • Press releases

DATA ANALYSIS

Data Synthesis

  • Collation of data
  • Estimation of key figures
  • Analysis of derived insights

Data Validation

  • Triangulation with data models
  • Reference against proprietary databases
  • Corroboration with industry experts

REPORT WRITING

Qualitative

  • Market drivers
  • Market challenges
  • Market trends
  • Five forces analysis

Quantitative

  • Market size and forecast
  • Market segmentation
  • Geographical insights
  • Competitive landscape

Interested in this report?

Get your sample now to see our research methodology and insights!

Download Now

Frequently Asked Questions

Machine Learning (ML) Platforms market growth will increase by USD 37859.3 million during 2025-2029.

The Machine Learning (ML) Platforms market is expected to grow at a CAGR of 25.1% during 2025-2029.

Machine Learning (ML) Platforms market is segmented by Deployment (Cloud-based, On-premises, Hybrid) Application (Predictive analytics, Computer vision, Natural language processing, Recommendation systems, Others) End-user (BFSI, Healthcare and life science, Retail and e-commerce, Manufacturing, Others)

Altair Engineering Inc., Alteryx Inc., Amazon Web Services Inc., Anaconda Inc., Baidu Inc., Databricks Inc., DataRobot Inc., Google LLC, H2O.ai Inc., Hugging Face, Intel Corp., IBM Corp., KNIME AG, Microsoft Corp., NVIDIA Corp., Oracle Corp., SAP SE, SAS Institute Inc., The MathWorks Inc., TIBCO Software Inc. are a few of the key vendors in the Machine Learning (ML) Platforms market.

North America will register the highest growth rate of 32.5% among the other regions. Therefore, the Machine Learning (ML) Platforms market in North America is expected to garner significant business opportunities for the vendors during the forecast period.

US, Canada, Mexico, China, Japan, India, South Korea, Australia, Indonesia, Germany, UK, France, Italy, Spain, The Netherlands, Saudi Arabia, UAE, South Africa, Israel, Turkey, Brazil, Argentina, Colombia

  • Escalating volume and complexity of data is the driving factor this market.

The Machine Learning (ML) Platforms market vendors should focus on grabbing business opportunities from the Deployment segment as it accounted for the largest market share in the base year.