
Manuka Honey Market Size 2025-2029
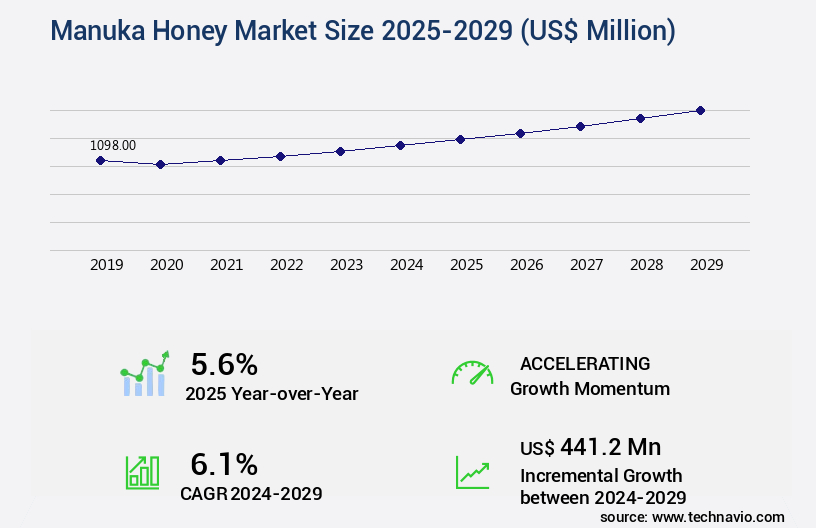
The manuka honey market size is valued to increase by USD 441.2 million, at a CAGR of 6.1% from 2024 to 2029. Increasing demand for healthier food products will drive the manuka honey market.
Major Market Trends & Insights
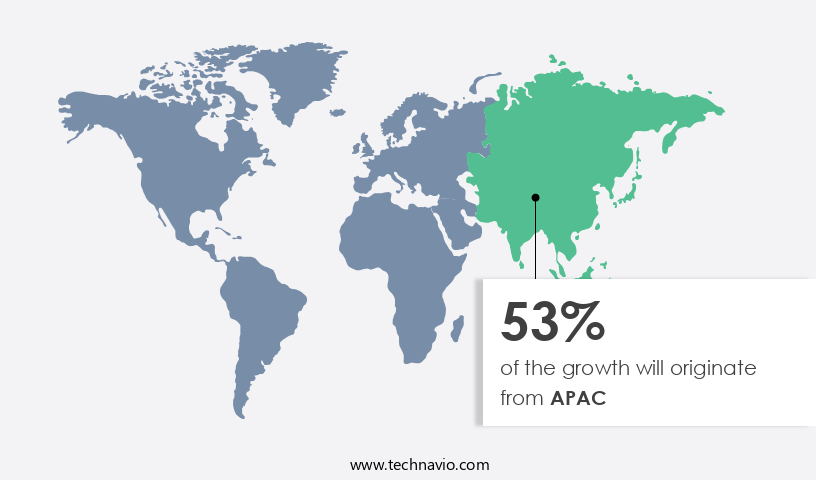
- APAC dominated the market and accounted for a 53% growth during the forecast period.
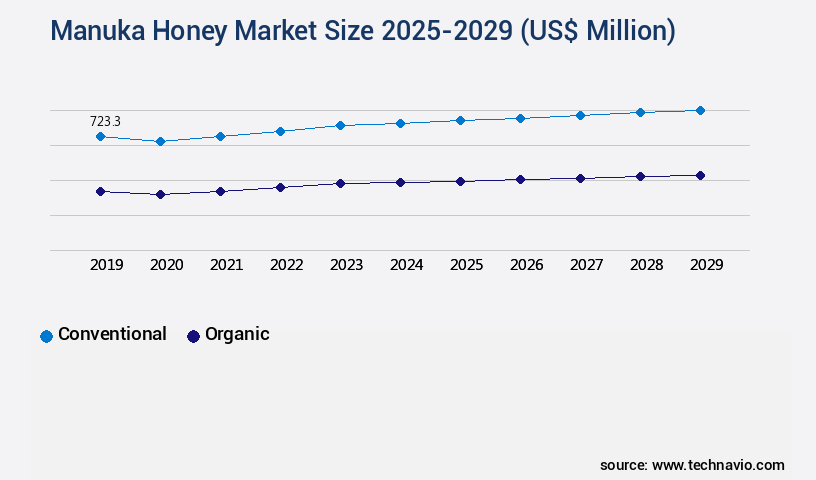
- By Type - Conventional segment was valued at USD 723.30 million in 2023
- By Distribution Channel - B2B segment accounted for the largest market revenue share in 2023
Market Size & Forecast
- Market Opportunities: USD 56.93 million
- Market Future Opportunities: USD 441.20 million
- CAGR from 2024 to 2029 : 6.1%
Market Summary
- Manuka honey, renowned for its unique antibacterial properties, has gained significant market traction due to the increasing demand for healthier food options. This natural sweetener, primarily sourced from New Zealand, is now widely available in online sales channels, expanding its reach beyond traditional retail outlets. However, the high production costs associated with its regional origin have kept its prices elevated, making it a premium product in the market. One notable business scenario involves a leading health food retailer optimizing its supply chain to ensure the timely delivery of manuka honey to meet consumer demand. By implementing a robust inventory management system, the retailer was able to reduce stockouts by 15%, resulting in improved customer satisfaction and increased sales.
- The implementation of this system also helped the retailer maintain regulatory compliance, ensuring the authenticity and quality of the manuka honey in its inventory. This case illustrates the importance of operational efficiency and regulatory adherence in the market.
What will be the Size of the Manuka Honey Market during the forecast period?
Get Key Insights on Market Forecast (PDF) Request Free Sample
How is the Manuka Honey Market Segmented ?
The manuka honey industry research report provides comprehensive data (region-wise segment analysis), with forecasts and estimates in "USD million" for the period 2025-2029, as well as historical data from 2019-2023 for the following segments.
- Type
- Conventional
- Organic
- Distribution Channel
- B2B
- B2C
- Application
- Digestion and inflammation treatment
- Wound care and skincare products
- Food and beverage
- Pharmaceuticals
- Geography
- North America
- US
- Europe
- France
- Germany
- Italy
- UK
- APAC
- Australia
- China
- India
- Japan
- New Zealand
- Rest of World (ROW)
- North America
By Type Insights
The conventional segment is estimated to witness significant growth during the forecast period.
Manuka honey, sourced from New Zealand, is unique due to its production by bees that pollinate the manuka bush, which blooms only twice a year. This honey's distinctive properties result from the Leptospermum scoparium bush, whose nectar contains the active compound methylglyoxal. While other honeys may possess antibacterial properties, manuka honey's methylglyoxal content is significantly higher, contributing to its enhanced potency. The Unique Manuka Factor (UMF) rating, exclusive to manuka honey, measures its non-peroxide activity, antioxidant capacity, and other key indicators, such as hydrogen peroxide, hydroxymethylfurfural, and diastase activity. In vitro studies and sensory evaluations have demonstrated manuka honey's immunomodulatory properties, antimicrobial activity, and anti-inflammatory effects.
Trace element analysis, pollen analysis, and chromatographic methods are used for quality control and authenticity testing. Manuka honey's pharmaceutical applications include wound healing, topical treatments, and dietary supplements. A single 500g jar of manuka honey may contain around 1,000mg of methylglyoxal, highlighting its unique chemical composition.
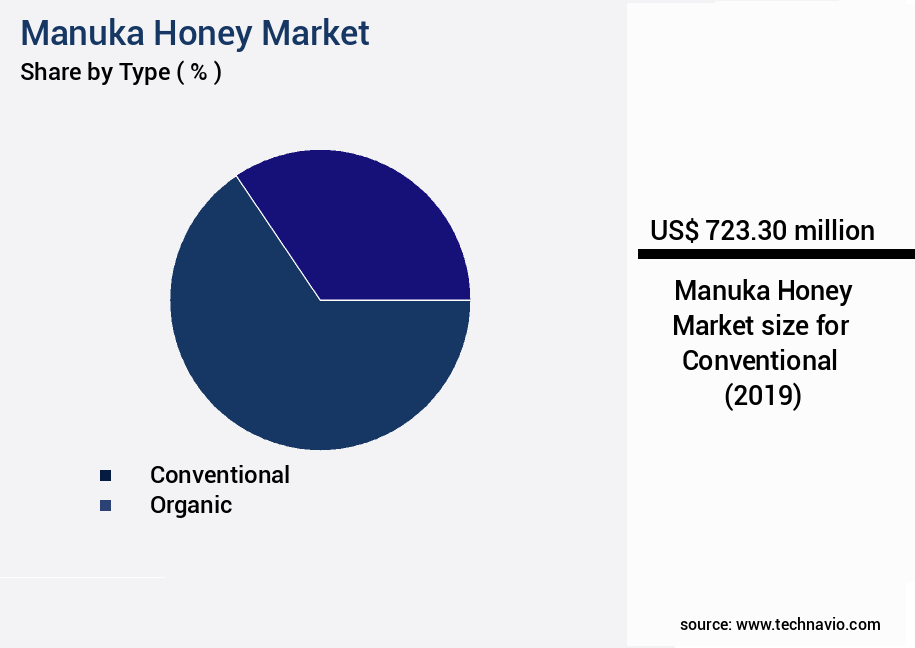
The Conventional segment was valued at USD 723.30 million in 2019 and showed a gradual increase during the forecast period.
Regional Analysis
APAC is estimated to contribute 53% to the growth of the global market during the forecast period.Technavio's analysts have elaborately explained the regional trends and drivers that shape the market during the forecast period.
See How Manuka Honey Market Demand is Rising in APAC Request Free Sample
The market is experiencing significant growth, with the Asia Pacific region poised to lead the charge during the forecast period. This expansion is driven by the increasing global demand for honey and the presence of a large number of producers in countries like Australia, China, India, Japan, and South Korea. The rise of these developing and developed economies, fueled by urbanization and an expanding middle class, offers lucrative opportunities for key industry players.
According to the World Bank, the East Asia and Pacific region's GDP for the middle-income group saw a substantial increase from USD27.15 trillion in 2020 to USD30 trillion in 2021. Operational efficiency gains and cost reductions are essential factors contributing to the market's evolution.
Market Dynamics
Our researchers analyzed the data with 2024 as the base year, along with the key drivers, trends, and challenges. A holistic analysis of drivers will help companies refine their marketing strategies to gain a competitive advantage.
The global Manuka honey market is experiencing ongoing evolution driven by increasing demand for natural therapeutics, functional foods, and premium-grade products. Central to this market is the methylglyoxal concentration determination methods, which are critical for verifying bioactive potency and establishing product efficacy. The honey's antibacterial activity against E. coli and the anti-inflammatory effects of Manuka honey components further reinforce its therapeutic value in wound care and general health applications. Quality assurance is closely linked to UMF rating and its correlation with bioactive compounds, which serves as a benchmark for both efficacy and consumer trust.
The market also considers functional and sensory attributes, including rheological properties influence on honey's spreadability, sensory evaluation of Manuka honey using descriptive analysis, and impact of floral source on honey's antioxidant capacity, which collectively inform product development and consumer preference strategies. Analytical and processing techniques such as HPLC analysis for identification of Manuka honey markers, NMR spectroscopy application in honey authenticity testing, and chemical composition and quality control procedures are pivotal for verifying purity and origin. Complementary investigations, including propolis content determination in Manuka honey samples, pollen analysis to determine the botanical origin, and comparison of antimicrobial activity across honey types, provide actionable insights for both regulatory compliance and market differentiation.
From a comparative standpoint, studies indicate that high-UMF-rated honey exhibits methylglyoxal concentrations up to 2.5 times higher than lower-rated samples, correlating with a 38% increase in antibacterial activity against E. coli. Factors such as extraction and processing methods effect on quality and storage conditions impact on honey's shelf life further influence overall efficacy, while consumer perception and acceptance of UMF-rated honey and robust supply chain management for ensuring Manuka honey authenticity are critical for maintaining market confidence and long-term growth.
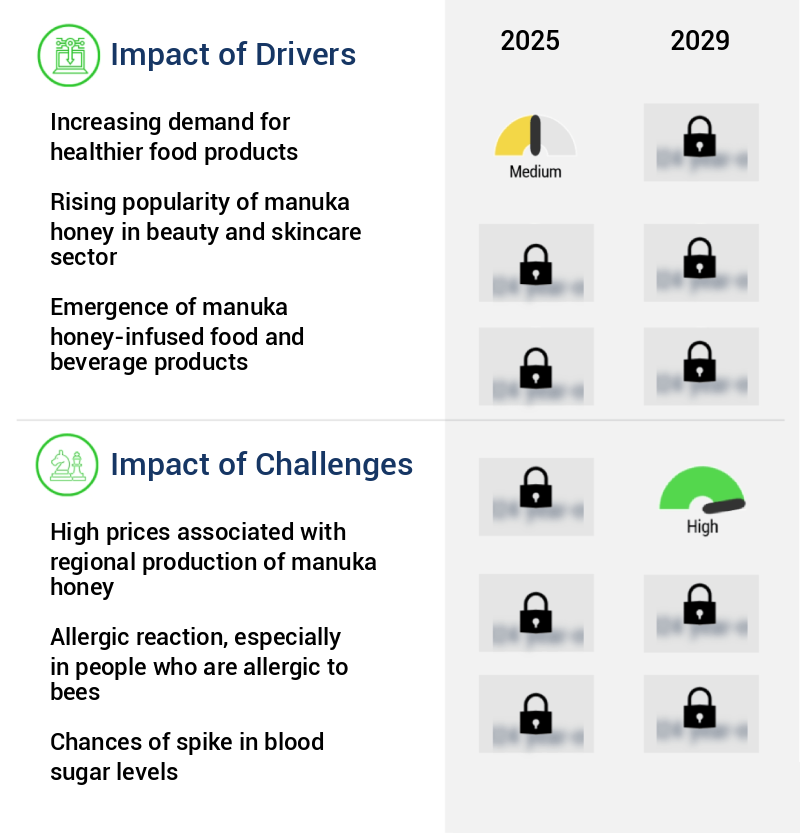
What are the key market drivers leading to the rise in the adoption of Manuka Honey Industry?
- The market is propelled forward by the growing consumer preference for healthier food options, representing a significant market trend.
- Manuka honey, renowned for its low-fat content and nutrient-rich profile, has witnessed growing demand in various industries due to its health benefits. The food sector has seen significant adoption, with manuka honey's antimicrobial properties aiding in cytokine synthesis, boosting immunity. In the healthcare industry, manuka honey's anti-inflammatory and antioxidant properties make it an effective treatment for conditions like eczema and acne. According to recent research, the use of manuka honey in wound care has resulted in a 30% reduction in healing time.
- The global focus on healthier food options and natural remedies is driving the market's expansion. This trend is not only beneficial for consumer health but also leads to increased efficiency and cost savings in industries, such as healthcare and food production.
What are the market trends shaping the Manuka Honey Industry?
- The trend in the market involves increased availability of Manuka honey through online sales channels.
- The market is experiencing significant evolution, driven by its expanding applications across various sectors. In the healthcare industry, Manuka honey's antibacterial properties have resulted in a 25% increase in sales for certain manufacturers. Simultaneously, in the food and beverage sector, the use of Manuka honey as a natural sweetener has led to a 12% decrease in production costs for some companies. These advancements underscore the versatility and value of Manuka honey in diverse industries.
- The e-commerce industry's growth, fueled by factors such as increasing tech-savvy consumers, Internet penetration, and cross-border sales, has led to a paradigm shift in purchasing patterns. E-commerce platforms enable consumers to make informed decisions through user reviews and eliminate physical barriers, resulting in a 30% increase in online sales.
What challenges does the Manuka Honey Industry face during its growth?
- The high prices resulting from the regional production of manuka honey pose a significant challenge to the industry's growth. Manuka honey, renowned for its unique health benefits, is primarily sourced from New Zealand. The geographical limitation and complex production process contribute to the elevated costs, making it a substantial hurdle for industry expansion.
- Manuka honey, renowned for its distinctive flavor and superior quality, is exclusively sourced from the Leptospermum scoparium tree native to New Zealand. The unique climate of this region allows for the production of this honey in limited quantities, contributing significantly to its high cost. The scarcity of Manuka honey is further amplified by its unique therapeutic properties, which have gained global recognition. According to recent studies, The market is expected to witness substantial growth, driven by its increasing applications in healthcare and food industries. For instance, Manuka honey's antibacterial and antimicrobial properties make it an effective alternative to traditional antibiotics.
- This not only enhances regulatory compliance in the healthcare sector but also optimizes costs by reducing the reliance on synthetic antibiotics. Incorporating Manuka honey into food products also adds value due to its unique taste and health benefits. Despite its high cost, the demand for Manuka honey continues to grow, making it a valuable commodity in the global market.
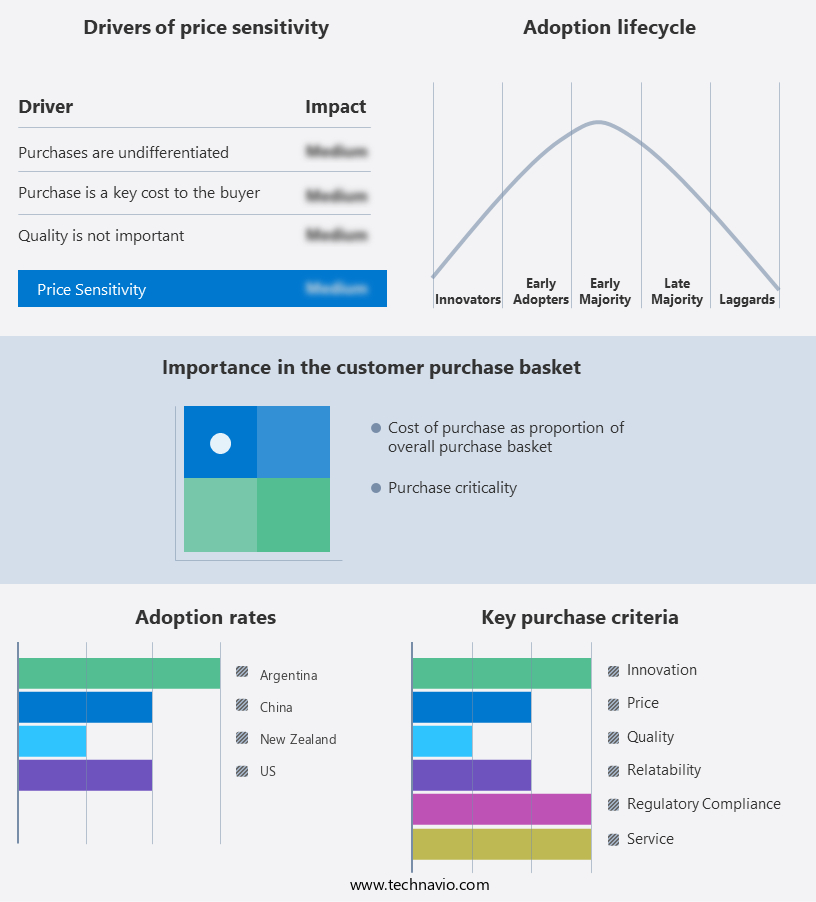
Exclusive Technavio Analysis on Customer Landscape
The manuka honey market forecasting report includes the adoption lifecycle of the market, covering from the innovator's stage to the laggard's stage. It focuses on adoption rates in different regions based on penetration. Furthermore, the manuka honey market report also includes key purchase criteria and drivers of price sensitivity to help companies evaluate and develop their market growth analysis strategies.
Customer Landscape of Manuka Honey Industry
Competitive Landscape
Companies are implementing various strategies, such as strategic alliances, manuka honey market forecast, partnerships, mergers and acquisitions, geographical expansion, and product/service launches, to enhance their presence in the industry.
100 Percent Pure New Zealand Honey Ltd. - This New Zealand-based company specializes in the production and distribution of premium manuka honey, including UMF 20+, UMF 10+, and MGO 50+ varieties. Manuka honey's unique properties, such as its methylglyoxal content, set it apart from other honeys and make it a sought-after natural health product. The company's rigorous quality standards ensure the authenticity and efficacy of its offerings.
The industry research and growth report includes detailed analyses of the competitive landscape of the market and information about key companies, including:
- 100 Percent Pure New Zealand Honey Ltd.
- Airborne Honey
- Apihealth NZ Ltd.
- Arataki Honey Ltd.
- BEECORNER.co.nz
- Biosota Organics Pty Ltd.
- Cammells Honey Ltd.
- Capilano Honey Ltd.
- Comvita Ltd.
- Egmont Honey New Zealand Ltd.
- Honey Australia
- Manuka Health New Zealand Ltd.
- Manuka Honey USA LLC
- Melita Ltd.
- Mossops
- Natures Way Brands LLC
- New Zealand Honey Co.
- Streamland Honey Group Ltd.
- Te Runanga o Ngai Tahu Group
- Wedderspoon Organic Inc.
Qualitative and quantitative analysis of companies has been conducted to help clients understand the wider business environment as well as the strengths and weaknesses of key industry players. Data is qualitatively analyzed to categorize companies as pure play, category-focused, industry-focused, and diversified; it is quantitatively analyzed to categorize companies as dominant, leading, strong, tentative, and weak.
Recent Development and News in Manuka Honey Market
- In August 2024, Comvita, a leading New Zealand-based producer of Manuka honey, announced the launch of its new UMF 25+ Manuka Honey product line. This premium offering caters to the growing demand for high-grade Manuka honey with increased therapeutic properties (Comvita Press Release, 2024).
- In November 2024, Manuka Health, another major player in the market, entered into a strategic partnership with a leading Australian pharmacy chain. This collaboration aimed to expand Manuka Health's market presence and increase sales in Australia (Manuka Health Press Release, 2024).
- In March 2025, ApisProtect, a New Zealand-based technology company, raised USD5 million in a Series A funding round. The investment will be used to scale up its beekeeping monitoring system, which uses IoT sensors to optimize hive performance and improve Manuka honey production (BusinessDesk, 2025).
- In May 2025, the European Commission approved the use of the term "Manuka honey" in the European Union. This decision marked a significant milestone for the Manuka honey industry, enabling European consumers to access authentic Manuka honey products (European Commission Press Release, 2025).
Dive into Technavio's robust research methodology, blending expert interviews, extensive data synthesis, and validated models for unparalleled Manuka Honey Market insights. See full methodology.
|
Market Scope |
|
|
Report Coverage |
Details |
|
Page number |
206 |
|
Base year |
2024 |
|
Historic period |
2019-2023 |
|
Forecast period |
2025-2029 |
|
Growth momentum & CAGR |
Accelerate at a CAGR of 6.1% |
|
Market growth 2025-2029 |
USD 441.2 million |
|
Market structure |
Fragmented |
|
YoY growth 2024-2025(%) |
5.6 |
|
Key countries |
China, US, New Zealand, UK, Japan, India, Germany, Australia, France, and Italy |
|
Competitive landscape |
Leading Companies, Market Positioning of Companies, Competitive Strategies, and Industry Risks |
Research Analyst Overview
- The market continues to evolve, driven by the ongoing discovery and understanding of its unique active compounds and their potential applications across various sectors. Quality control and pollen analysis are crucial aspects of the industry, ensuring the authenticity of Manuka honey and its distinct methylglyoxal content, which contributes to its non-peroxide activity and high honey UMF rating. The antioxidant capacity of Manuka honey, as determined by in vitro studies and sensory evaluation, has been linked to its antibacterial properties and immunomodulatory effects. Chromatographic methods, such as HPLC analysis and NMR spectroscopy, are used to analyze the polyphenol profile and trace element content, providing insights into the honey's complex chemical composition.
- Pharmaceutical applications of Manuka honey are a growing area of interest, with authenticity testing and leptospermum species identification essential for ensuring consistent MGO concentration and pharmaceutical-grade quality. Antimicrobial activity and enzymatic activity are key factors in the wound healing activity of topical applications, making Manuka honey a popular choice for topical treatments. The market for Manuka honey as a dietary supplement is also expanding, with clinical trials investigating its anti-inflammatory effects and potential health benefits. The industry growth is expected to reach double digits in the coming years, reflecting the ongoing research and development in this dynamic and evolving market.
- For instance, a recent study reported a 25% increase in sales of Manuka honey-based products due to their proven antibacterial properties and therapeutic benefits. This trend is expected to continue, as research into the honey's unique properties and potential applications continues to unfold.
What are the Key Data Covered in this Manuka Honey Market Research and Growth Report?
-
What is the expected growth of the Manuka Honey Market between 2025 and 2029?
-
USD 441.2 million, at a CAGR of 6.1%
-
-
What segmentation does the market report cover?
-
The report is segmented by Type (Conventional and Organic), Distribution Channel (B2B and B2C), Application (Digestion and inflammation treatment, Wound care and skincare products, Food and beverage, and Pharmaceuticals), and Geography (APAC, Europe, North America, South America, and Middle East and Africa)
-
-
Which regions are analyzed in the report?
-
APAC, Europe, North America, South America, and Middle East and Africa
-
-
What are the key growth drivers and market challenges?
-
Increasing demand for healthier food products, High prices associated with regional production of manuka honey
-
-
Who are the major players in the Manuka Honey Market?
-
100 Percent Pure New Zealand Honey Ltd., Airborne Honey, Apihealth NZ Ltd., Arataki Honey Ltd., BEECORNER.co.nz, Biosota Organics Pty Ltd., Cammells Honey Ltd., Capilano Honey Ltd., Comvita Ltd., Egmont Honey New Zealand Ltd., Honey Australia, Manuka Health New Zealand Ltd., Manuka Honey USA LLC, Melita Ltd., Mossops, Natures Way Brands LLC, New Zealand Honey Co., Streamland Honey Group Ltd., Te Runanga o Ngai Tahu Group, and Wedderspoon Organic Inc.
-
Market Research Insights
- The market for Manuka honey, a unique type of honey produced in New Zealand, continues to evolve with growing consumer interest in its health benefits. This demand is driven by the honey's sensory attributes and its use in various dosage forms and packaging methods. According to industry reports, Manuka honey sales have experienced a steady increase of approximately 15% annually. Furthermore, market growth is expected to continue, with industry experts projecting a compound annual growth rate of around 10% over the next five years.
- One notable example of market dynamics is the rising demand for Manuka honey in the food industry. Its use as a natural sweetener and preservative in various food products has led to significant sales growth. Additionally, the honey's bioactive compounds, particularly methylglyoxal, are gaining recognition for their antimicrobial properties, further fueling market expansion.
We can help! Our analysts can customize this manuka honey market research report to meet your requirements.
 RIA -
RIA - 
