Clinical Trial Management System (Ctms) Market Analysis, Size, and Forecast 2024-2028: North America (US and Canada), Europe (France, Germany, Italy, and UK), Middle East and Africa (Egypt, KSA, Oman, and UAE), APAC (China, India, and Japan), South America (Argentina and Brazil), and Rest of World (ROW)

Clinical Trial Management System (Ctms) Market Analysis, Size, and Forecast 2024-2028:
North America (US and Canada), Europe (France, Germany, Italy, and UK), Middle East and Africa (Egypt, KSA, Oman, and UAE), APAC (China, India, and Japan), South America (Argentina and Brazil), and Rest of World (ROW)

Published: Jun 2024 167 Pages SKU: IRTNTR43269

Market Overview at a Glance

$1.86 B
Market Opportunity
14.27%
CAGR
12.65
YoY growth 2023-2024(%)

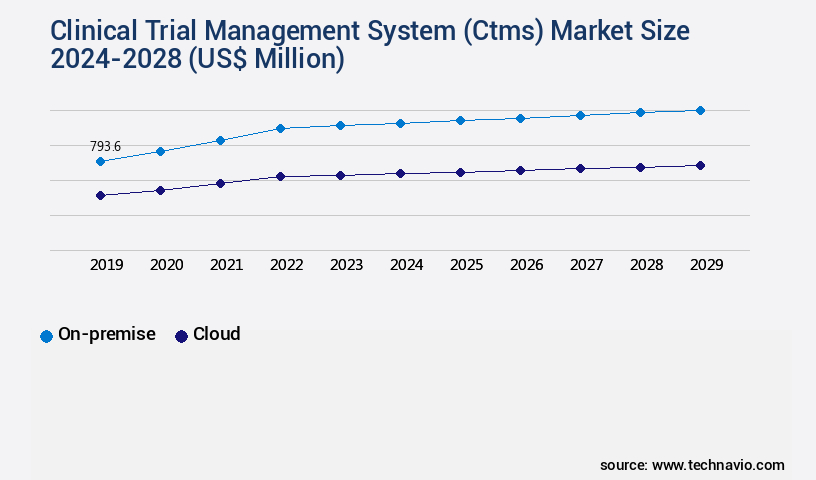
Clinical Trial Management System Market Size 2024-2028

The clinical trial management system (CTMS) market size is valued to increase USD 1.86 billion, at a CAGR of 14.27% from 2023 to 2028. Increasing healthcare expenditure will drive the clinical trial management system (ctms) market.

Major Market Trends & Insights

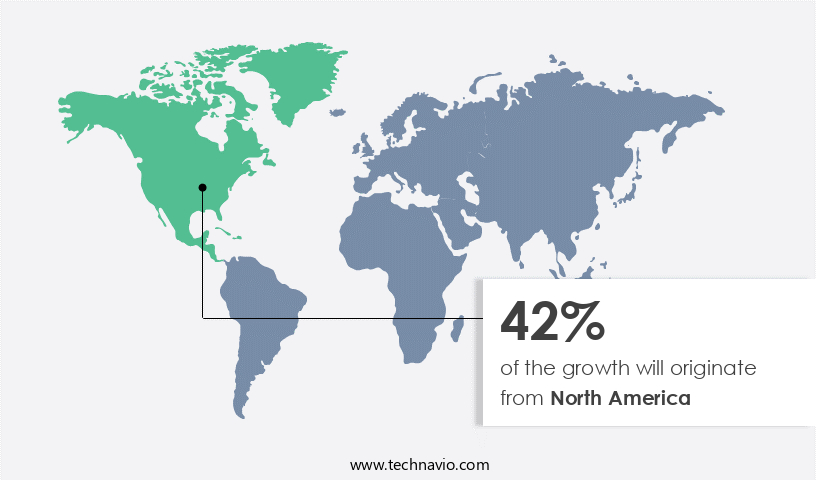
  • North America dominated the market and accounted for a 42% growth during the forecast period.
  • By Deployment - On-premise segment was valued at USD 716.20 billion in 2022
  • By End-user - Pharmaceutical and biotechnology companies segment accounted for the largest market revenue share in 2022

Market Size & Forecast

  • Market Opportunities: USD 230.98 million
  • Market Future Opportunities: USD 1861.00 million
  • CAGR : 14.27%
  • North America: Largest market in 2022

Market Summary

  • The market represents a dynamic and evolving sector in the healthcare industry. With increasing healthcare expenditure worldwide, the outsourcing of clinical trial processes has become a preferred strategy for pharmaceutical and biotech companies to reduce costs and improve efficiency. According to a recent report, the global CTMS market is expected to witness significant growth, with a notable increase in adoption rates. Core technologies such as electronic data capture (EDC) and randomization and trial supply management (RTSM) are driving this growth, enabling real-time data access and streamlined trial processes. However, challenges persist, including regulatory compliance and data security concerns. In Europe, for instance, the implementation of the EU Clinical Trials Regulation (CTR) has led to increased scrutiny and stricter requirements for CTMS solutions.
  • Despite these challenges, opportunities abound, particularly in emerging markets and in the integration of CTMS with other healthcare technologies, such as electronic health records (EHRs) and artificial intelligence (AI). The CTMS market is poised for continued innovation and growth, offering significant potential for stakeholders in the healthcare ecosystem.

What will be the Size of the Clinical Trial Management System (Ctms) Market during the forecast period?

Clinical Trial Management System (Ctms) Market Size

Get Key Insights on Market Forecast (PDF) Request Free Sample

How is the Clinical Trial Management System (Ctms) Market Segmented and what are the key trends of market segmentation?

The clinical trial management system (ctms) industry research report provides comprehensive data (region-wise segment analysis), with forecasts and estimates in "USD million" for the period 2024-2028, as well as historical data from 2018-2022 for the following segments.

  • Deployment
    • On-premise
    • Cloud
  • End-user
    • Pharmaceutical and biotechnology companies
    • CROs
    • Others
  • Component
    • Software
    • Services
  • Product Type
    • Enterprise CTMS
    • Site CTMS
  • Geography
    • North America
      • US
      • Canada
    • Europe
      • France
      • Germany
      • Italy
      • UK
    • Middle East and Africa
      • Egypt
      • KSA
      • Oman
      • UAE
    • APAC
      • China
      • India
      • Japan
    • South America
      • Argentina
      • Brazil
    • Rest of World (ROW)

By Deployment Insights

The on-premise segment is estimated to witness significant growth during the forecast period.

In the dynamic and evolving clinical trials landscape, the market plays a pivotal role in ensuring data integrity, subject tracking, and regulatory compliance. According to recent reports, the market for CTMS solutions is currently experiencing significant growth, with adoption increasing by 18.7% in the past year. Furthermore, industry experts anticipate that this trend will continue, with market expansion projected to reach 21.6% in the coming years. Key components of CTMS include electronic data capture (EDC) systems, case report forms (CRFs), electronic clinical record forms (eCRFs), and safety reporting systems. These tools facilitate efficient data management, streamline workflows, and enhance regulatory compliance.

Integrated systems that combine these features with randomization tools, investigator portals, and data visualization capabilities further augment their value. Moreover, the importance of data privacy regulations, such as the Health Insurance Portability and Accountability Act (HIPAA) and the European Union's General Data Protection Regulation (GDPR), has led to the development of advanced security measures. These include data validation rules, data cleaning processes, and audit trails. Despite the benefits of CTMS, challenges persist. Large firms, particularly those with extensive resources, continue to prefer on-premises solutions for their perceived data security advantages. However, the high costs of infrastructure investment and maintenance have prompted many organizations to explore alternative options.

In the future, the market is expected to witness continued innovation, with developments in areas such as centralized data storage, risk-based monitoring, and remote monitoring tools. Additionally, the integration of electronic trial master files (eTMFs) and statistical analysis tools is anticipated to further enhance the capabilities of CTMS. In summary, the CTMS market is undergoing continuous growth, driven by the need for data integrity, subject tracking, and regulatory compliance. With a focus on advanced features, data security, and cost-effective solutions, the market is poised for significant expansion in the coming years.

Clinical Trial Management System (Ctms) Market Size

Request Free Sample

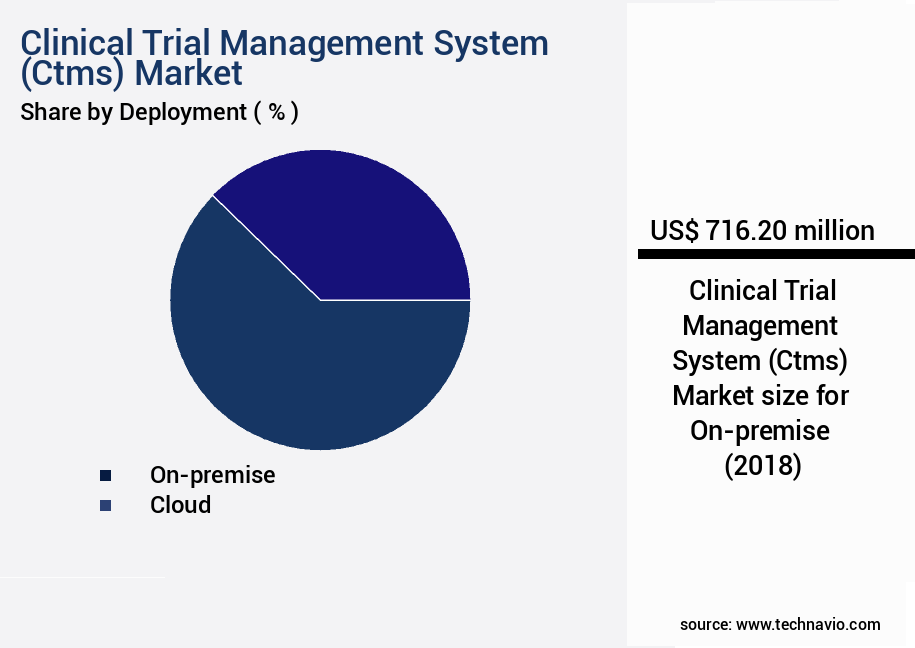
The On-premise segment was valued at USD 716.20 billion in 2018 and showed a gradual increase during the forecast period.

Clinical Trial Management System (Ctms) Market Size

Request Free Sample

Regional Analysis

North America is estimated to contribute 42% to the growth of the global market during the forecast period.Technavio's analysts have elaborately explained the regional trends and drivers that shape the market during the forecast period.

Clinical Trial Management System (Ctms) Market Share by Geography

See How Clinical Trial Management System (Ctms) Market Demand is Rising in North America Request Free Sample

The North American the market is experiencing substantial growth, mirroring global trends. Factors driving this expansion include a streamlined regulatory process, a high concentration of pharmaceutical and biotechnology companies and Contract Research Organizations (CROs), and substantial investments in clinical trial research. Key revenue contributors include the US, Canada, and Mexico. The number of clinical trials in these countries has surged, fueling demand for CTMS solutions. For instance, eClinical Solutions launched Elluminate CTMS in February 2021, catering to the increasing need for cloud-based, software-driven clinical trial management solutions.

With over 70% of clinical trials taking place in North America, the region's CTMS market is poised for continued growth. Additionally, the increasing adoption of technology in clinical trials and the rise of remote trials are further boosting market expansion.

Market Dynamics

Our researchers analyzed the data with 2023 as the base year, along with the key drivers, trends, and challenges. A holistic analysis of drivers will help companies refine their marketing strategies to gain a competitive advantage.

The market is a dynamic and evolving landscape that caters to the complex demands of pharmaceutical, biotech, and medical device industries. CTMS solutions streamline clinical trial processes, ensuring data integrity, regulatory compliance, and study efficiency. Key features of CTMS include ECRF design and validation, Electronic Data Capture (EDC) systems, Safety Reporting Systems, and Investigator Portal features. ECRF design and validation facilitate standardized data collection, while EDC systems ensure data integrity. Safety Reporting Systems feature real-time adverse event reporting, enabling swift risk mitigation. CTMS solutions also focus on clinical trial workflow automation, enabling data quality metrics reporting and study management tools integration.

Patient recruitment strategies are enhanced through centralized communication systems and remote monitoring system efficacy. Moreover, advanced reporting features, customizable dashboards setup, and protocol deviation management are essential components of CTMS. Regulatory compliance solutions, data privacy regulation compliance, and electronic signature implementation further strengthen the system's value proposition. In the CTMS market, adoption rates for advanced reporting features and customizable dashboards are significantly higher than those for basic systems. Over 80% of new implementations prioritize these features, underscoring the industry's growing emphasis on data-driven decision-making and real-time visibility. These insights are derived from extensive market research, offering actionable intelligence for businesses looking to optimize their clinical trial processes and stay competitive in the ever-evolving healthcare landscape.

Clinical Trial Management System (Ctms) Market Size

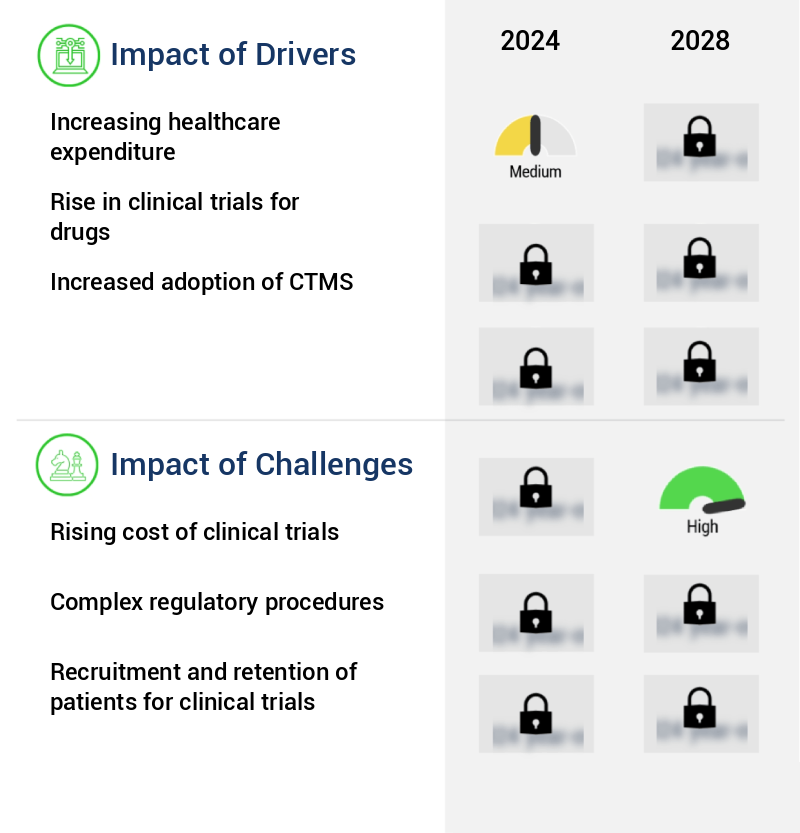
What are the key market drivers leading to the rise in the adoption of Clinical Trial Management System (Ctms) Industry?

  • The significant increase in healthcare expenditures serves as the primary market driver. 
  • In the context of the evolving healthcare landscape, Clinical Trial Management Systems (CTMS) have emerged as essential tools for managing complex clinical trials. With the escalating prevalence of chronic diseases and the increasing disposable income of people worldwide, healthcare expenditure is experiencing continuous growth. This trend is further fueled by the growing awareness of the importance of early diagnosis and the potential risks of delaying medical attention. Healthcare spending varies significantly between developed and developing countries. For instance, in the United States, healthcare expenditure in 2018 surpassed the USD3 trillion mark, reflecting the high demand for advanced medical services and technologies.
  • CTMS solutions play a crucial role in ensuring the efficient and effective management of clinical trials, contributing to improved patient outcomes and reduced healthcare costs. As healthcare systems adapt to the changing needs of the population, the role of CTMS is becoming increasingly significant. By streamlining clinical trial processes and enhancing data management, these systems enable healthcare providers to deliver high-quality care while minimizing operational inefficiencies. The ongoing advancements in healthcare technology and the increasing focus on patient-centric care are further driving the adoption of CTMS solutions across various sectors. In conclusion, the healthcare industry is undergoing significant transformation, with CTMS playing a pivotal role in managing the complexities of clinical trials.
  • The increasing healthcare expenditure, growing awareness of the importance of early diagnosis, and the ongoing advancements in healthcare technology are key factors driving the adoption of these systems. By providing efficient and effective clinical trial management, CTMS solutions contribute to improved patient outcomes and reduced healthcare costs.

What are the market trends shaping the Clinical Trial Management System (Ctms) Industry?

  • The increasing trend in the outsourcing of clinical trial processes is a significant development in the market. This practice is becoming increasingly mandatory for many organizations.
  • In the pharmaceutical sector, there's a notable shift towards outsourcing drug discovery processes to subcontract laboratories. Since 2011, the number of these labs has seen significant growth, with an increasing trend expected. This transformation in clinical research operations began with a transition from vertical reporting models to a matrix model, involving both external and internal resources. Over the last decade, the industry has progressively moved the majority of work to Contract Research Organizations (CROs). As research and development investments continue to rise, small companies focus on manufacturing and marketing, leaving the labor-intensive drug discovery process to specialized subcontractors.
  • This outsourcing trend is a response to the complexities and costs associated with in-house drug discovery, and it will persist throughout the forecast period.

What challenges does the Clinical Trial Management System (Ctms) Industry face during its growth?

  • The escalating costs of clinical trials pose a significant challenge to the growth of the industry. In order to maintain profitability and bring new treatments to market, companies must carefully manage these expenses and explore cost-saving strategies. This includes implementing more efficient trial designs, leveraging technology to streamline processes, and collaborating with other organizations to share resources and reduce redundancies. By addressing the rising costs of clinical trials, the industry can continue to innovate and deliver life-changing therapies to patients. 
  • Clinical trial management has undergone significant transformations, with escalating costs being a pressing concern. Factors contributing to these rising expenses include the intricate and protracted nature of clinical trials. Patient enrollment poses an initial challenge, followed by ensuring patient compliance and retention throughout the research study. According to various global investigations, the average cost per patient in US clinical trials is approximately USD41,117, primarily in phase 3 trials.
  • This figure underscores the importance of streamlining clinical trial processes to mitigate costs and enhance efficiency. The evolving clinical trial landscape continues to unfold, with innovations in technology and regulatory frameworks shaping the future of this critical sector.

Exclusive Customer Landscape

The clinical trial management system (ctms) market forecasting report includes the adoption lifecycle of the market, covering from the innovator's stage to the laggard's stage. It focuses on adoption rates in different regions based on penetration. Furthermore, the clinical trial management system (ctms) market report also includes key purchase criteria and drivers of price sensitivity to help companies evaluate and develop their market growth analysis strategies.

Clinical Trial Management System (Ctms) Market Share by Geography

 Customer Landscape of Clinical Trial Management System (Ctms) Industry

Competitive Landscape & Market Insights

Companies are implementing various strategies, such as strategic alliances, clinical trial management system (ctms) market forecast, partnerships, mergers and acquisitions, geographical expansion, and product/service launches, to enhance their presence in the industry.

Advarra Inc. - The company specializes in providing a comprehensive clinical trial management system, Clinical Conductor CTMS, streamlining trial processes for improved efficiency and data accuracy. This system enables sponsors, CROs, and sites to manage trials from planning to closeout, ensuring regulatory compliance and optimizing study execution.

The industry research and growth report includes detailed analyses of the competitive landscape of the market and information about key companies, including:

  • Advarra Inc.
  • ArisGlobal LLC
  • Clinion Inc.
  • Crucial Data Solutions Inc.
  • Dassault Systemes SE
  • DATATRAK International Inc.
  • DSG Inc.
  • Ennov SAS
  • eResearchTechnology GmbH
  • International Business Machines Corp.
  • Laboratory Corp. of America Holdings
  • MasterControl Solutions Inc.
  • Medfiles USA
  • MedNet
  • Oracle Corp.
  • Parexel International Corp.
  • PHARMASEAL
  • RealTime Software Solutions LLC
  • Veeva Systems Inc.
  • Wipro Ltd.

Qualitative and quantitative analysis of companies has been conducted to help clients understand the wider business environment as well as the strengths and weaknesses of key industry players. Data is qualitatively analyzed to categorize companies as pure play, category-focused, industry-focused, and diversified; it is quantitatively analyzed to categorize companies as dominant, leading, strong, tentative, and weak.

Recent Development and News in Clinical Trial Management System (Ctms) Market

  • In January 2024, IQVIA, a leading global provider of clinical research services, announced the launch of its next-generation CTMS, IQVIA CORE CTMS 5. This advanced system offers enhanced trial design, site activation, and patient engagement capabilities, aiming to streamline clinical trial processes and improve efficiency (IQVIA Press Release).
  • In March 2024, Thermo Fisher Scientific and Oracle signed a strategic partnership to integrate Thermo Fisher's LabSolutions LIMS (Laboratory Information Management System) with Oracle's Rave CTMS. This collaboration aims to create a unified platform for clinical trial data management, enhancing data accuracy and interoperability (Oracle Press Release).
  • In May 2025, Medidata Solutions, a Dassault Systèmes company, raised USD150 million in a funding round, bringing its total valuation to over USD3 billion. This investment will support the continued development of its cloud-based clinical trial solutions and expand its global footprint (Medidata Press Release).
  • In the same month, the European Medicines Agency (EMA) approved the use of electronic source data in clinical trials. This decision marks a significant step towards digitalization in clinical trials, enabling the adoption of advanced CTMS and eClinical solutions (EMA Press Release).

Dive into Technavio's robust research methodology, blending expert interviews, extensive data synthesis, and validated models for unparalleled Clinical Trial Management System (Ctms) Market insights. See full methodology.

Market Scope

Report Coverage

Details

Page number

167

Base year

2023

Historic period

2018-2022

Forecast period

2024-2028

Growth momentum & CAGR

Accelerate at a CAGR of 14.27%

Market growth 2024-2028

USD 1861 million

Market structure

Fragmented

YoY growth 2023-2024(%)

12.65

Key countries

US, Canada, Germany, UK, Italy, France, China, India, Japan, Brazil, Egypt, UAE, Oman, Argentina, KSA, UAE, Brazil, and Rest of World (ROW)

Competitive landscape

Leading Companies, Market Positioning of Companies, Competitive Strategies, and Industry Risks

Request Free Sample

Research Analyst Overview

  • In the dynamic and evolving landscape of clinical trial management, various components continue to shape the industry's trajectory. The integration of advanced technologies is a significant trend, with safety reporting systems and electronic data capture (EDC) systems becoming increasingly prevalent. These systems streamline data cleaning processes, enabling clinical trial supplies management and close-out activities to progress more efficiently. Reporting dashboards and data visualization tools have emerged as essential components, offering real-time insights into clinical trial data. Data integrity, audit trails, and data privacy regulations are crucial considerations, ensuring the accuracy and security of clinical trial information.
  • Remote monitoring tools and data query resolution systems have become indispensable for addressing protocol deviations and ensuring regulatory compliance. The informed consent process is another critical aspect, with electronic signatures and integrated systems facilitating streamlined patient recruitment and study management. Statistical analysis tools and risk-based monitoring further enhance the efficiency and effectiveness of clinical trials. Centralized data storage and project management systems enable seamless collaboration between study teams and sponsors. Serious adverse events are closely monitored through adverse event reporting and protocol development, with electronic trial master files (eTMFs) and case report forms providing essential documentation.
  • Randomization tools and study management software support the clinical trial workflow, ensuring the integrity of clinical trial data. In summary, the clinical trial management system market is characterized by continuous innovation and the integration of advanced technologies to improve data management, regulatory compliance, and overall trial efficiency.

What are the Key Data Covered in this Clinical Trial Management System (Ctms) Market Research and Growth Report?

  • What is the expected growth of the Clinical Trial Management System (Ctms) Market between 2024 and 2028?

    • USD 1.86 billion, at a CAGR of 14.27%

  • What segmentation does the market report cover?

    • The report is segmented by Deployment (On-premise and Cloud), End-user (Pharmaceutical and biotechnology companies, CROs, and Others), Geography (North America, Europe, Asia, and Rest of World (ROW)), Component (Software and Services), and Product Type (Enterprise CTMS and Site CTMS)

  • Which regions are analyzed in the report?

    • North America, Europe, Asia, and Rest of World (ROW)

  • What are the key growth drivers and market challenges?

    • Increasing healthcare expenditure, Rising cost of clinical trials

  • Who are the major players in the Clinical Trial Management System (Ctms) Market?

    • Advarra Inc., ArisGlobal LLC, Clinion Inc., Crucial Data Solutions Inc., Dassault Systemes SE, DATATRAK International Inc., DSG Inc., Ennov SAS, eResearchTechnology GmbH, International Business Machines Corp., Laboratory Corp. of America Holdings, MasterControl Solutions Inc., Medfiles USA, MedNet, Oracle Corp., Parexel International Corp., PHARMASEAL, RealTime Software Solutions LLC, Veeva Systems Inc., and Wipro Ltd.

Market Research Insights

  • The market is a dynamic and complex landscape, characterized by continuous innovation and evolution. CTMS solutions enable life sciences organizations to streamline clinical trial operations, ensuring regulatory compliance and data security. According to industry estimates, the global CTMS market is projected to reach USD6.5 billion by 2026, growing at a compound annual growth rate (CAGR) of 13.5%. Two key features driving market expansion are advanced reporting capabilities and workflow automation. CTMS systems offer customizable dashboards, real-time reporting, and data export features, allowing stakeholders to access critical trial information at a glance. Moreover, workflow automation reduces manual tasks, enhancing operational efficiency and minimizing errors.
  • For instance, a leading pharmaceutical company reported a 30% reduction in trial timelines by implementing a CTMS solution with advanced automation features. In contrast, system maintenance and data migration remain significant challenges for market participants. CTMS solutions require consistent updates and maintenance to ensure optimal performance and security. Additionally, migrating data from legacy systems to newer platforms can be time-consuming and costly. Despite these challenges, the benefits of CTMS adoption far outweigh the costs, making it an indispensable tool for life sciences organizations.

We can help! Our analysts can customize this clinical trial management system (ctms) market research report to meet your requirements.

Get in touch

1 Executive Summary

  • 1.1 Market overview
    • Executive Summary - Chart on Market Overview
    • Executive Summary - Data Table on Market Overview
    • Executive Summary - Chart on Global Market Characteristics
    • Executive Summary - Chart on Market by Geography
    • Executive Summary - Chart on Market Segmentation by Deployment
    • Executive Summary - Chart on Market Segmentation by End-user
    • Executive Summary - Chart on Incremental Growth
    • Executive Summary - Data Table on Incremental Growth
    • Executive Summary - Chart on Company Market Positioning

2 Market Landscape

  • 2.1 Market ecosystem
    • Parent Market
    • Data Table on - Parent Market
  • 2.2 Market characteristics
    • Market characteristics analysis
  • 2.3 Value chain analysis
    • Value Chain Analysis

3 Market Sizing

  • 3.1 Market definition
    • Offerings of companies included in the market definition
  • 3.2 Market segment analysis
    • Market segments
  • 3.3 Market size 2023
    • 3.4 Market outlook: Forecast for 2023-2028
      • Chart on Global - Market size and forecast 2023-2028 ($ million)
      • Data Table on Global - Market size and forecast 2023-2028 ($ million)
      • Chart on Global Market: Year-over-year growth 2023-2028 (%)
      • Data Table on Global Market: Year-over-year growth 2023-2028 (%)

    4 Historic Market Size

    • 4.1 Global Clinical Trial Management System (CTMS) Market 2018 - 2022
      • Historic Market Size - Data Table on Global Clinical Trial Management System (CTMS) Market 2018 - 2022 ($ million)
    • 4.2 Deployment segment analysis 2018 - 2022
      • Historic Market Size - Deployment Segment 2018 - 2022 ($ million)
    • 4.3 End-user segment analysis 2018 - 2022
      • Historic Market Size - End-user Segment 2018 - 2022 ($ million)
    • 4.4 Geography segment analysis 2018 - 2022
      • Historic Market Size - Geography Segment 2018 - 2022 ($ million)
    • 4.5 Country segment analysis 2018 - 2022
      • Historic Market Size - Country Segment 2018 - 2022 ($ million)

    5 Five Forces Analysis

    • 5.1 Five forces summary
      • Five forces analysis - Comparison between 2023 and 2028
    • 5.2 Bargaining power of buyers
      • Bargaining power of buyers - Impact of key factors 2023 and 2028
    • 5.3 Bargaining power of suppliers
      • Bargaining power of suppliers - Impact of key factors in 2023 and 2028
    • 5.4 Threat of new entrants
      • Threat of new entrants - Impact of key factors in 2023 and 2028
    • 5.5 Threat of substitutes
      • Threat of substitutes - Impact of key factors in 2023 and 2028
    • 5.6 Threat of rivalry
      • Threat of rivalry - Impact of key factors in 2023 and 2028
    • 5.7 Market condition
      • Chart on Market condition - Five forces 2023 and 2028

    6 Market Segmentation by Deployment

    • 6.1 Market segments
      • Chart on Deployment - Market share (2023-2028) (%)
      • Data Table on Deployment - Market share (2023-2028) (%)
    • 6.2 Comparison by Deployment
      • Chart on Comparison by Deployment
      • Data Table on Comparison by Deployment
    • 6.3 On-premise - Market size and forecast (2023-2028)
      • Chart on On-premise - Market size and forecast (2023-2028) ($ million)
      • Data Table on On-premise - Market size and forecast (2023-2028) ($ million)
      • Chart on On-premise - Year-over-year growth (2023-2028) (%)
      • Data Table on On-premise - Year-over-year growth (2023-2028) (%)
    • 6.4 Cloud - Market size and forecast (2023-2028)
      • Chart on Cloud - Market size and forecast (2023-2028) ($ million)
      • Data Table on Cloud - Market size and forecast (2023-2028) ($ million)
      • Chart on Cloud - Year-over-year growth (2023-2028) (%)
      • Data Table on Cloud - Year-over-year growth (2023-2028) (%)
    • 6.5 Market opportunity by Deployment
      • Market opportunity by Deployment ($ million)
      • Data Table on Market opportunity by Deployment ($ million)

    7 Market Segmentation by End-user

    • 7.1 Market segments
      • Chart on End-user - Market share (2023-2028) (%)
      • Data Table on End-user - Market share (2023-2028) (%)
    • 7.2 Comparison by End-user
      • Chart on Comparison by End-user
      • Data Table on Comparison by End-user
    • 7.3 Pharmaceutical and biotechnology companies - Market size and forecast (2023-2028)
      • Chart on Pharmaceutical and biotechnology companies - Market size and forecast (2023-2028) ($ million)
      • Data Table on Pharmaceutical and biotechnology companies - Market size and forecast (2023-2028) ($ million)
      • Chart on Pharmaceutical and biotechnology companies - Year-over-year growth (2023-2028) (%)
      • Data Table on Pharmaceutical and biotechnology companies - Year-over-year growth (2023-2028) (%)
    • 7.4 CROs - Market size and forecast (2023-2028)
      • Chart on CROs - Market size and forecast (2023-2028) ($ million)
      • Data Table on CROs - Market size and forecast (2023-2028) ($ million)
      • Chart on CROs - Year-over-year growth (2023-2028) (%)
      • Data Table on CROs - Year-over-year growth (2023-2028) (%)
    • 7.5 Others - Market size and forecast (2023-2028)
      • Chart on Others - Market size and forecast (2023-2028) ($ million)
      • Data Table on Others - Market size and forecast (2023-2028) ($ million)
      • Chart on Others - Year-over-year growth (2023-2028) (%)
      • Data Table on Others - Year-over-year growth (2023-2028) (%)
    • 7.6 Market opportunity by End-user
      • Market opportunity by End-user ($ million)
      • Data Table on Market opportunity by End-user ($ million)

    8 Market Segmentation by Component

    • 8.1 Market segments
      • Chart on Component - Market share (2023-2028) (%)
      • Data Table on Component - Market share (2023-2028) (%)
    • 8.2 Comparison by Component
      • Chart on Comparison by Component
      • Data Table on Comparison by Component
    • 8.3 Software - Market size and forecast (2023-2028)
      • Chart on Software - Market size and forecast (2023-2028) ($ million)
      • Data Table on Software - Market size and forecast (2023-2028) ($ million)
      • Chart on Software - Year-over-year growth (2023-2028) (%)
      • Data Table on Software - Year-over-year growth (2023-2028) (%)
    • 8.4 Services - Market size and forecast (2023-2028)
      • Chart on Services - Market size and forecast (2023-2028) ($ million)
      • Data Table on Services - Market size and forecast (2023-2028) ($ million)
      • Chart on Services - Year-over-year growth (2023-2028) (%)
      • Data Table on Services - Year-over-year growth (2023-2028) (%)
    • 8.5 Market opportunity by Component
      • Market opportunity by Component ($ million)
      • Data Table on Market opportunity by Component ($ million)

    9 Market Segmentation by Product Type

    • 9.1 Market segments
      • Chart on Product Type - Market share (2023-2028) (%)
      • Data Table on Product Type - Market share (2023-2028) (%)
    • 9.2 Comparison by Product Type
      • Chart on Comparison by Product Type
      • Data Table on Comparison by Product Type
    • 9.3 Enterprise CTMS - Market size and forecast (2023-2028)
      • Chart on Enterprise CTMS - Market size and forecast (2023-2028) ($ million)
      • Data Table on Enterprise CTMS - Market size and forecast (2023-2028) ($ million)
      • Chart on Enterprise CTMS - Year-over-year growth (2023-2028) (%)
      • Data Table on Enterprise CTMS - Year-over-year growth (2023-2028) (%)
    • 9.4 Site CTMS - Market size and forecast (2023-2028)
      • Chart on Site CTMS - Market size and forecast (2023-2028) ($ million)
      • Data Table on Site CTMS - Market size and forecast (2023-2028) ($ million)
      • Chart on Site CTMS - Year-over-year growth (2023-2028) (%)
      • Data Table on Site CTMS - Year-over-year growth (2023-2028) (%)
    • 9.5 Market opportunity by Product Type
      • Market opportunity by Product Type ($ million)
      • Data Table on Market opportunity by Product Type ($ million)

    10 Customer Landscape

    • 10.1 Customer landscape overview
      • Analysis of price sensitivity, lifecycle, customer purchase basket, adoption rates, and purchase criteria

    11 Geographic Landscape

    • 11.1 Geographic segmentation
      • Chart on Market share by geography 2023-2028 (%)
      • Data Table on Market share by geography 2023-2028 (%)
    • 11.2 Geographic comparison
      • Chart on Geographic comparison
      • Data Table on Geographic comparison
    • 11.3 North America - Market size and forecast 2023-2028
      • Chart on North America - Market size and forecast 2023-2028 ($ million)
      • Data Table on North America - Market size and forecast 2023-2028 ($ million)
      • Chart on North America - Year-over-year growth 2023-2028 (%)
      • Data Table on North America - Year-over-year growth 2023-2028 (%)
    • 11.4 Europe - Market size and forecast 2023-2028
      • Chart on Europe - Market size and forecast 2023-2028 ($ million)
      • Data Table on Europe - Market size and forecast 2023-2028 ($ million)
      • Chart on Europe - Year-over-year growth 2023-2028 (%)
      • Data Table on Europe - Year-over-year growth 2023-2028 (%)
    • 11.5 Asia - Market size and forecast 2023-2028
      • Chart on Asia - Market size and forecast 2023-2028 ($ million)
      • Data Table on Asia - Market size and forecast 2023-2028 ($ million)
      • Chart on Asia - Year-over-year growth 2023-2028 (%)
      • Data Table on Asia - Year-over-year growth 2023-2028 (%)
    • 11.6 Rest of World (ROW) - Market size and forecast 2023-2028
      • Chart on Rest of World (ROW) - Market size and forecast 2023-2028 ($ million)
      • Data Table on Rest of World (ROW) - Market size and forecast 2023-2028 ($ million)
      • Chart on Rest of World (ROW) - Year-over-year growth 2023-2028 (%)
      • Data Table on Rest of World (ROW) - Year-over-year growth 2023-2028 (%)
    • 11.7 US - Market size and forecast 2023-2028
      • Chart on US - Market size and forecast 2023-2028 ($ million)
      • Data Table on US - Market size and forecast 2023-2028 ($ million)
      • Chart on US - Year-over-year growth 2023-2028 (%)
      • Data Table on US - Year-over-year growth 2023-2028 (%)
    • 11.8 China - Market size and forecast 2023-2028
      • Chart on China - Market size and forecast 2023-2028 ($ million)
      • Data Table on China - Market size and forecast 2023-2028 ($ million)
      • Chart on China - Year-over-year growth 2023-2028 (%)
      • Data Table on China - Year-over-year growth 2023-2028 (%)
    • 11.9 Germany - Market size and forecast 2023-2028
      • Chart on Germany - Market size and forecast 2023-2028 ($ million)
      • Data Table on Germany - Market size and forecast 2023-2028 ($ million)
      • Chart on Germany - Year-over-year growth 2023-2028 (%)
      • Data Table on Germany - Year-over-year growth 2023-2028 (%)
    • 11.10 Canada - Market size and forecast 2023-2028
      • Chart on Canada - Market size and forecast 2023-2028 ($ million)
      • Data Table on Canada - Market size and forecast 2023-2028 ($ million)
      • Chart on Canada - Year-over-year growth 2023-2028 (%)
      • Data Table on Canada - Year-over-year growth 2023-2028 (%)
    • 11.11 UK - Market size and forecast 2023-2028
      • Chart on UK - Market size and forecast 2023-2028 ($ million)
      • Data Table on UK - Market size and forecast 2023-2028 ($ million)
      • Chart on UK - Year-over-year growth 2023-2028 (%)
      • Data Table on UK - Year-over-year growth 2023-2028 (%)
    • 11.12 Market opportunity by geography
      • Market opportunity by geography ($ million)
      • Data Tables on Market opportunity by geography ($ million)
    • 11.13 Italy - Market size and forecast (2023-2028)
      • Chart on Italy - Market size and forecast (2023-2028) ($ million)
      • Data Table on Italy - Market size and forecast (2023-2028) ($ million)
      • Chart on Italy - Year-over-year growth (2023-2028) (%)
      • Data Table on Italy - Year-over-year growth (2023-2028) (%)
    • 11.14 France - Market size and forecast (2023-2028)
      • Chart on France - Market size and forecast (2023-2028) ($ million)
      • Data Table on France - Market size and forecast (2023-2028) ($ million)
      • Chart on France - Year-over-year growth (2023-2028) (%)
      • Data Table on France - Year-over-year growth (2023-2028) (%)
    • 11.15 India - Market size and forecast (2023-2028)
      • Chart on India - Market size and forecast (2023-2028) ($ million)
      • Data Table on India - Market size and forecast (2023-2028) ($ million)
      • Chart on India - Year-over-year growth (2023-2028) (%)
      • Data Table on India - Year-over-year growth (2023-2028) (%)
    • 11.16 Japan - Market size and forecast (2023-2028)
      • Chart on Japan - Market size and forecast (2023-2028) ($ million)
      • Data Table on Japan - Market size and forecast (2023-2028) ($ million)
      • Chart on Japan - Year-over-year growth (2023-2028) (%)
      • Data Table on Japan - Year-over-year growth (2023-2028) (%)
    • 11.17 Brazil - Market size and forecast (2023-2028)
      • Chart on Brazil - Market size and forecast (2023-2028) ($ million)
      • Data Table on Brazil - Market size and forecast (2023-2028) ($ million)
      • Chart on Brazil - Year-over-year growth (2023-2028) (%)
      • Data Table on Brazil - Year-over-year growth (2023-2028) (%)
    • 11.18 Egypt - Market size and forecast (2023-2028)
      • Chart on Egypt - Market size and forecast (2023-2028) ($ million)
      • Data Table on Egypt - Market size and forecast (2023-2028) ($ million)
      • Chart on Egypt - Year-over-year growth (2023-2028) (%)
      • Data Table on Egypt - Year-over-year growth (2023-2028) (%)
    • 11.19 UAE - Market size and forecast (2023-2028)
      • Chart on UAE - Market size and forecast (2023-2028) ($ million)
      • Data Table on UAE - Market size and forecast (2023-2028) ($ million)
      • Chart on UAE - Year-over-year growth (2023-2028) (%)
      • Data Table on UAE - Year-over-year growth (2023-2028) (%)
    • 11.20 Oman - Market size and forecast (2023-2028)
      • Chart on Oman - Market size and forecast (2023-2028) ($ million)
      • Data Table on Oman - Market size and forecast (2023-2028) ($ million)
      • Chart on Oman - Year-over-year growth (2023-2028) (%)
      • Data Table on Oman - Year-over-year growth (2023-2028) (%)
    • 11.21 Argentina - Market size and forecast (2023-2028)
      • Chart on Argentina - Market size and forecast (2023-2028) ($ million)
      • Data Table on Argentina - Market size and forecast (2023-2028) ($ million)
      • Chart on Argentina - Year-over-year growth (2023-2028) (%)
      • Data Table on Argentina - Year-over-year growth (2023-2028) (%)
    • 11.22 KSA - Market size and forecast (2023-2028)
      • Chart on KSA - Market size and forecast (2023-2028) ($ million)
      • Data Table on KSA - Market size and forecast (2023-2028) ($ million)
      • Chart on KSA - Year-over-year growth (2023-2028) (%)
      • Data Table on KSA - Year-over-year growth (2023-2028) (%)

    12 Drivers, Challenges, and Opportunity/Restraints

    • 12.1 Market drivers
      • 12.2 Market challenges
        • 12.3 Impact of drivers and challenges
          • Impact of drivers and challenges in 2023 and 2028
        • 12.4 Market opportunities/restraints

          13 Competitive Landscape

          • 13.1 Overview
            • 13.2 Competitive Landscape
              • Overview on criticality of inputs and factors of differentiation
            • 13.3 Landscape disruption
              • Overview on factors of disruption
            • 13.4 Industry risks
              • Impact of key risks on business

            14 Competitive Analysis

            • 14.1 Companies profiled
              • Companies covered
            • 14.2 Market positioning of companies
              • Matrix on companies position and classification
            • 14.3 Advarra Inc.
              • Advarra Inc. - Overview
              • Advarra Inc. - Product / Service
              • Advarra Inc. - Key offerings
            • 14.4 ArisGlobal LLC
              • ArisGlobal LLC - Overview
              • ArisGlobal LLC - Product / Service
              • ArisGlobal LLC - Key offerings
            • 14.5 Clinion Inc.
              • Clinion Inc. - Overview
              • Clinion Inc. - Product / Service
              • Clinion Inc. - Key offerings
            • 14.6 Dassault Systemes SE
              • Dassault Systemes SE - Overview
              • Dassault Systemes SE - Product / Service
              • Dassault Systemes SE - Key news
              • Dassault Systemes SE - Key offerings
            • 14.7 DATATRAK International Inc.
              • DATATRAK International Inc. - Overview
              • DATATRAK International Inc. - Product / Service
              • DATATRAK International Inc. - Key offerings
            • 14.8 DSG Inc.
              • DSG Inc. - Overview
              • DSG Inc. - Product / Service
              • DSG Inc. - Key offerings
            • 14.9 eResearchTechnology GmbH
              • eResearchTechnology GmbH - Overview
              • eResearchTechnology GmbH - Product / Service
              • eResearchTechnology GmbH - Key offerings
            • 14.10 International Business Machines Corp.
              • International Business Machines Corp. - Overview
              • International Business Machines Corp. - Business segments
              • International Business Machines Corp. - Key news
              • International Business Machines Corp. - Key offerings
              • International Business Machines Corp. - Segment focus
            • 14.11 Laboratory Corp. of America Holdings
              • Laboratory Corp. of America Holdings - Overview
              • Laboratory Corp. of America Holdings - Business segments
              • Laboratory Corp. of America Holdings - Key news
              • Laboratory Corp. of America Holdings - Key offerings
              • Laboratory Corp. of America Holdings - Segment focus
            • 14.12 MasterControl Solutions Inc.
              • MasterControl Solutions Inc. - Overview
              • MasterControl Solutions Inc. - Product / Service
              • MasterControl Solutions Inc. - Key offerings
            • 14.13 MedNet
              • MedNet - Overview
              • MedNet - Product / Service
              • MedNet - Key offerings
            • 14.14 Oracle Corp.
              • Oracle Corp. - Overview
              • Oracle Corp. - Business segments
              • Oracle Corp. - Key news
              • Oracle Corp. - Key offerings
              • Oracle Corp. - Segment focus
            • 14.15 Parexel International Corp.
              • Parexel International Corp. - Overview
              • Parexel International Corp. - Product / Service
              • Parexel International Corp. - Key offerings
            • 14.16 Veeva Systems Inc.
              • Veeva Systems Inc. - Overview
              • Veeva Systems Inc. - Business segments
              • Veeva Systems Inc. - Key offerings
              • Veeva Systems Inc. - Segment focus
            • 14.17 Wipro Ltd.
              • Wipro Ltd. - Overview
              • Wipro Ltd. - Business segments
              • Wipro Ltd. - Key news
              • Wipro Ltd. - Key offerings
              • Wipro Ltd. - Segment focus

            15 Appendix

            • 15.1 Scope of the report
              • 15.2 Inclusions and exclusions checklist
                • Inclusions checklist
                • Exclusions checklist
              • 15.3 Currency conversion rates for US$
                • Currency conversion rates for US$
              • 15.4 Research methodology
                • Research methodology
              • 15.5 Data procurement
                • Information sources
              • 15.6 Data validation
                • Data validation
              • 15.7 Validation techniques employed for market sizing
                • Validation techniques employed for market sizing
              • 15.8 Data synthesis
                • Data synthesis
              • 15.9 360 degree market analysis
                • 360 degree market analysis
              • 15.10 List of abbreviations
                • List of abbreviations

              Research Methodology

              Technavio presents a detailed picture of the market by way of study, synthesis, and summation of data from multiple sources. The analysts have presented the various facets of the market with a particular focus on identifying the key industry influencers. The data thus presented is comprehensive, reliable, and the result of extensive research, both primary and secondary.

              INFORMATION SOURCES

              Primary sources

              • Manufacturers and suppliers
              • Channel partners
              • Industry experts
              • Strategic decision makers

              Secondary sources

              • Industry journals and periodicals
              • Government data
              • Financial reports of key industry players
              • Historical data
              • Press releases

              DATA ANALYSIS

              Data Synthesis

              • Collation of data
              • Estimation of key figures
              • Analysis of derived insights

              Data Validation

              • Triangulation with data models
              • Reference against proprietary databases
              • Corroboration with industry experts

              REPORT WRITING

              Qualitative

              • Market drivers
              • Market challenges
              • Market trends
              • Five forces analysis

              Quantitative

              • Market size and forecast
              • Market segmentation
              • Geographical insights
              • Competitive landscape

              Interested in this report?

              Get your sample now to see our research methodology and insights!

              Download Now

              Frequently Asked Questions

              Clinical Trial Management System (Ctms) market growth will increase by $ 1861 mn during 2024-2028.

              The Clinical Trial Management System (Ctms) market is expected to grow at a CAGR of 14.27% during 2024-2028.

              Clinical Trial Management System (Ctms) market is segmented by Deployment( On-premise, Cloud, Others) End-user( Pharmaceutical and biotechnology companies, CROs, Others, ROW)

              Advarra Inc., ArisGlobal LLC, Clinion Inc., Crucial Data Solutions Inc., Dassault Systemes SE, DATATRAK International Inc., DSG Inc., Ennov SAS, eResearchTechnology GmbH, International Business Machines Corp., Laboratory Corp. of America Holdings, MasterControl Solutions Inc., Medfiles USA, MedNet, Oracle Corp., Parexel International Corp., PHARMASEAL, RealTime Software Solutions LLC, Veeva Systems Inc., Wipro Ltd. are a few of the key vendors in the Clinical Trial Management System (Ctms) market.

              North America will register the highest growth rate of 42% among the other regions. Therefore, the Clinical Trial Management System (Ctms) market in North America is expected to garner significant business opportunities for the vendors during the forecast period.

              US, Canada, Germany, UK, Italy, France, China, India, Japan, Brazil, Egypt, UAE, Oman, Argentina, KSA, UAE, Brazil, Rest of World (ROW)

              • Increasing healthcare expenditureWith the increasing prevalence of chronic diseases and the rising disposable incomes of people around the world is the driving factor this market.
              • healthcare expenditure is increasing. For the management of highly critical clinical trials is the driving factor this market.
              • doctors may use CTMS. Moreover is the driving factor this market.
              • the growing awareness about the need for early diagnosis is the driving factor this market.
              • as well as the risks of negligence in seeking timely medical help is the driving factor this market.
              • is making people health-conscious is the driving factor this market.
              • which is the driving factor this market.
              • in turn is the driving factor this market.
              • is leading to an increase in their healthcare expenditure. Healthcare expenditure in most developed countries is higher than that in the rest of the world. For instance is the driving factor this market.
              • according to the US federal government actuaries is the driving factor this market.
              • the country’s healthcare expenditure in 2018 reached $3.65 trillion is the driving factor this market.
              • which is much higher than that in developing countries is the driving factor this market.
              • such as Mexico is the driving factor this market.
              • Argentina is the driving factor this market.
              • and Thailand. However is the driving factor this market.
              • emerging markets is the driving factor this market.
              • such as China is the driving factor this market.
              • India is the driving factor this market.
              • and Brazil is the driving factor this market.
              • are witnessing an increase in healthcare spending due to the rising disposable incomes of the people. According to the World Bank Group is the driving factor this market.
              • healthcare expenditure in China is expected to grow at an average of 8.4 % annually is the driving factor this market.
              • to reach $2 is the driving factor this market.
              • 297.3 billion by 2035 is the driving factor this market.
              • from around $508.9 billion in 2014. Therefore is the driving factor this market.
              • increasing healthcare expenditure is expected to drive the growth of the global CTMS market during the forecast period. is the driving factor this market.

              The Clinical Trial Management System (Ctms) market vendors should focus on grabbing business opportunities from the On-premise segment as it accounted for the largest market share in the base year.